
Java 25's new CPU-Time Profiler (1) - Mostly nerdlessMostly nerdless
Learn all about Java 25's new CPU-time profiler and why it matters in this weeks blog post from the creator himself.| Mostly nerdless
Learn all about Java 25's new CPU-time profiler and why it matters in this weeks blog post from the creator himself.| Mostly nerdless

I want to tell you about a neat experience I had with AI-assisted programming this week. What’s unusual here is: the AI didn’t write a single line of my code. Instead, I used AI to build a custom debugger UI… which made it more fun for me to do the coding myself.| www.geoffreylitt.com
"Why is the Rust compiler so slow?"| sharnoff.io
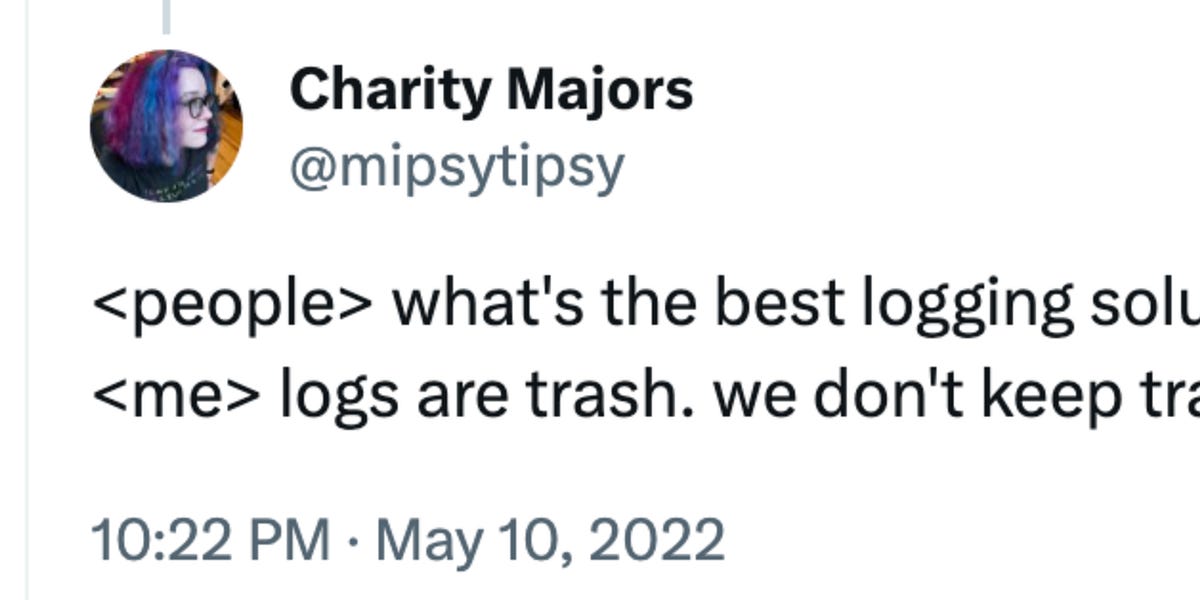
This quote from Charity Majors is probably the best summary of the current state of observability in the tech industry - a total, mass confusion.| isburmistrov.substack.com

We’re sharing details about Strobelight, Meta’s profiling orchestrator. Strobelight combines several technologies, many open source, into a single service that helps engineers at Meta improve effic…| Engineering at Meta
In a previous post, I’ve shown how to use the rayon framework in Rust to automatically parallelize a loop computation across multiple CPU cores.Disappointing...| gendignoux.com

Learn about the changes that further improved client throughput on Linux. With these changes, Tailscale joins the 10Gb/s club on bare metal Linux, and wireguard-go pushes past (for now) the in-kernel WireGuard implementation on that hardware.| tailscale.com
Examples of using the Linux perf command, aka perf_events, for performance analysis and debugging. perf is a profiler and tracer.| www.brendangregg.com

The last finishing touches before our plugin system reaches production.| NullDeref
CPU Flame Graphs| www.brendangregg.com
