If you are a beginner day trader with limited skills and no strategy, then day trading is gambling. However, at a professional level, day trading and gambling are more like running a business; both require a systematic methodology, risk management, skill, and experience to be successful.| Liberated Stock Trader
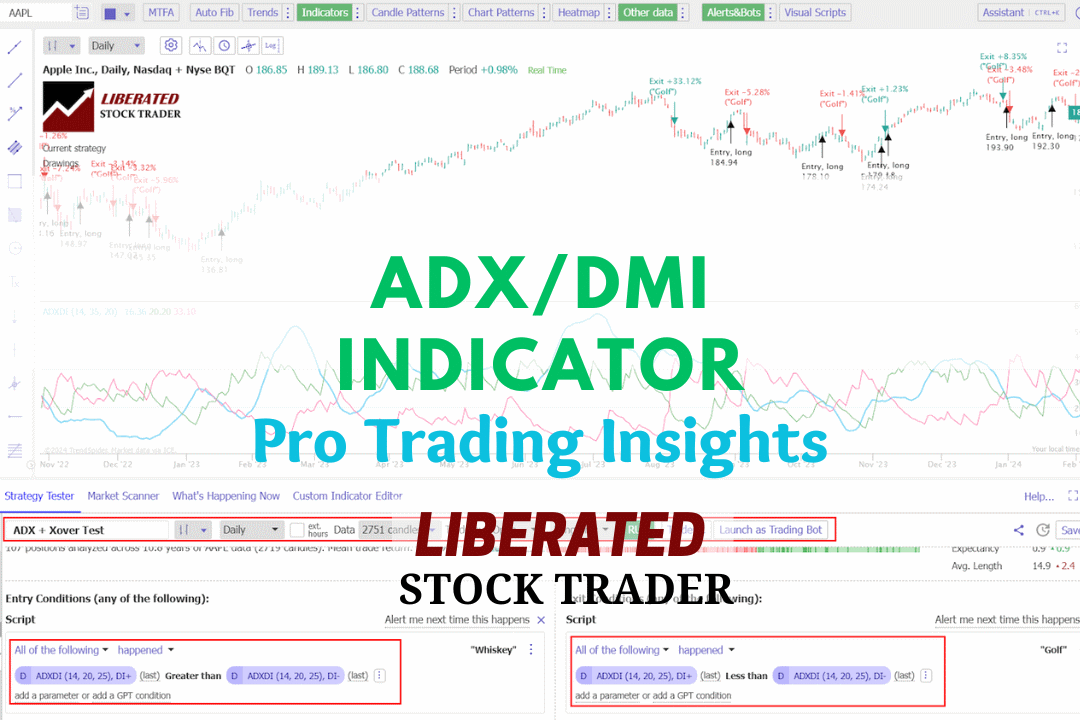
My testing, based on 9,764 trades over 25 years, demonstrates that the DMI indicator is both profitable and reliable, outperforming the S&P 500 index. Here's how to trade it based on the data.| Liberated Stock Trader
Data-driven research, education, and insights for independent investors. We test charts, patterns, indicators, and develop unique growth, dividend, and value investing strategies.| Liberated Stock Trader
Price action trading is a method of day trading that relies on technical analysis but ignores conventional fundamental indicators, focusing instead on the movement of prices.| Liberated Stock Trader
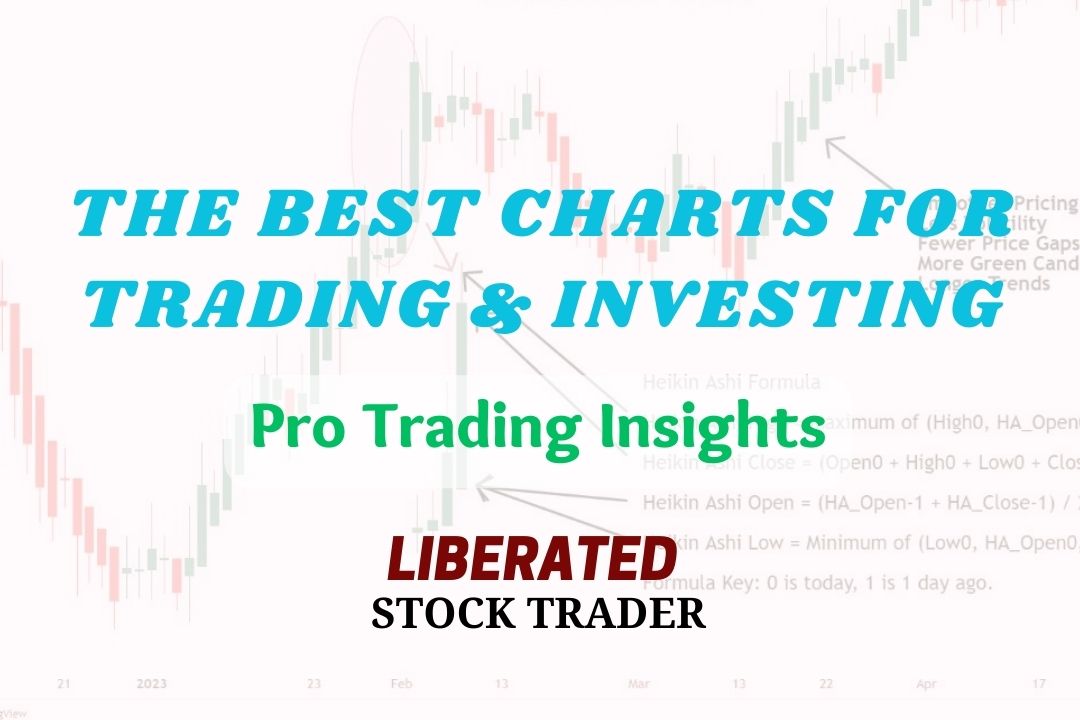
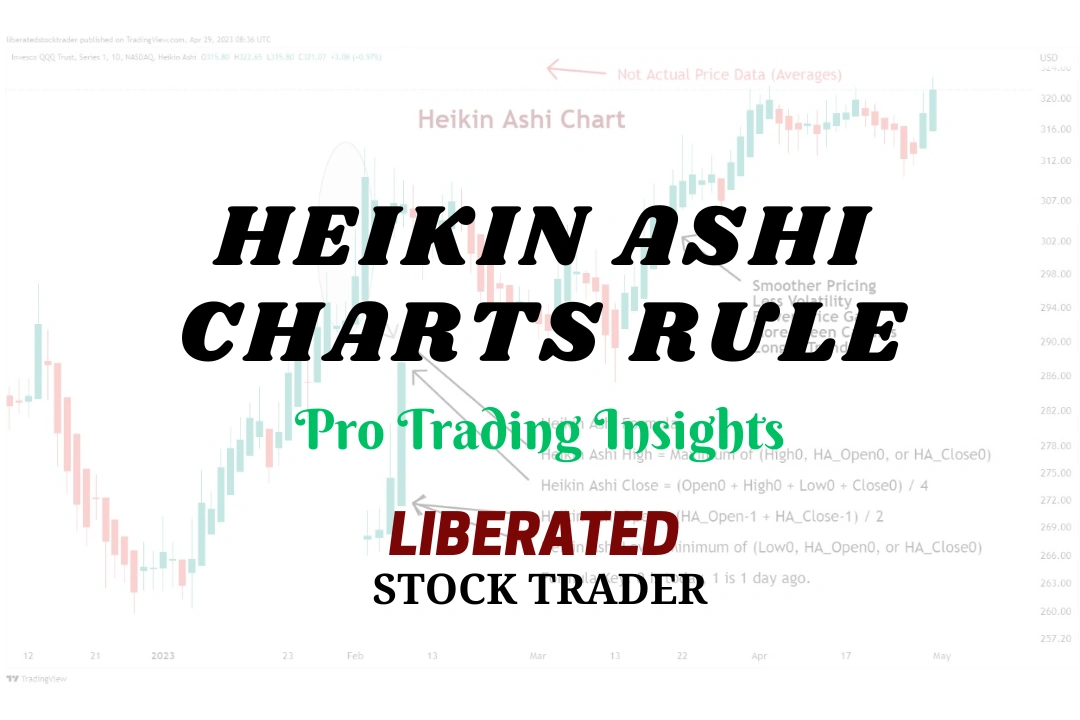
My research indicates that the most effective chart types for traders are Heikin-Ashi, Candlestick, OHLC, Raindrop, and Renko charts. These charts provide the optimal balance of price and trend reversal information to help investors develop effective trading strategies.| Liberated Stock Trader
Most AI trading tools do not use real AI machine learning and large language models. The majority of self-proclaimed AI trading tools are algorithmic and do not actually learn.| Liberated Stock Trader
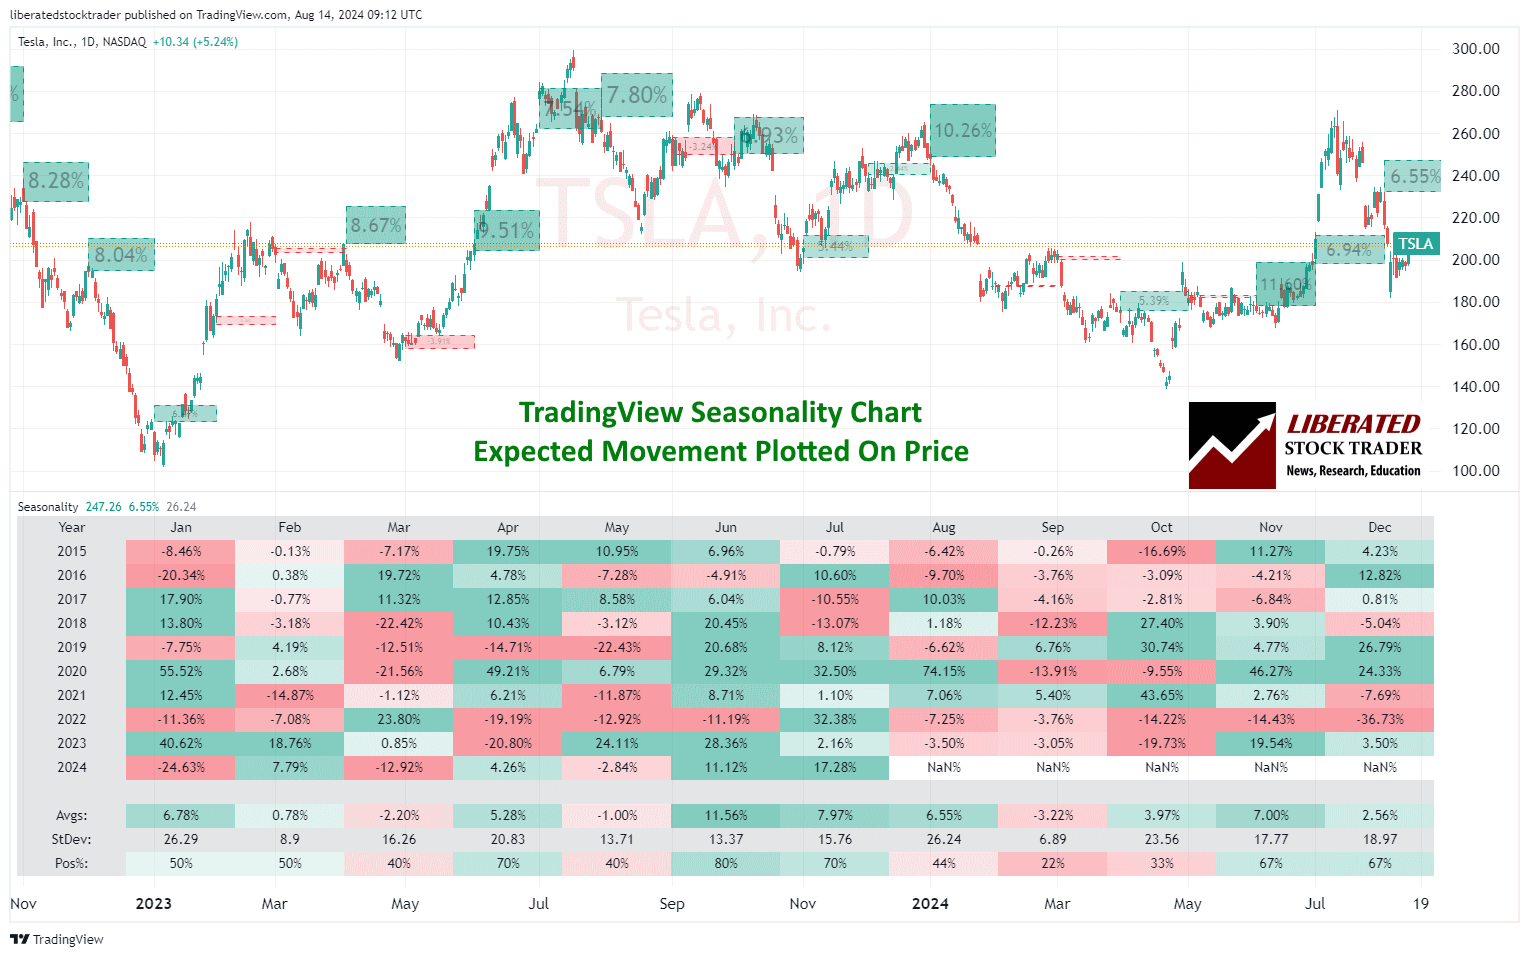
Seasonality charts provide predictable patterns that stocks follow during specific days, weeks, and months of the year. These trends are influenced by recurring events or cycles.| Liberated Stock Trader
I conducted 4,052 backtested trades using 307 years of exchange data to determine if the Supertrend is super! The Supertrend indicator is not profitable for swing traders using a standard daily candlestick/OHLC chart. It achieved a 43% win rate, with an average win of 7.8%.| Liberated Stock Trader
My test trades yielded a 1.77 reward-to-risk ratio, with an average winning trade of 8.5%. Across a large sample, an ATR-based strategy yielded a small gain per trade, but it lost more often than it won and experienced significant drawdowns.| Liberated Stock Trader
TradingView scores 4.8/5.0 because it does everything well, and Finviz scores 4.3/5.0 because it lacks a community, live trading, and has inferior charts. However, Finviz excels at rapidly visualizing vast stock market data on a single screen.| Liberated Stock Trader
My reliability testing of Bollinger Bands on the S&P 500, using 13,360 years of data, suggests it is an unprofitable indicator for traders. However, Bollinger Bands can be highly profitable, with the optimal settings.| Liberated Stock Trader
Our ultimate guide to technical analysis, with its 14 videos and detailed examples covering charts, trends, indicators, patterns, and tools, will fast-track your knowledge.| Liberated Stock Trader
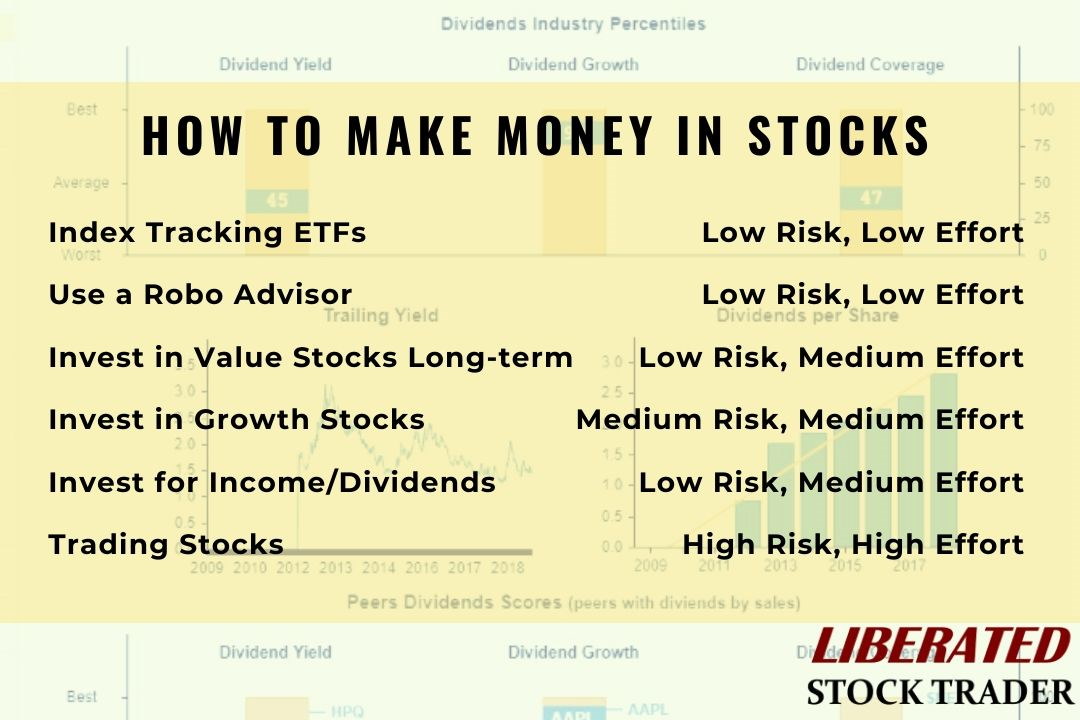
The five time-tested, proven ways to make money in the stock market are investing in long-term ETFs, investing in value stocks, a portfolio of growth stocks, dividends, and stock trading.| Liberated Stock Trader
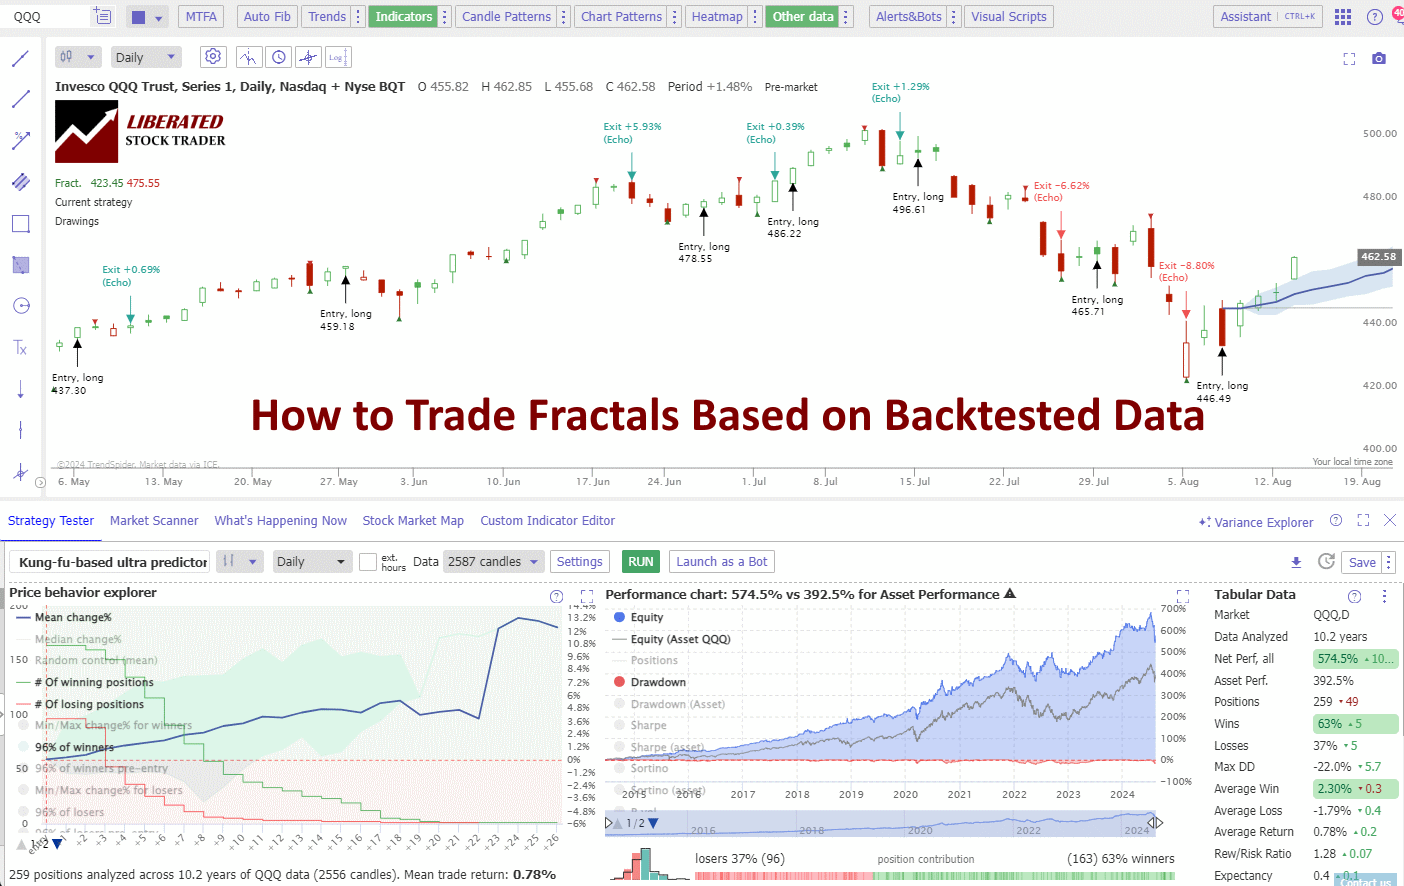
Based on 2,510 tested trades on 80 years of exchange data, I can confirm trading fractal patterns is profitable, with an average reward-to-risk ratio rate of 1.5 across all timescales.| Liberated Stock Trader
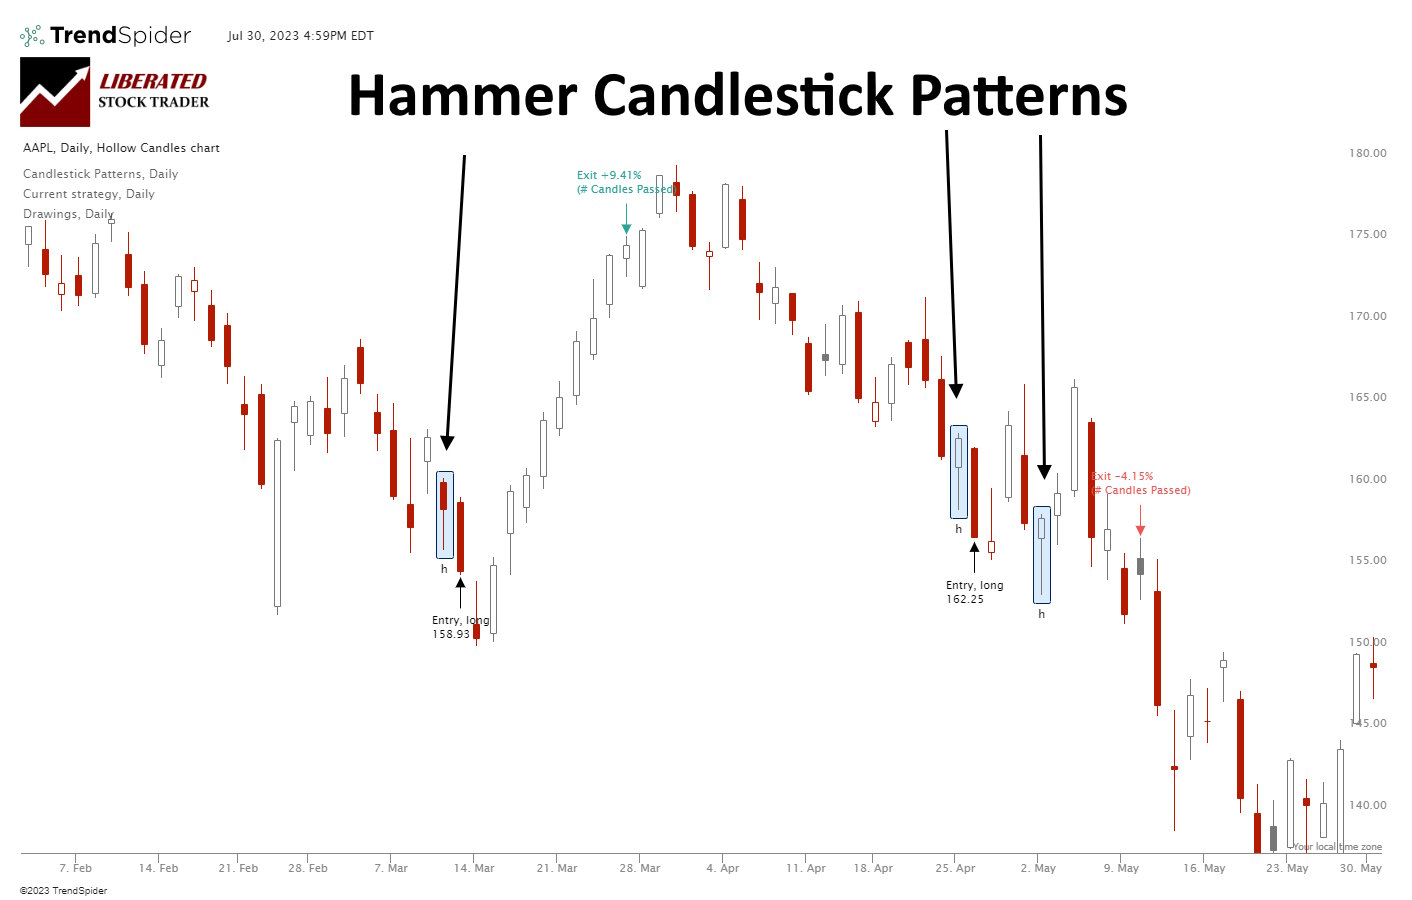
According to 2,219 tested trades, a Hammer is extremely unreliable and unprofitable. It has a low % accuracy rate of 52.1%, resulting in a razor-thin 0.18% profit per trade.| Liberated Stock Trader
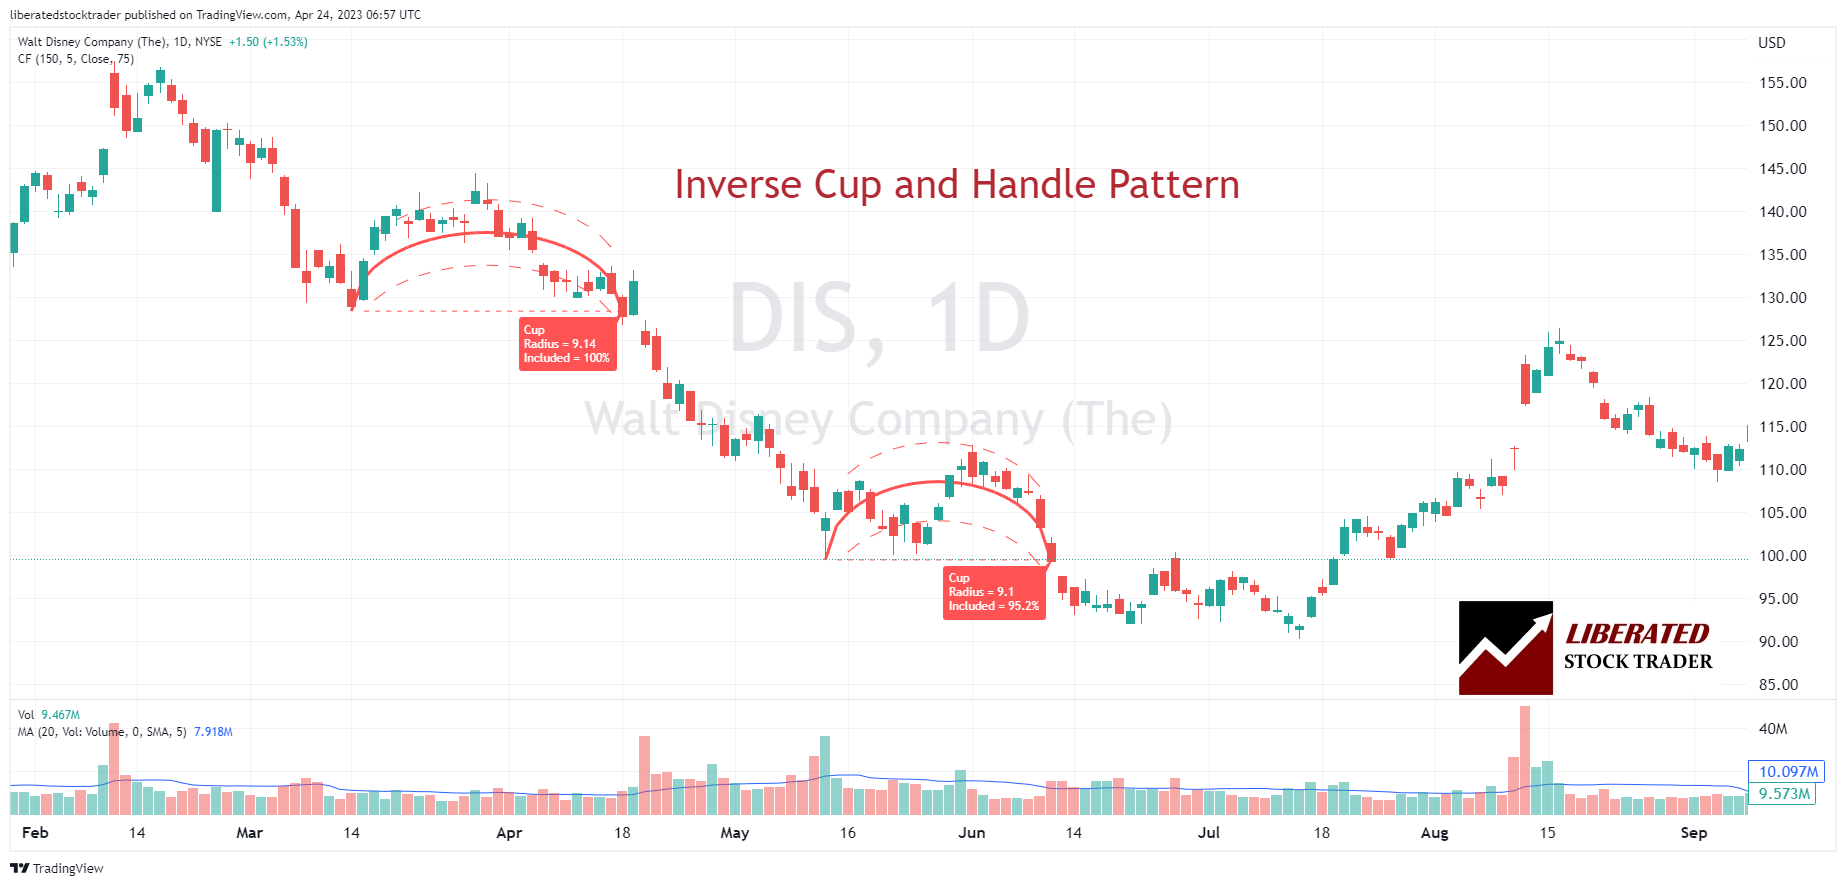
Two decades of trading research indicate that the inverse cup and handle pattern has an 82% success rate and average price drops of 17%. It is an ideal pattern for short-selling.| Liberated Stock Trader
A dead cat bounce is a short-term asset price recovery after a significant volatile decline, followed by a continuation of the downtrend. Look for a short-lived rally that loses momentum quickly, often trapping bullish traders.| Liberated Stock Trader
Ultimately, for 95% of speculators, day trading is not worth it. Although day traders can make significant money quickly, statistics show that most day traders lose money. Over a six-month period excessive commissions, poor trading decisions, weak strategies, and bad market timing cause losses.| Liberated Stock Trader
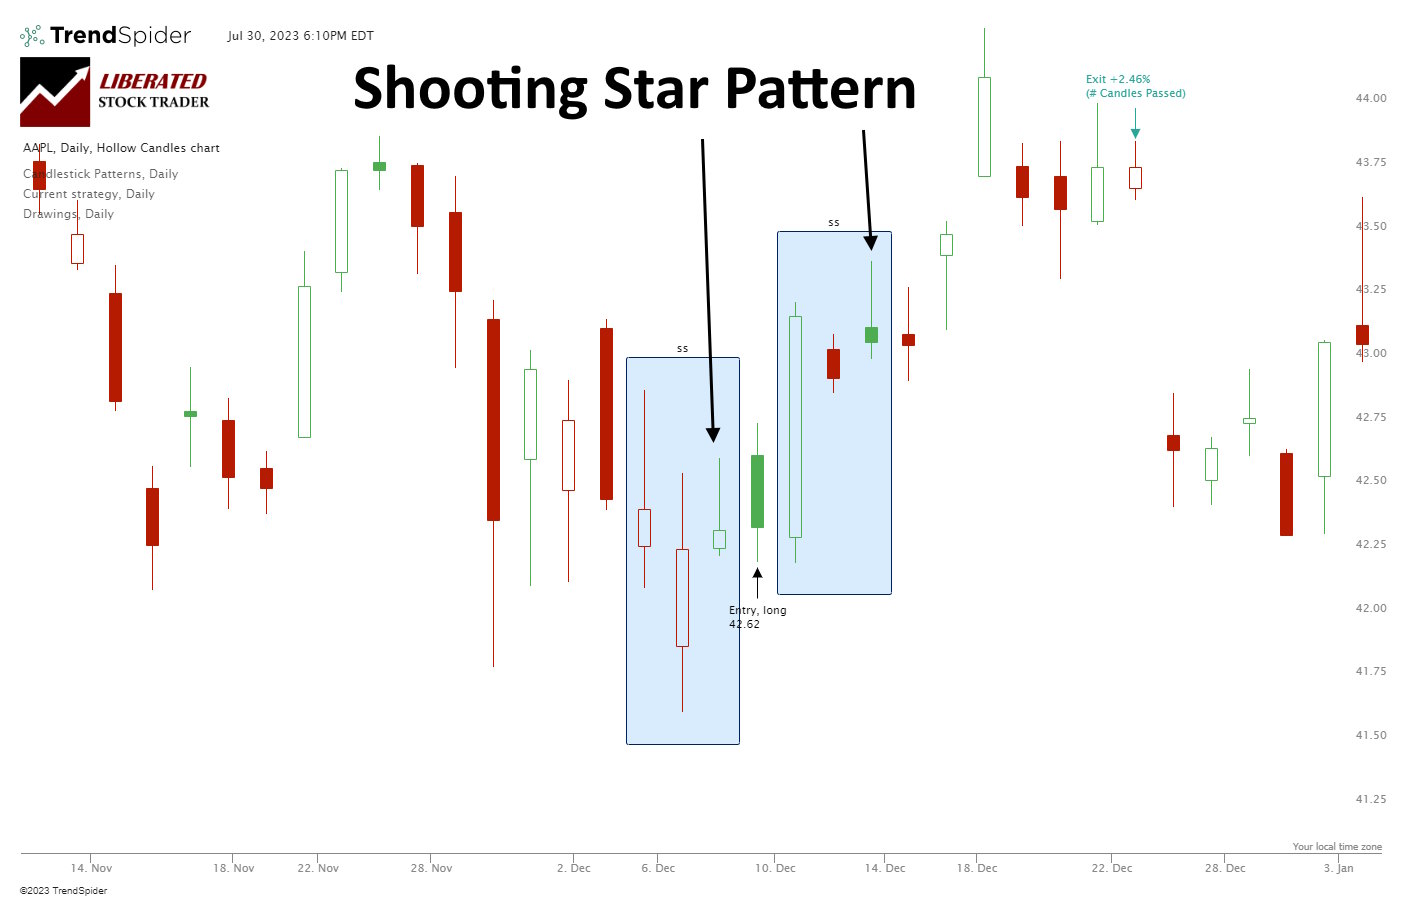
Based on our 568 years of backtested data, the Shooting Star candle is profitable. It has a 57.1% upside success rate and an average winning trade of 3.6%. Each trade made using a shooting star nets an average of 0.56% profit.| Liberated Stock Trader
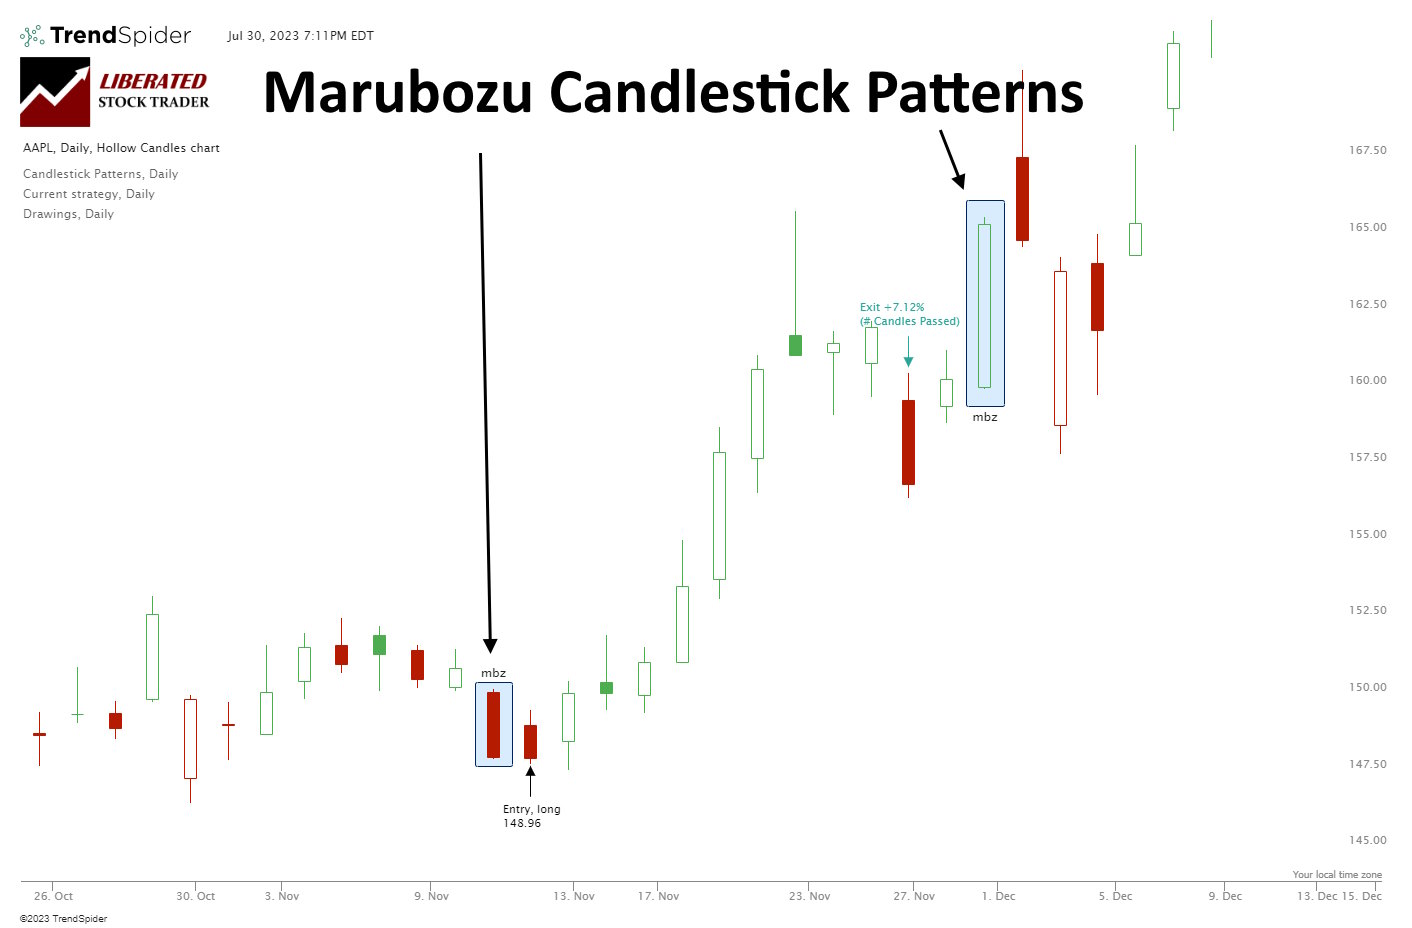
Our research shows Bearish Marubozu candles are among the most profitable patterns. Based on 568 years of data, it has a 56.1% success rate and an average win of 4.1%. Conversely, the Bullish Marubozu is one of the worst.| Liberated Stock Trader
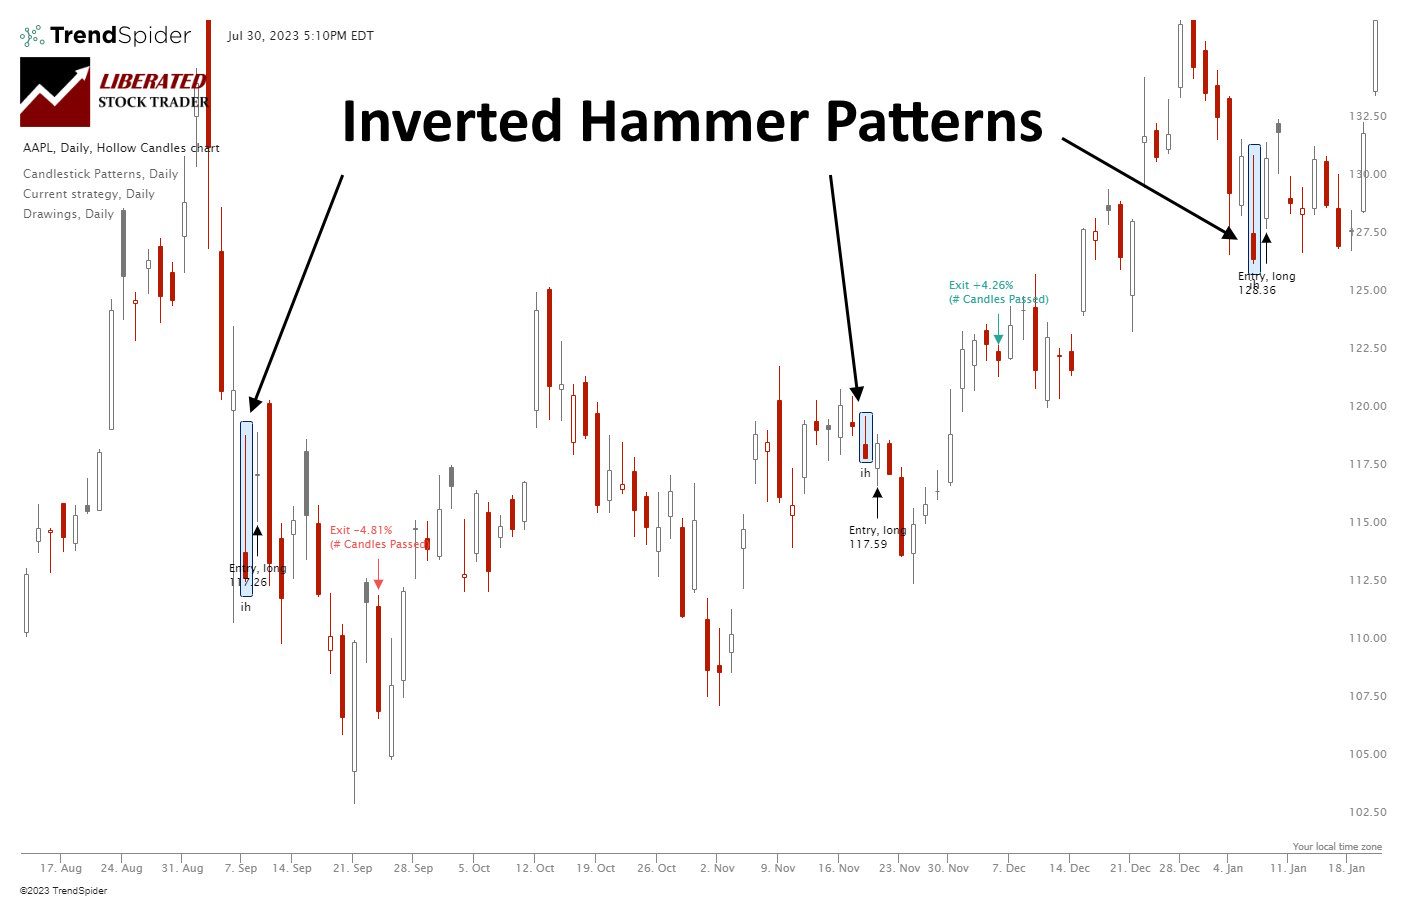
Our research shows the Inverted Hammer is the most accurate and profitable candlestick pattern. Used as a bullish signal, it has a 60% success rate and an average win of 4.2%, based on 588 years of data.| Liberated Stock Trader
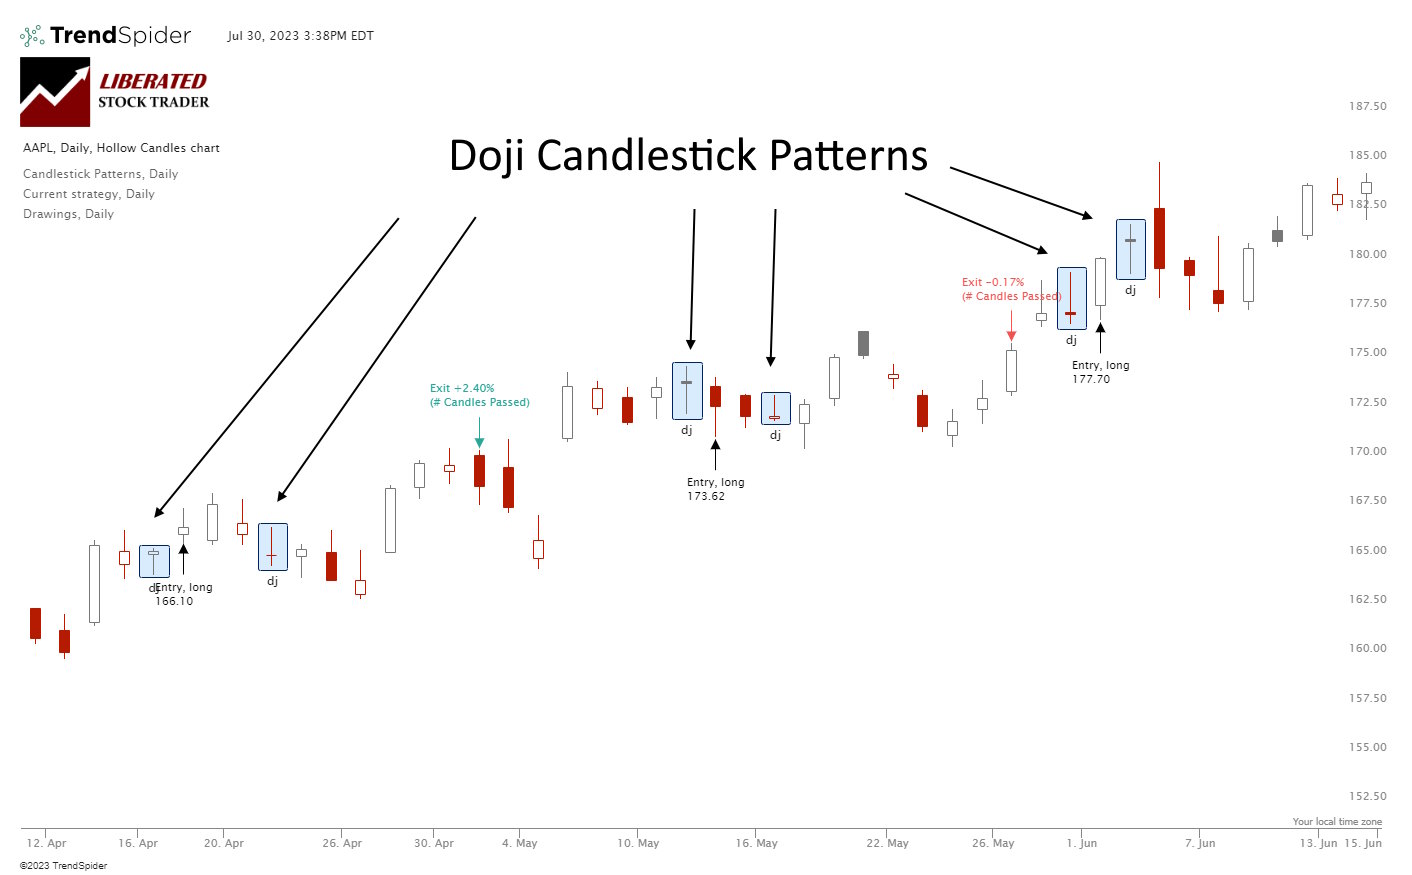
A Doji candlestick chart pattern indicates a battle between buyers and sellers, ending in equilibrium. The Doji marks a potential trend reversal. Is the Doji pattern profitable or accurate? Our evidence suggests its profitability is marginal.| Liberated Stock Trader
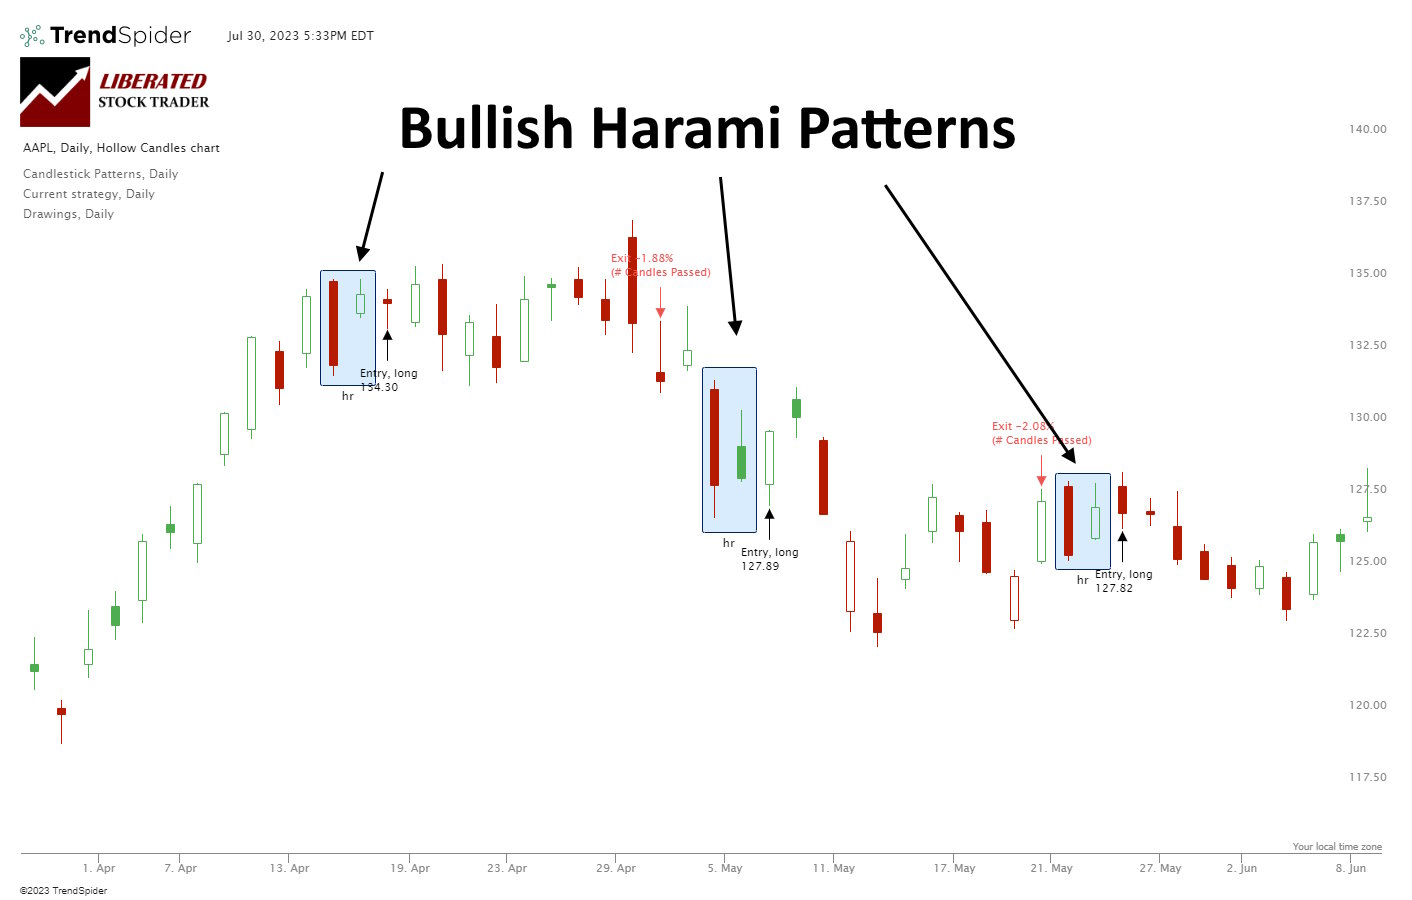
Our research shows Bullish Harami and Bullish Harami Cross are profitable patterns. Based on 1,112 years of data, the bullish Harami has an average profit per trade of 0.5% and the Harami Cross 0.58%.| Liberated Stock Trader
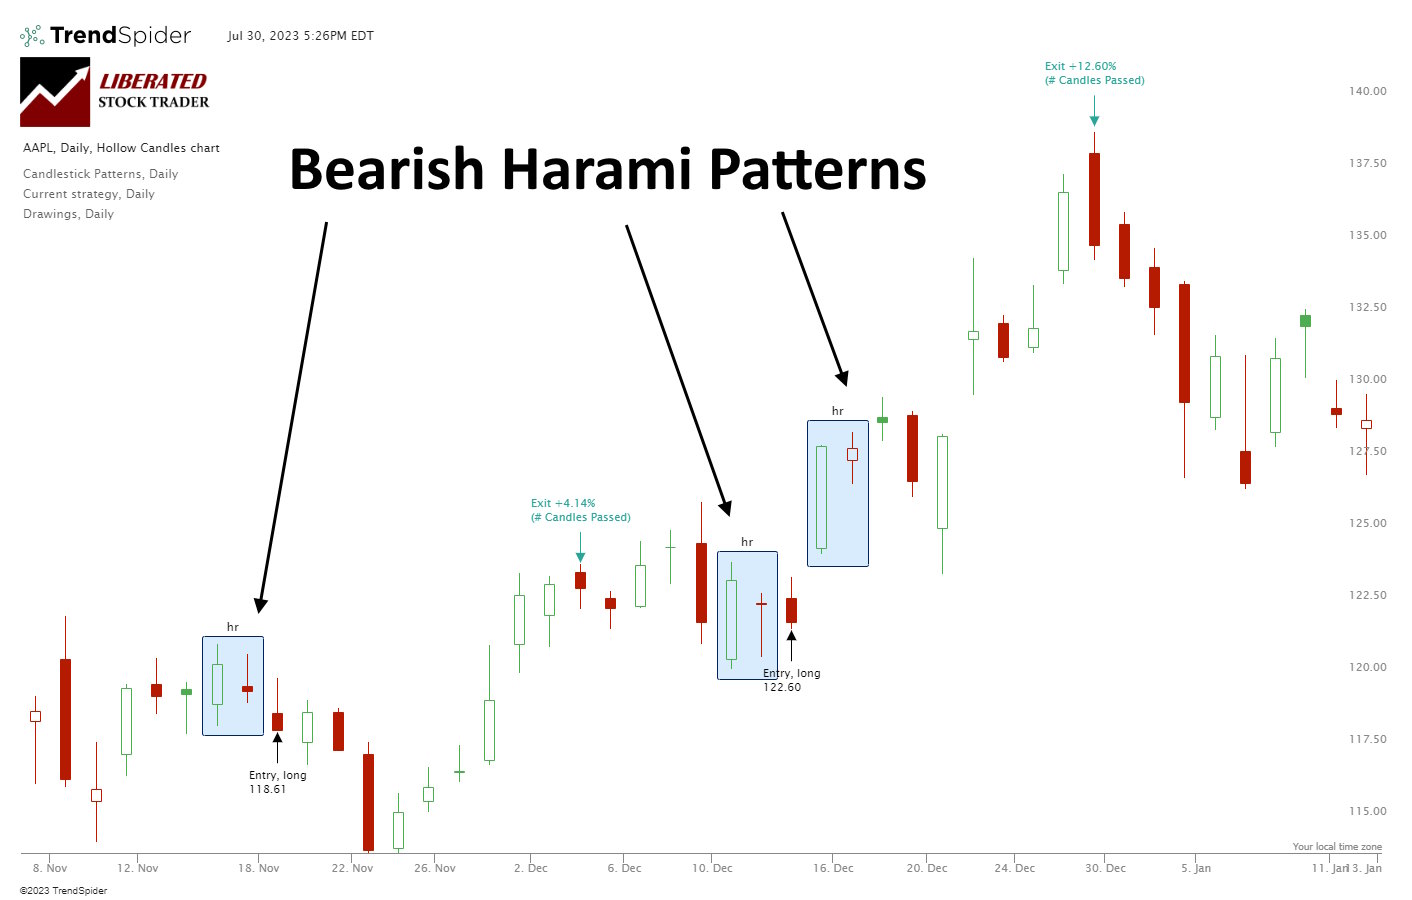
Our research shows Bearish Harami and Bearish Harami Cross are profitable patterns. Based on 1,136 years of data, the Bullish Harami has an average profit per trade of 0.48% and the Harami Cross 0.57%.| Liberated Stock Trader
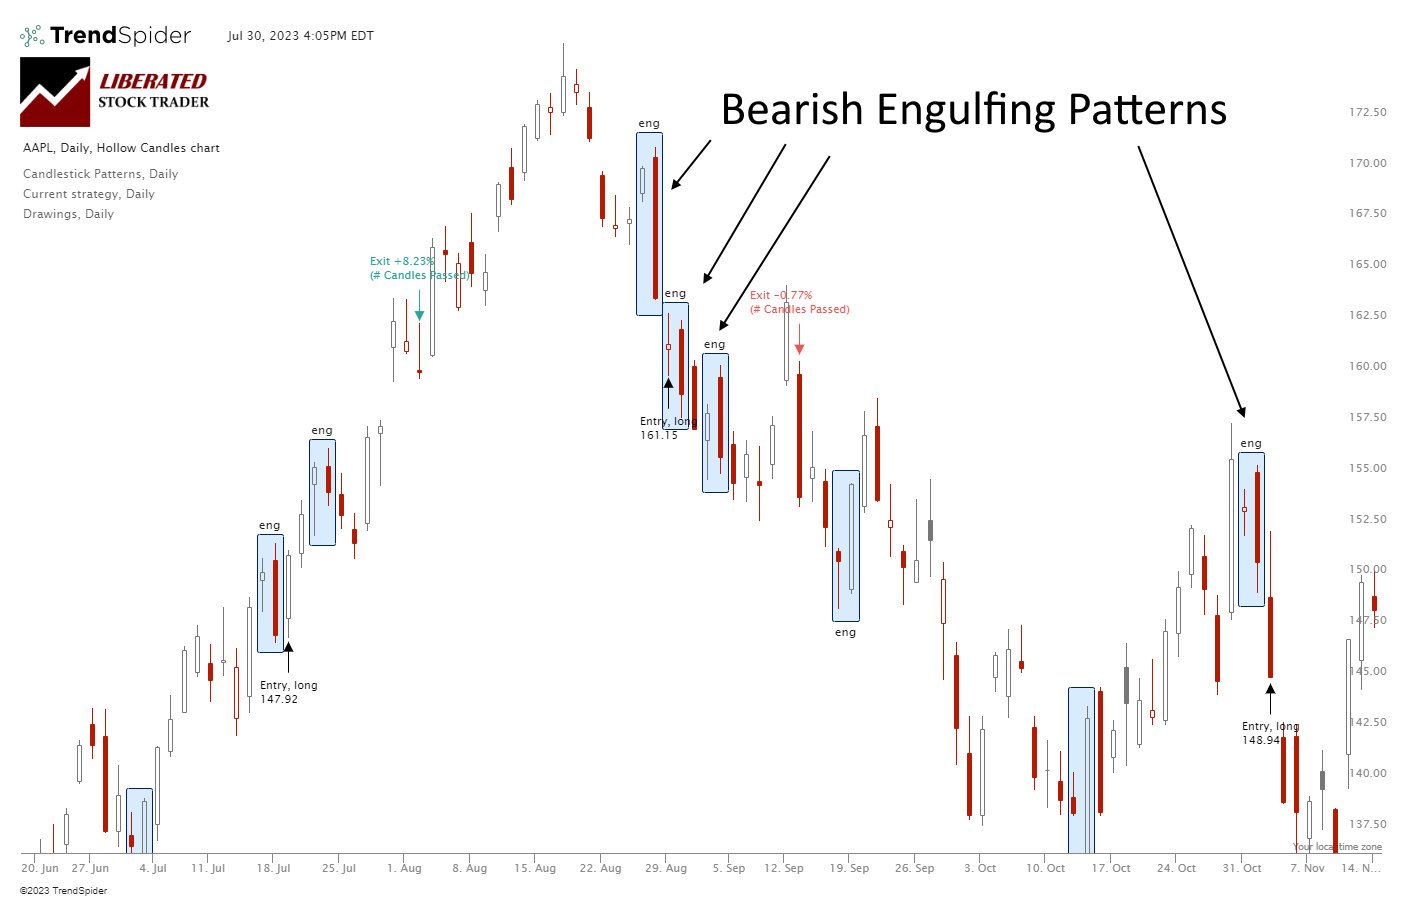
My research shows the Bearish Engulfing candle is an accurate and profitable pattern. Using 568 years of data, my testing revealed a 57% success rate and an average win of 3.7%.| Liberated Stock Trader
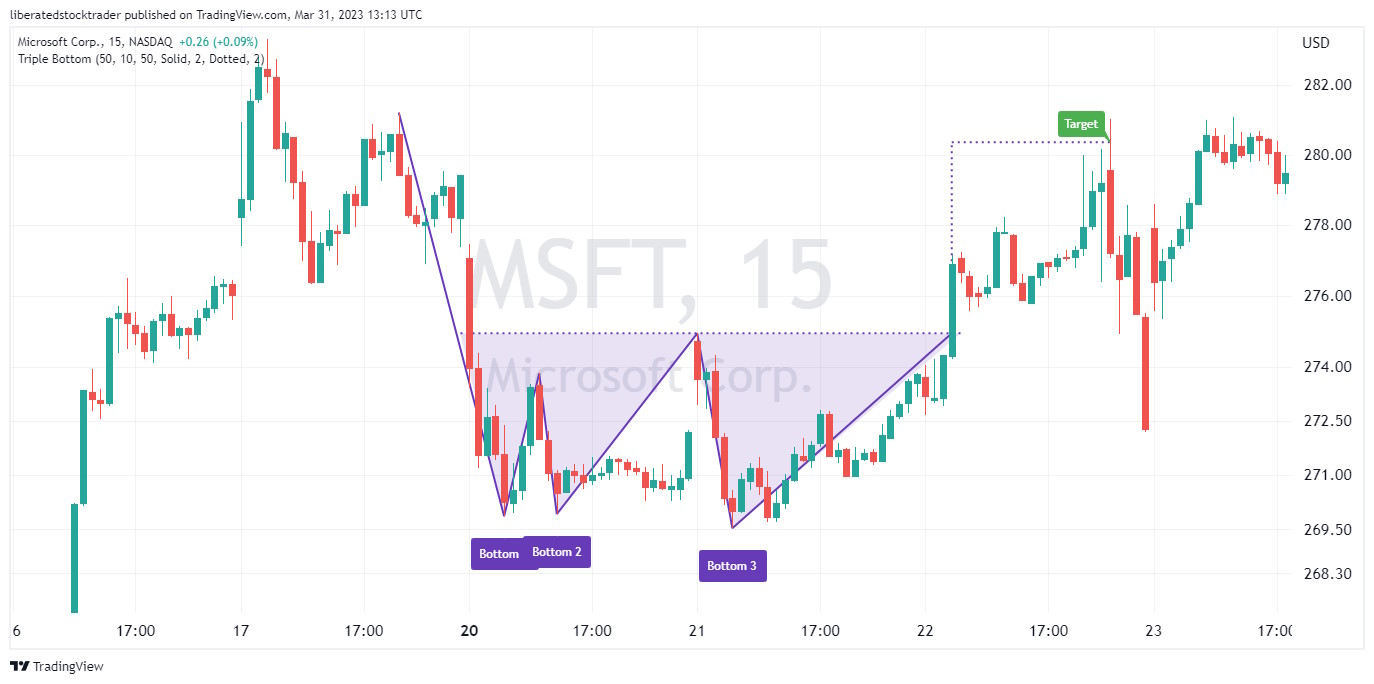
Decades of trading research show the triple-bottom pattern has an 87% success rate in bull markets and an average profit potential of +45%. The triple bottom chart pattern is popular because it is reliable and accurate and generates a good average profit for traders.| Liberated Stock Trader
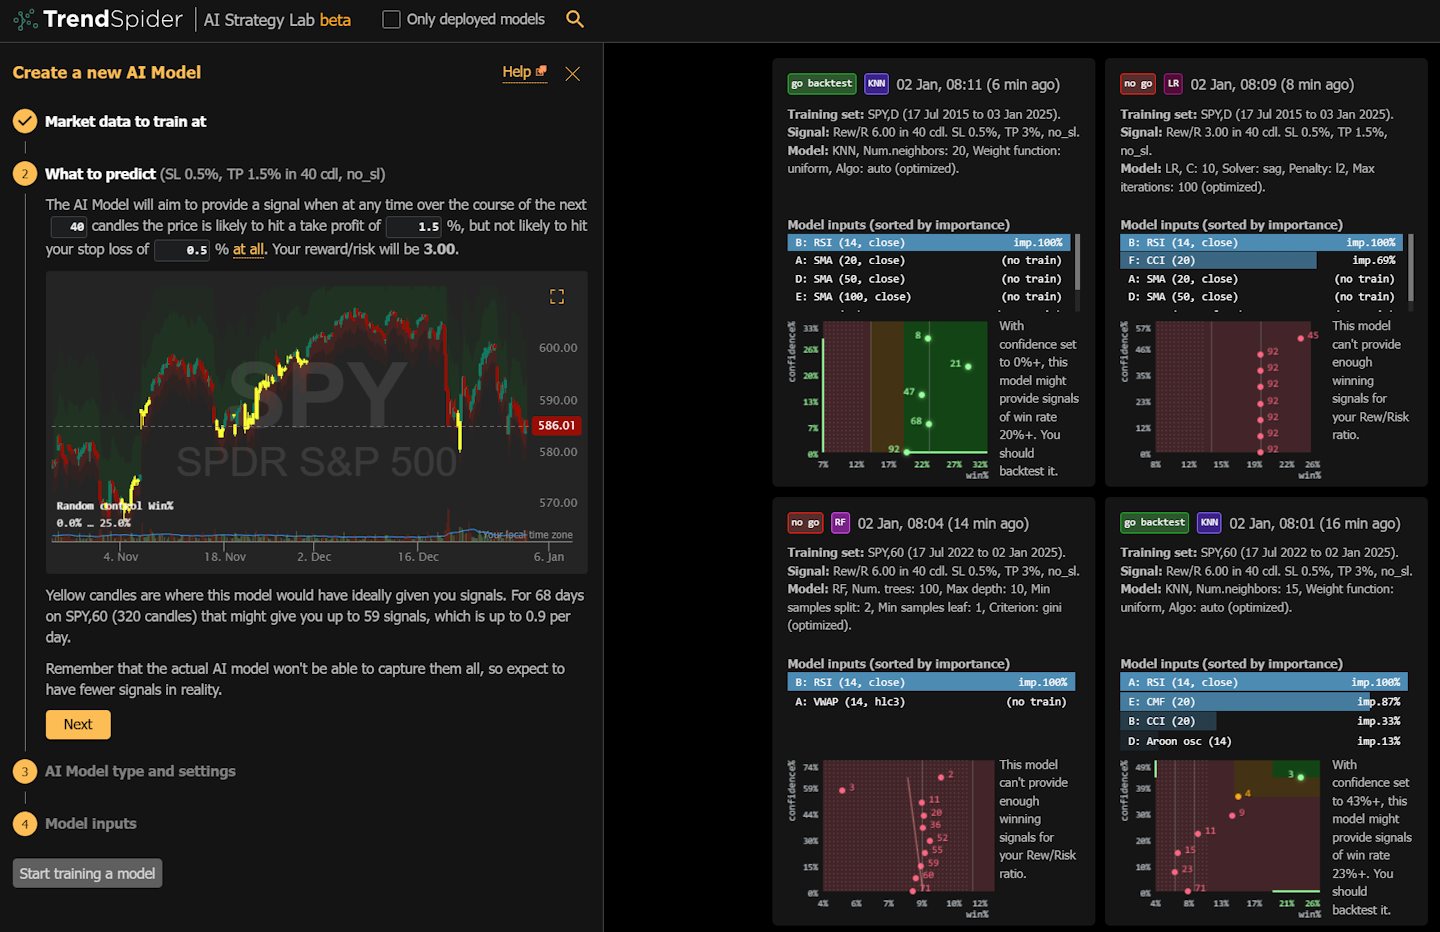
While platforms like TradingView and Trade Ideas offer many algorithms, only TrendSpider lets you fully train your own models. It’s a game-changer for traders looking to create unique strategies!| Liberated Stock Trader
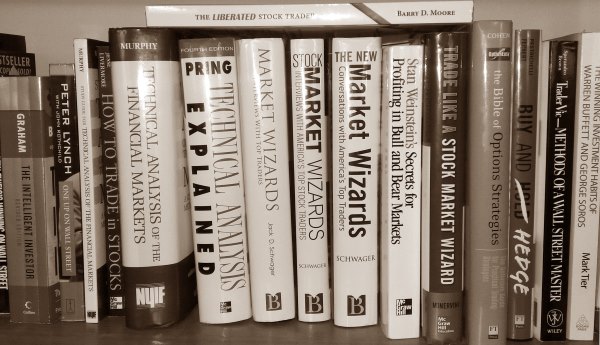
I believe the best ways to learn stock trading include books, audiobooks, data-backed analytical research, and reputable investing courses taught by industry-certified instructors.| Liberated Stock Trader
Learn stock market investing with the complete online stock trading course by Barry D. Moore, a certified financial analyst from the International Federation of Technical Analysts (IFTA).| Liberated Stock Trader
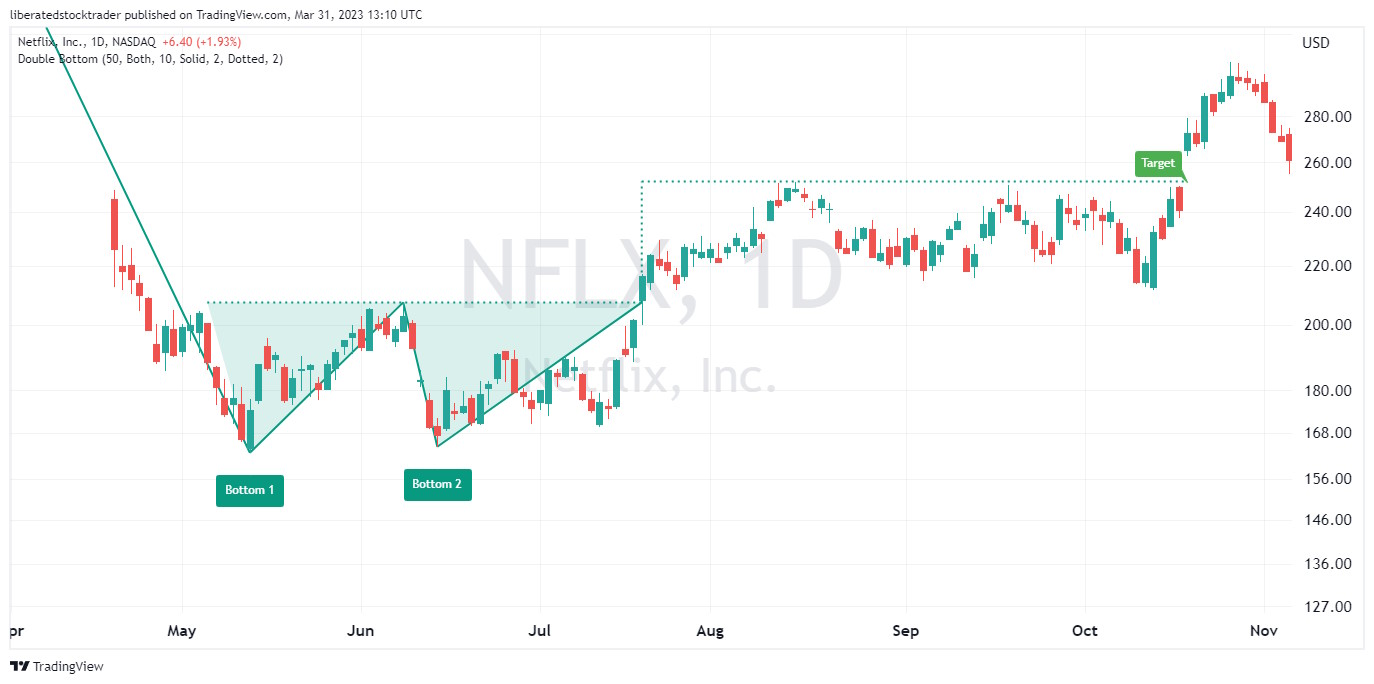
Decades of research reveal the double bottom pattern has an 88% success rate in bull markets and an average profit potential of +50%. The double-bottom chart pattern is one of the most reliable and accurate chart indicators in technical analysis.| Liberated Stock Trader
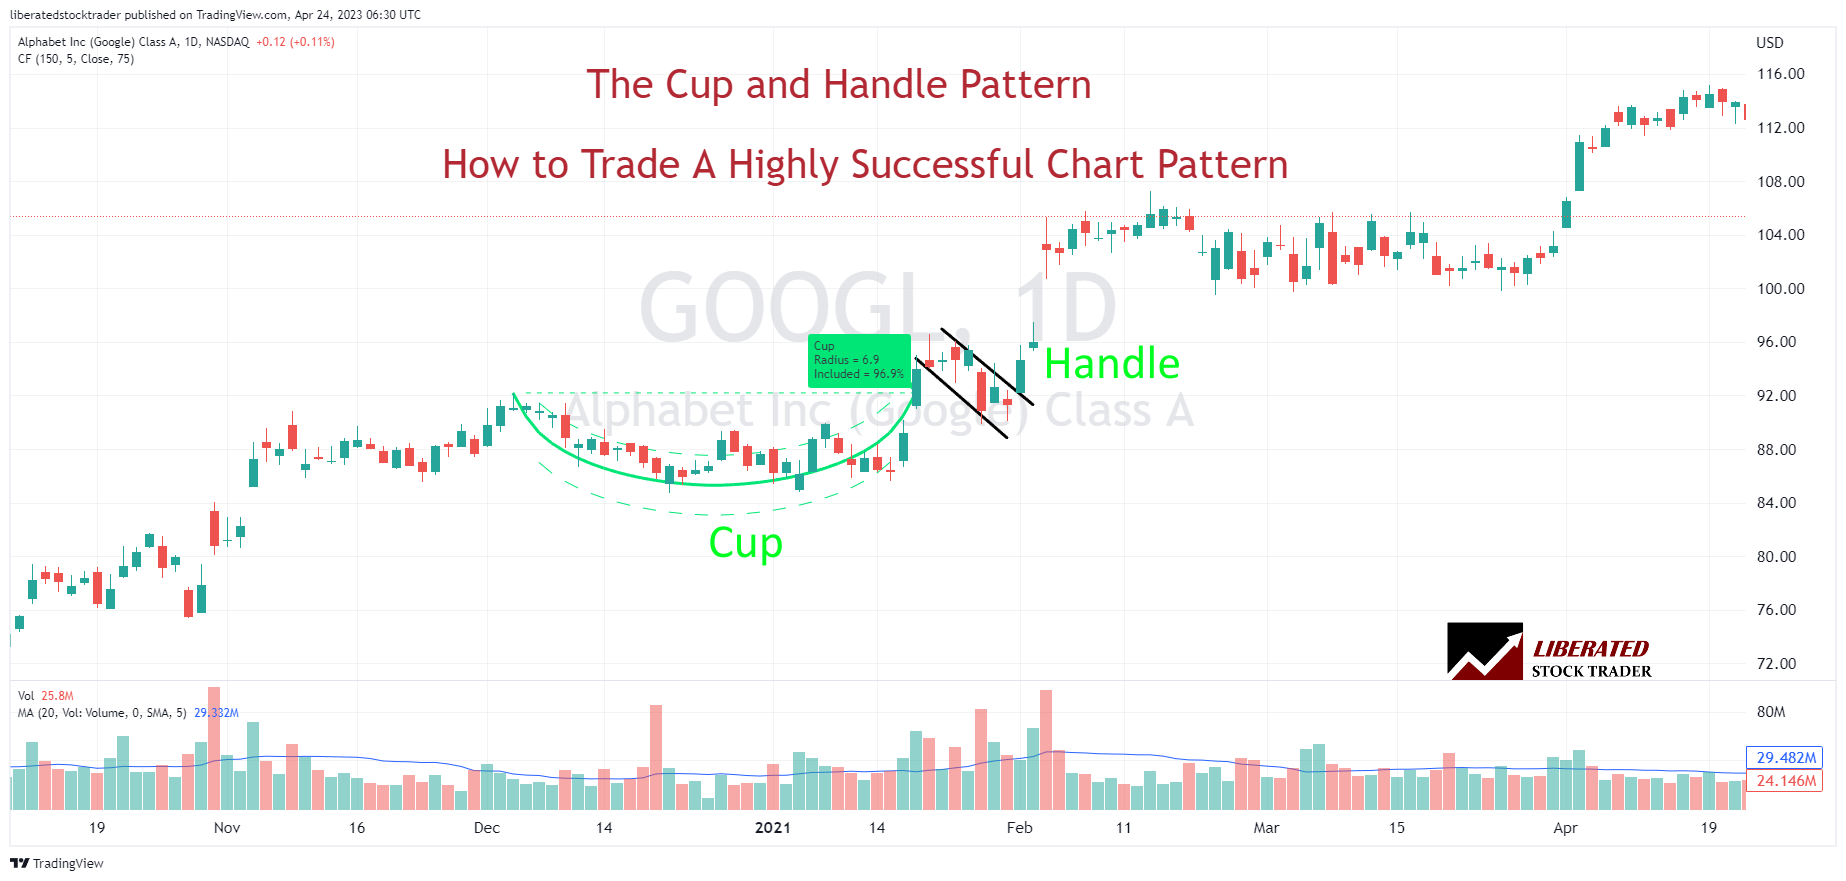
My research shows the most reliable and accurate bullish patterns are the cup-and-handle, with a 95% bullish success rate, head-and-shoulders (89%), double-bottom (88%), and triple-bottom (87%).| Liberated Stock Trader
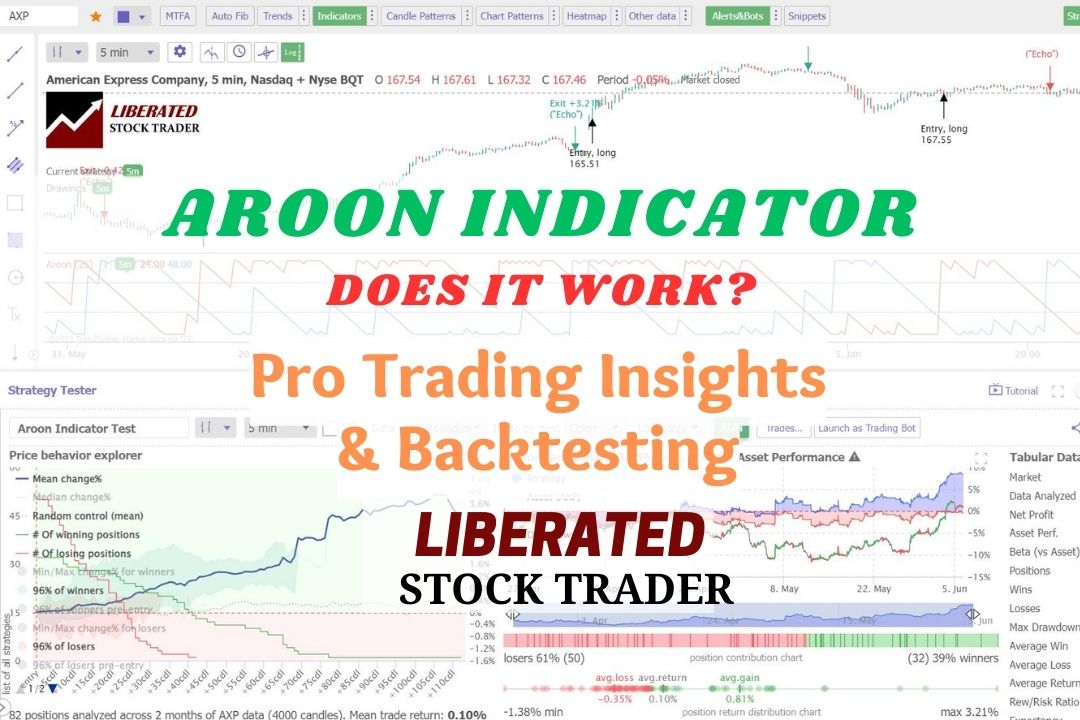
In technical analysis, the Aroon indicator identifies trend reversals and trend strength. This oscillating indicator has two parts: the "Aroon Up" line measures uptrend strength, and the "Aroon Down" line for downtrend strength.| Liberated Stock Trader
I backtested 360 years of data on the 30 most important US stocks, and our findings prove that Heikin-Ashi chart strategies outperform 66% of equities vs. a buy-and-hold strategy.| Liberated Stock Trader
There are two types of continuation patterns: bullish and bearish. Bullish continuation patterns occur when the market is trending upwards, while bearish continuation patterns happen when the market is trending downwards.| Liberated Stock Trader
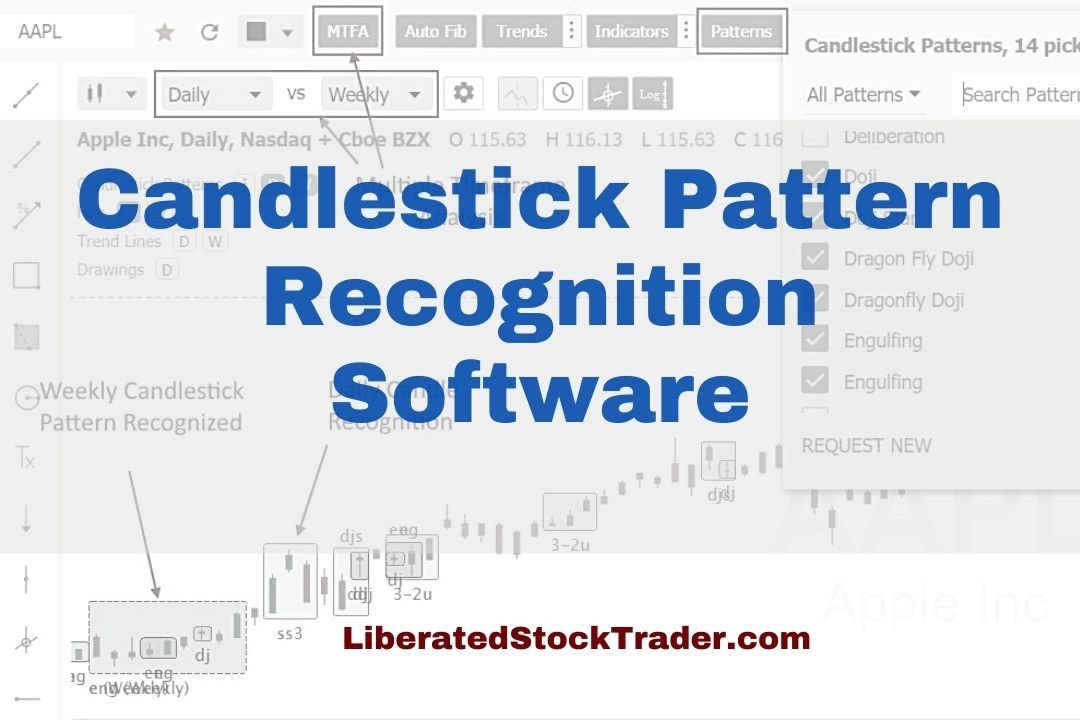
You can read candlestick charts using pattern recognition software to identify five reliable patterns, the Inverted Hammer, Bearish Marubozu, Gravestone Doji, Bearish Engulfing, and Bullish Harami Cross.| Liberated Stock Trader
Day and swing trading uses technical chart analysis to trade short-term price moves, whereas growth and value investing use long-term fundamental financial analysis. The tools and strategies used for these types of trading are completely different.| Liberated Stock Trader
To create an algo trading system, you must choose a strategy, select a trading platform, choose the asset type, select the indicators and patterns, backtest, and refine the strategy.| Liberated Stock Trader
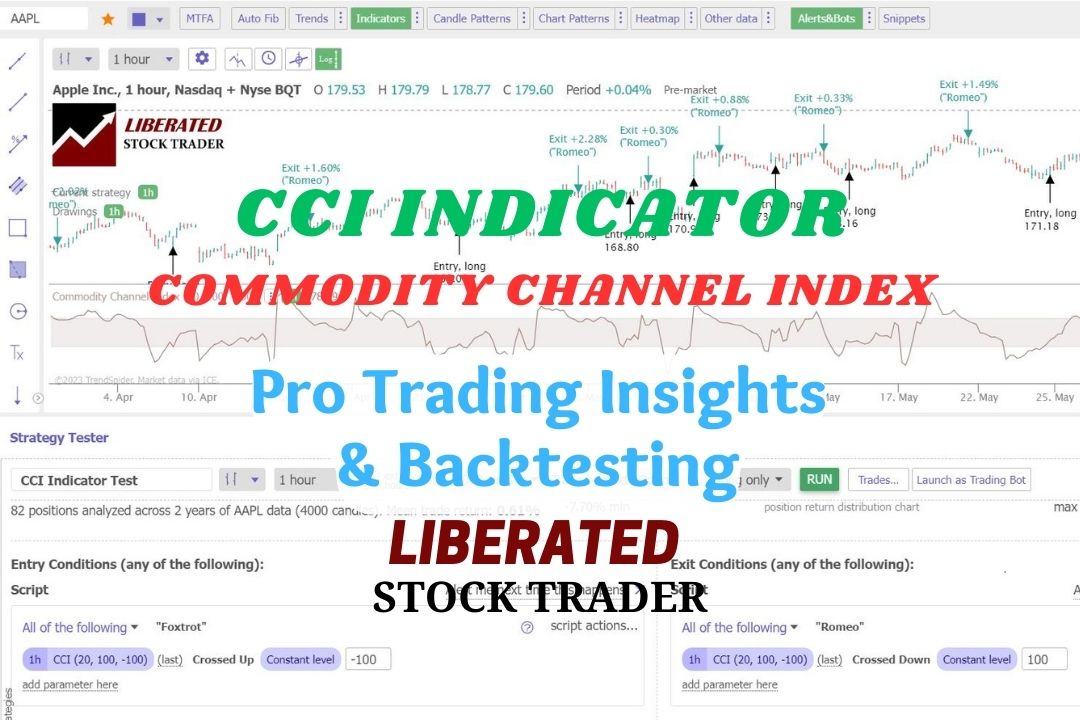
Based on 43,297 test trades, my research indicates that the CCI is a highly profitable momentum indicator, yielding a win rate of up to 85% when used with the correct settings.| Liberated Stock Trader
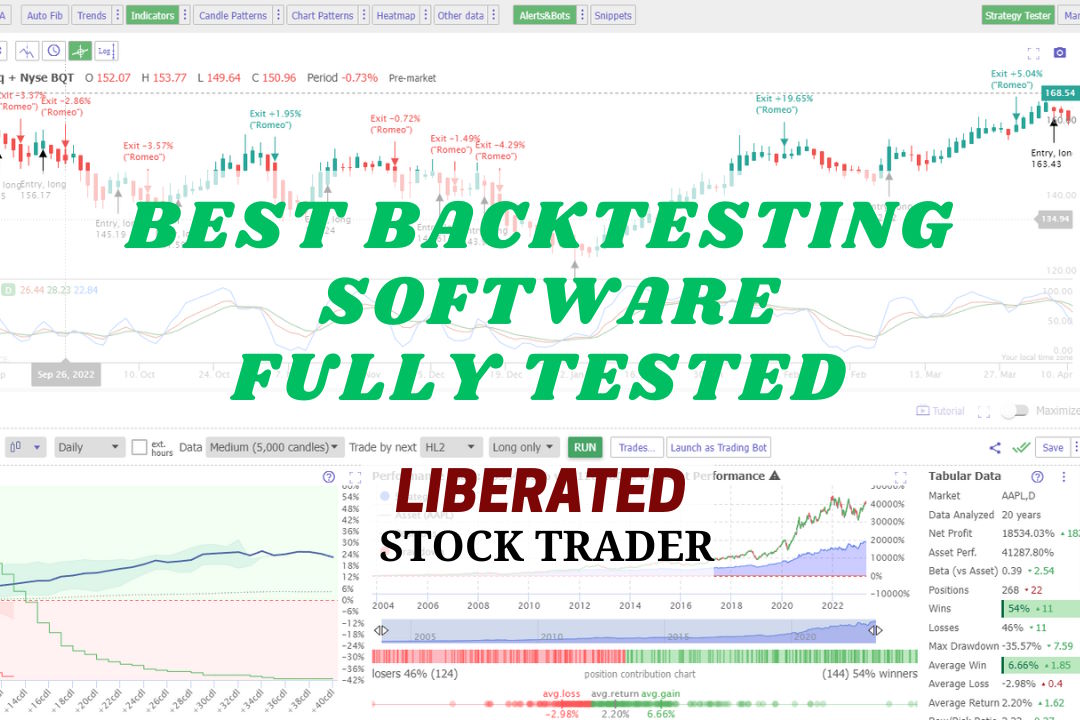
My research shows the best stock backtesting and auto-trade software are TrendSpider, Trade Ideas, and Tradingview. My testing process selected TrendSpider as the overall winner because it offers the most flexible, code-free, multilayer backtesting.| Liberated Stock Trader
The best technical analysis books leading industry bodies recommend are Technical Analysis of the Financial Markets, Technical Analysis Explained, Cloud Charts, and Forecasting Financial Markets.| Liberated Stock Trader
Testing reveals the best stock chart candlestick pattern recognition software is TrendSpider, TradingView, MetaStock, and Finviz.| Liberated Stock Trader
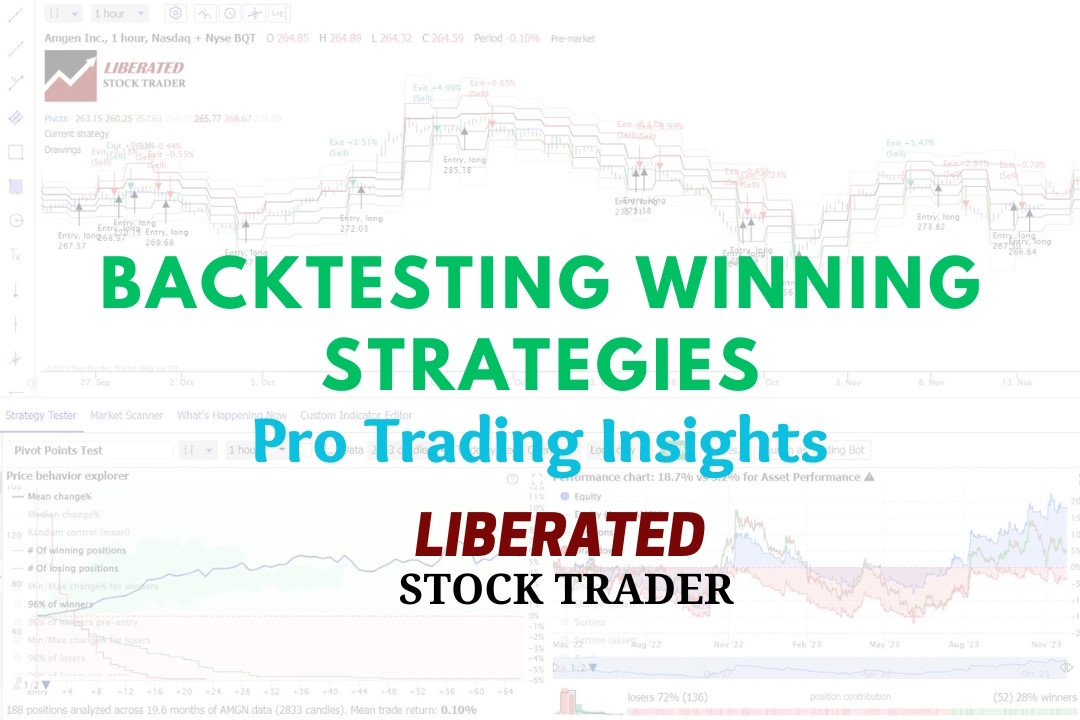
Experienced investors backtest their trading strategies to optimize their portfolios. Backtesting is a critical step that enables traders to assess the potential viability of a trading strategy by applying it to historical data.| Liberated Stock Trader
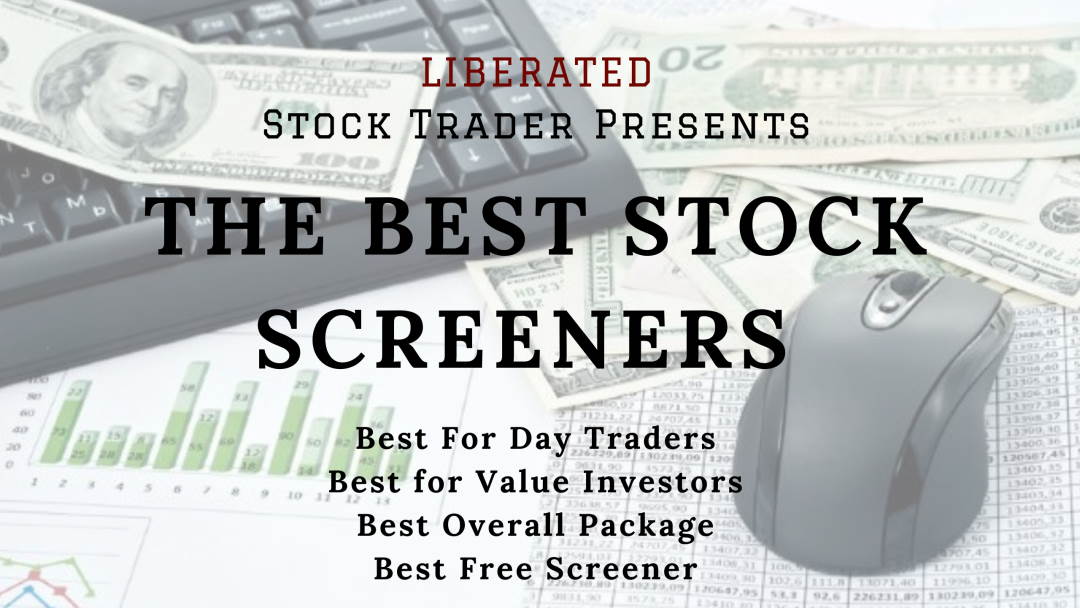
My rigorous testing shows the best free stock screeners are Stock Rover, TradingView, and Finviz. For premium screening, TrendSpider, Stock Rover, and Trade Ideas lead the pack.| Liberated Stock Trader
Twenty years of trading research show that the cup and handle pattern has a 95% success rate in bull markets and returns an average profit of +54%.| Liberated Stock Trader