Swing Trading and Day Trading differ in the timeframe, strategy, tools, and leverage. Day traders trade intraday using leverage; swing traders hold positions for days or weeks. Swing traders use real-time news, patterns, and indicators to make decisions, whereas day traders typically look for volatility to enable price scalping.| Liberated Stock Trader
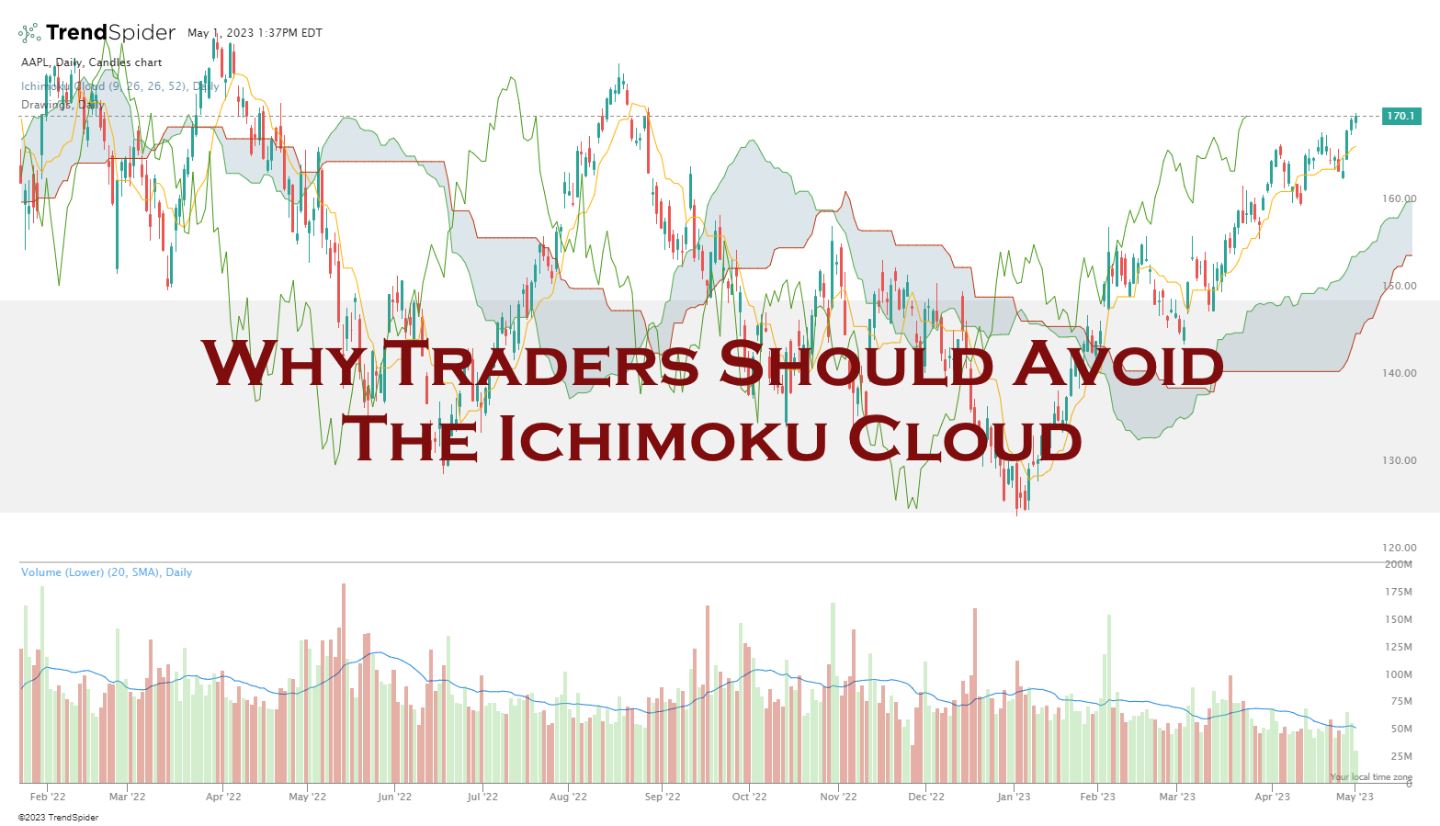
The Ichimoku test results are a dismal 10% win rate, underperforming a buy-and-hold strategy 90% of the time. The Ichimoku indicator is a poor choice for traders.| Liberated Stock Trader
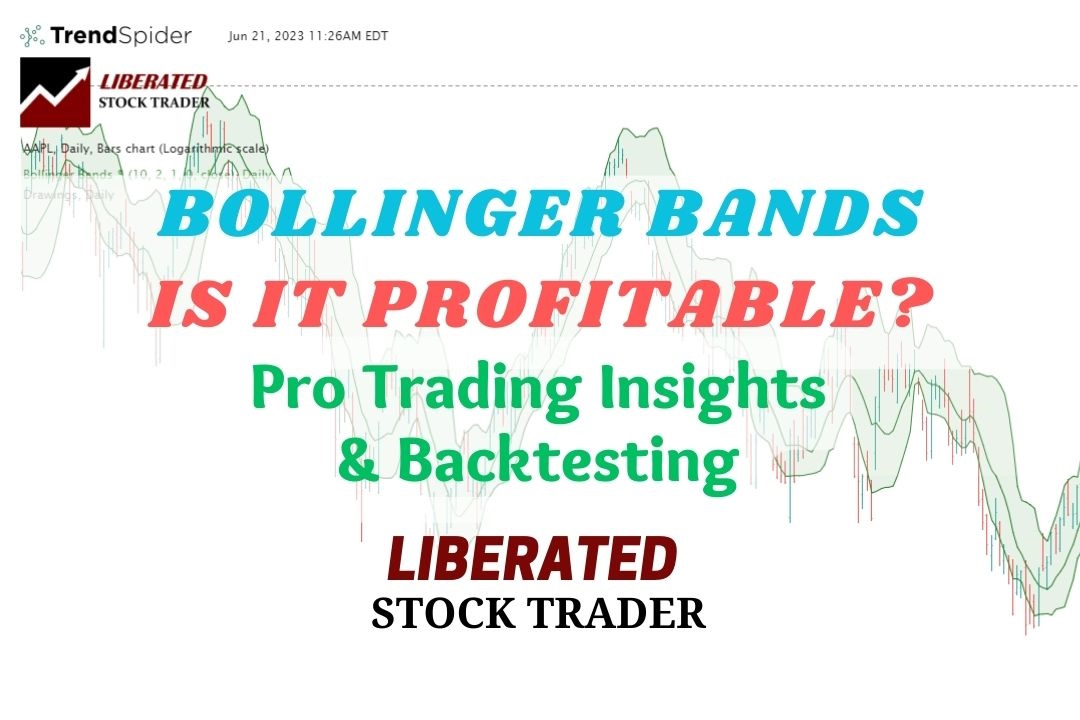
My reliability testing of Bollinger Bands on the S&P 500, using 13,360 years of data, suggests it is an unprofitable indicator for traders. However, Bollinger Bands can be highly profitable, with the optimal settings.| Liberated Stock Trader
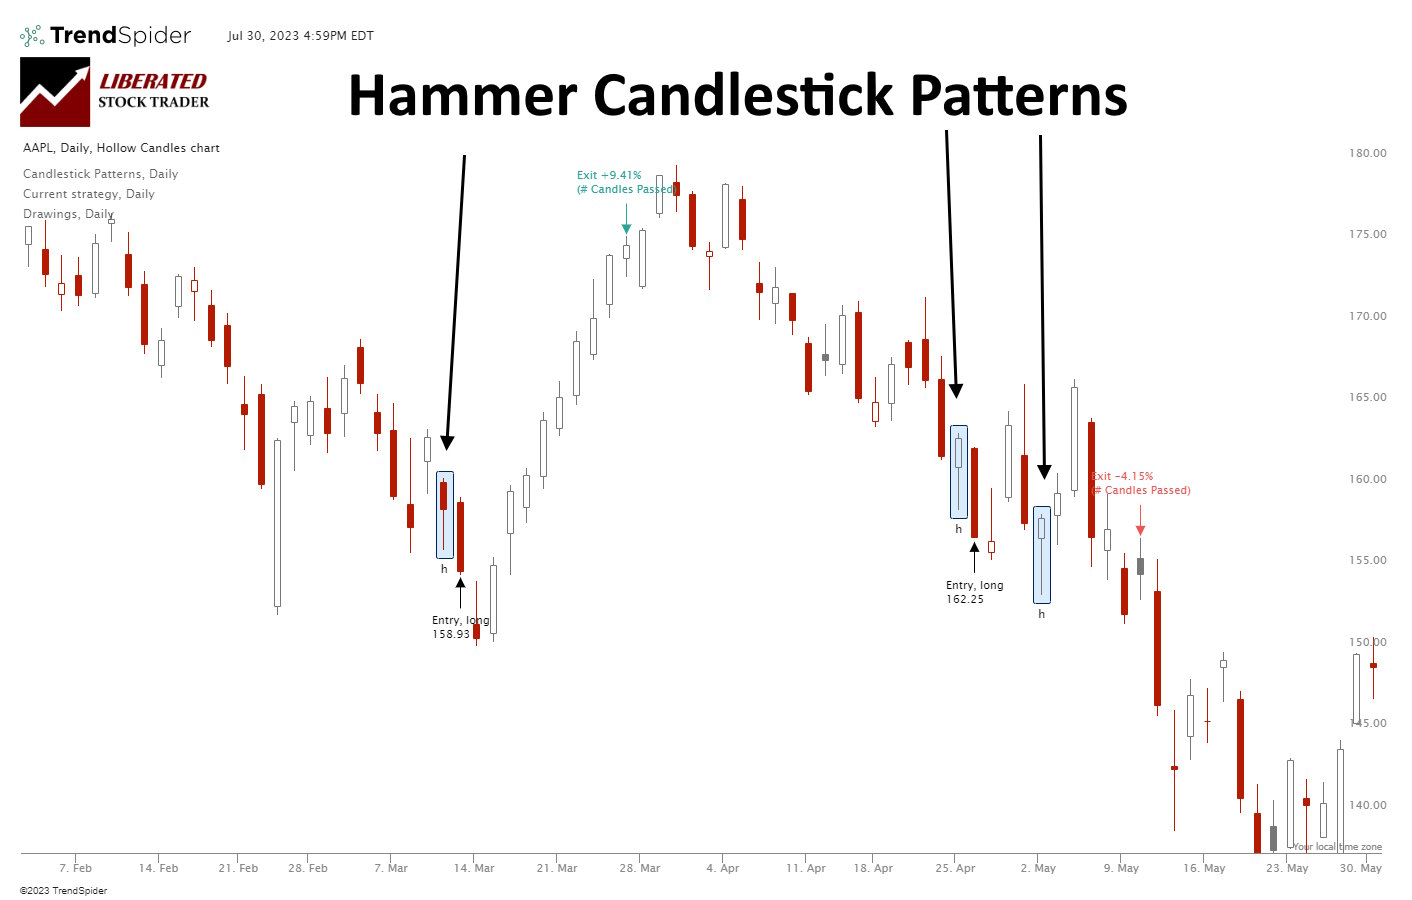
According to 2,219 tested trades, a Hammer is extremely unreliable and unprofitable. It has a low % accuracy rate of 52.1%, resulting in a razor-thin 0.18% profit per trade.| Liberated Stock Trader
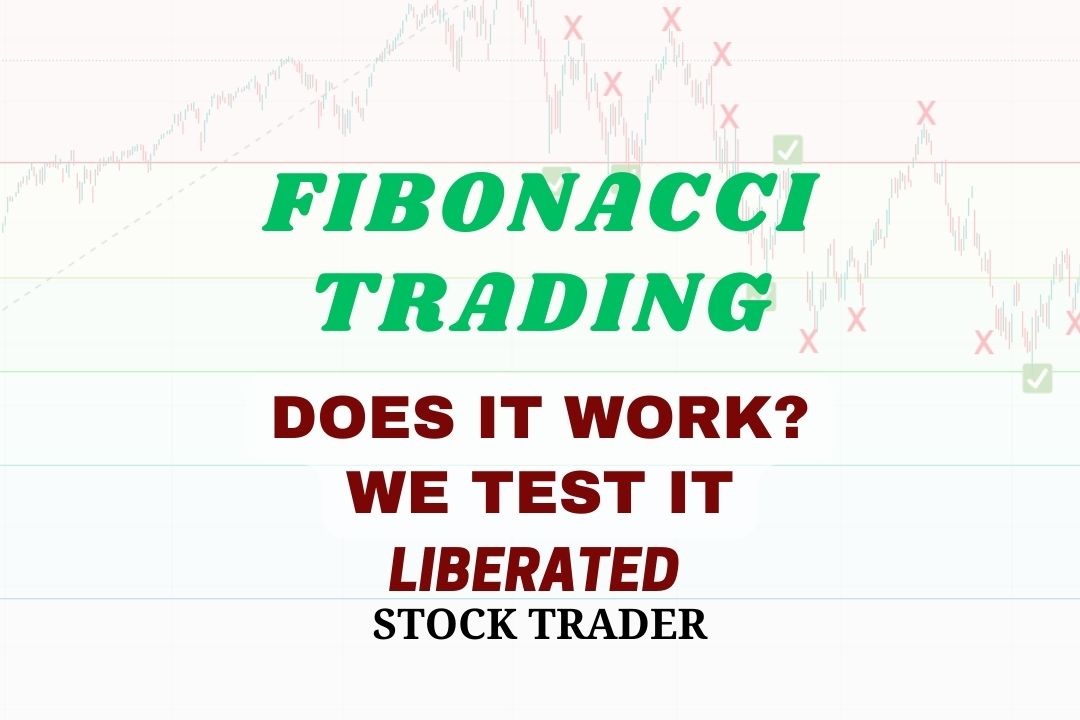
In technical analysis, Fibonacci retracement is used by traders to predict levels of support and resistance by drawing horizontal lines according to the Fibonacci sequence. But Does It Work?| Liberated Stock Trader
Ultimately, for 95% of speculators, day trading is not worth it. Although day traders can make significant money quickly, statistics show that most day traders lose money. Over a six-month period excessive commissions, poor trading decisions, weak strategies, and bad market timing cause losses.| Liberated Stock Trader
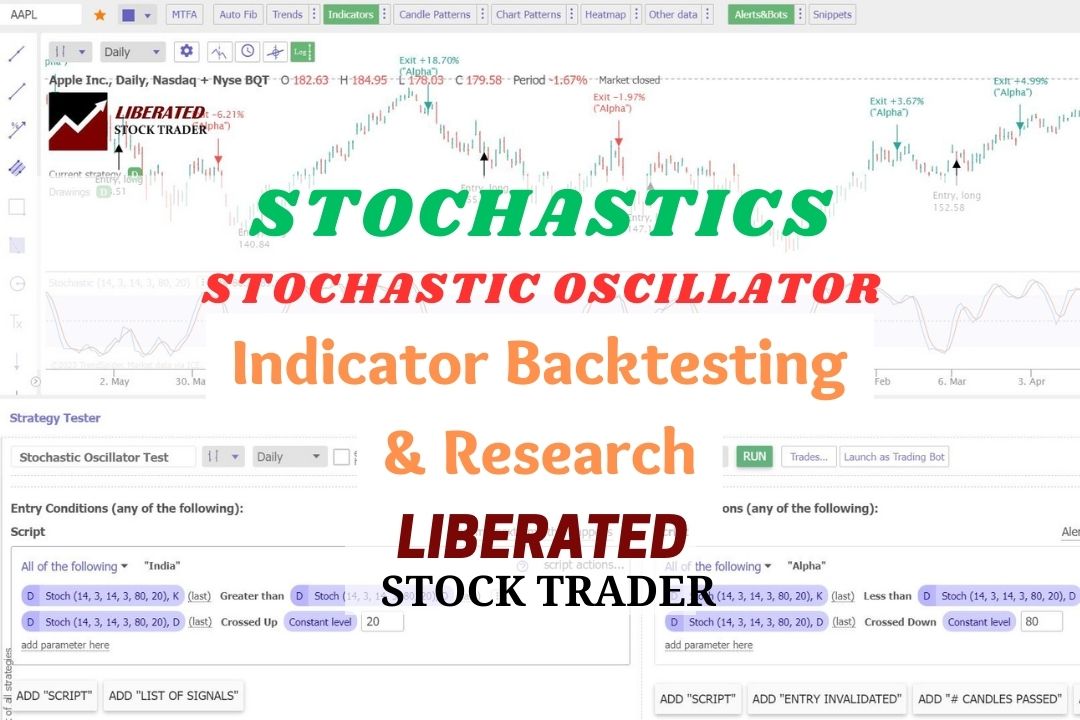
The Stochastic Oscillator momentum indicator compares an asset's closing price to a range of its previous prices. It oscillates between 0 and 100; below 20 indicates oversold, and above 80 suggests an overbought market.| Liberated Stock Trader
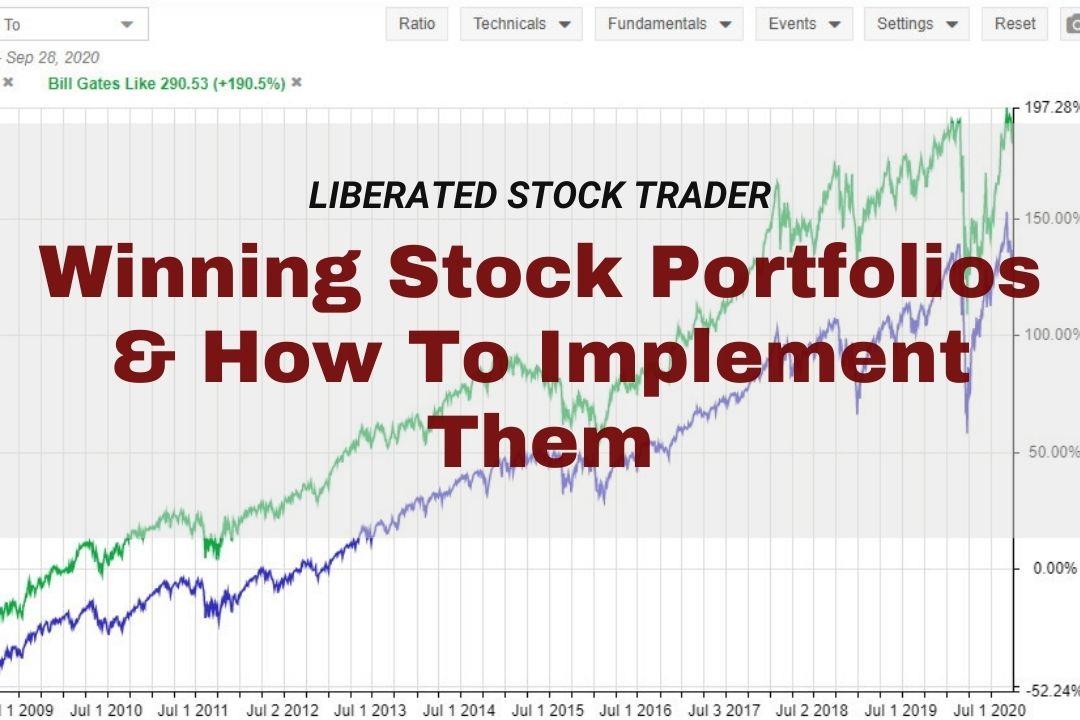
Our years of performance testing reveal the world's best-performing stock portfolios are Berkshire Hathaway, CANSLIM, GreenBlatt's Magic Formula, and the FAANG portfolio. We share examples and show you how to implement them.| Liberated Stock Trader
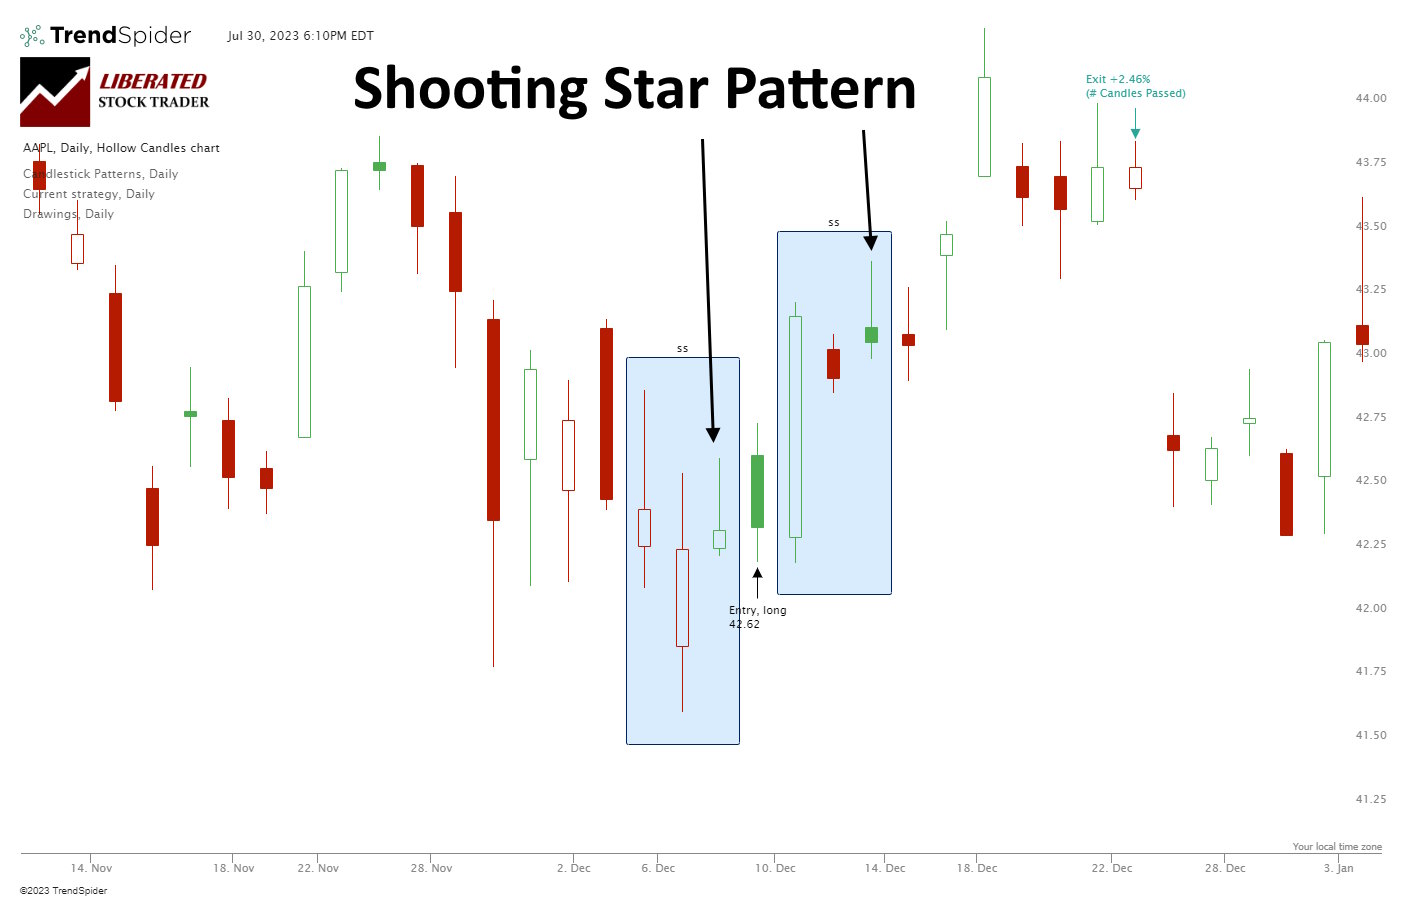
Based on our 568 years of backtested data, the Shooting Star candle is profitable. It has a 57.1% upside success rate and an average winning trade of 3.6%. Each trade made using a shooting star nets an average of 0.56% profit.| Liberated Stock Trader
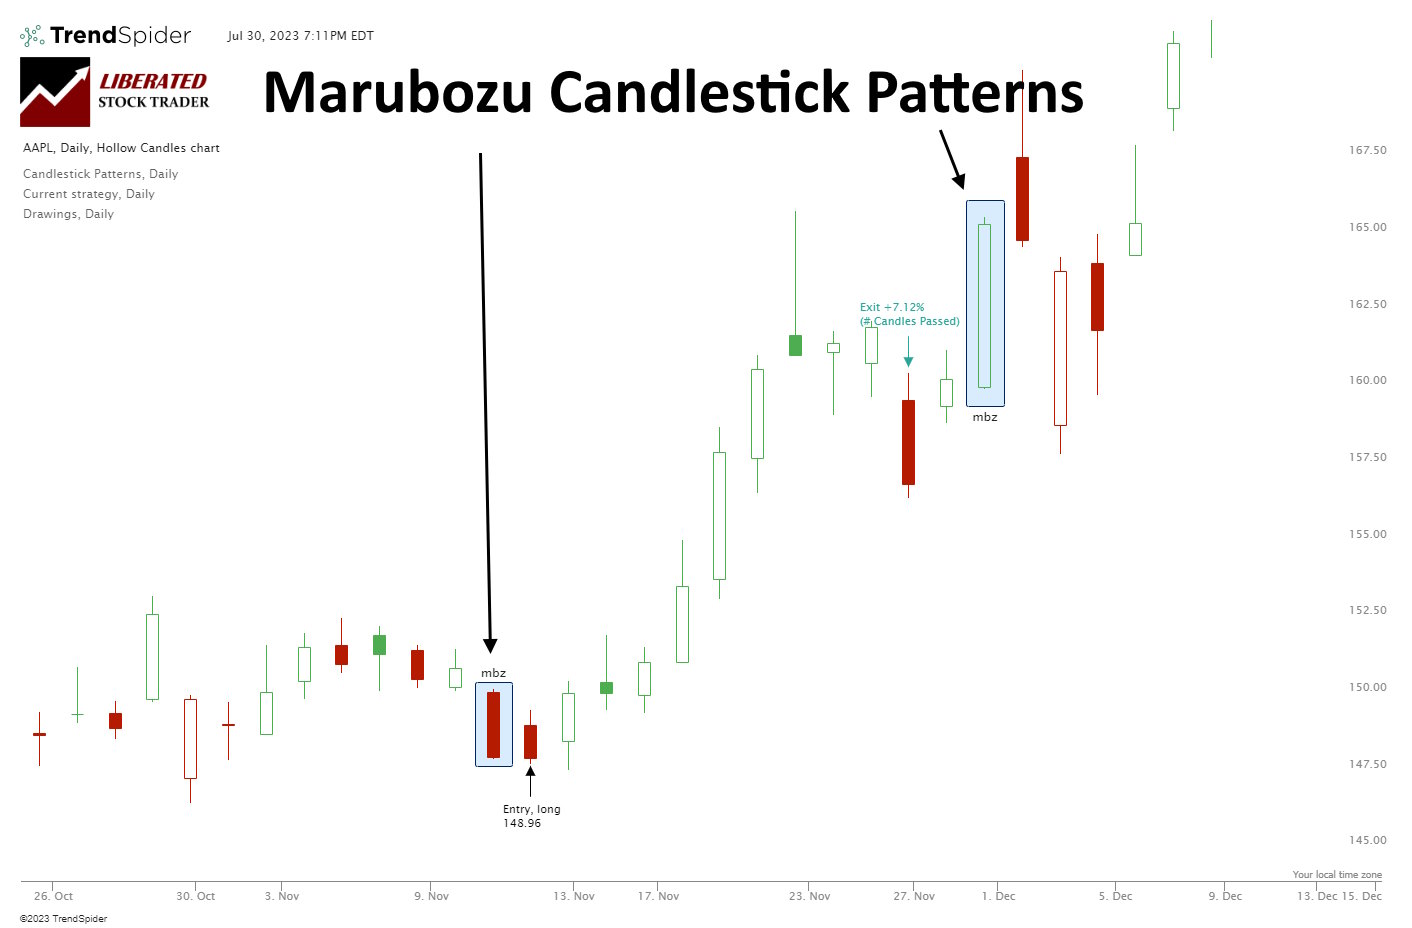
Our research shows Bearish Marubozu candles are among the most profitable patterns. Based on 568 years of data, it has a 56.1% success rate and an average win of 4.1%. Conversely, the Bullish Marubozu is one of the worst.| Liberated Stock Trader
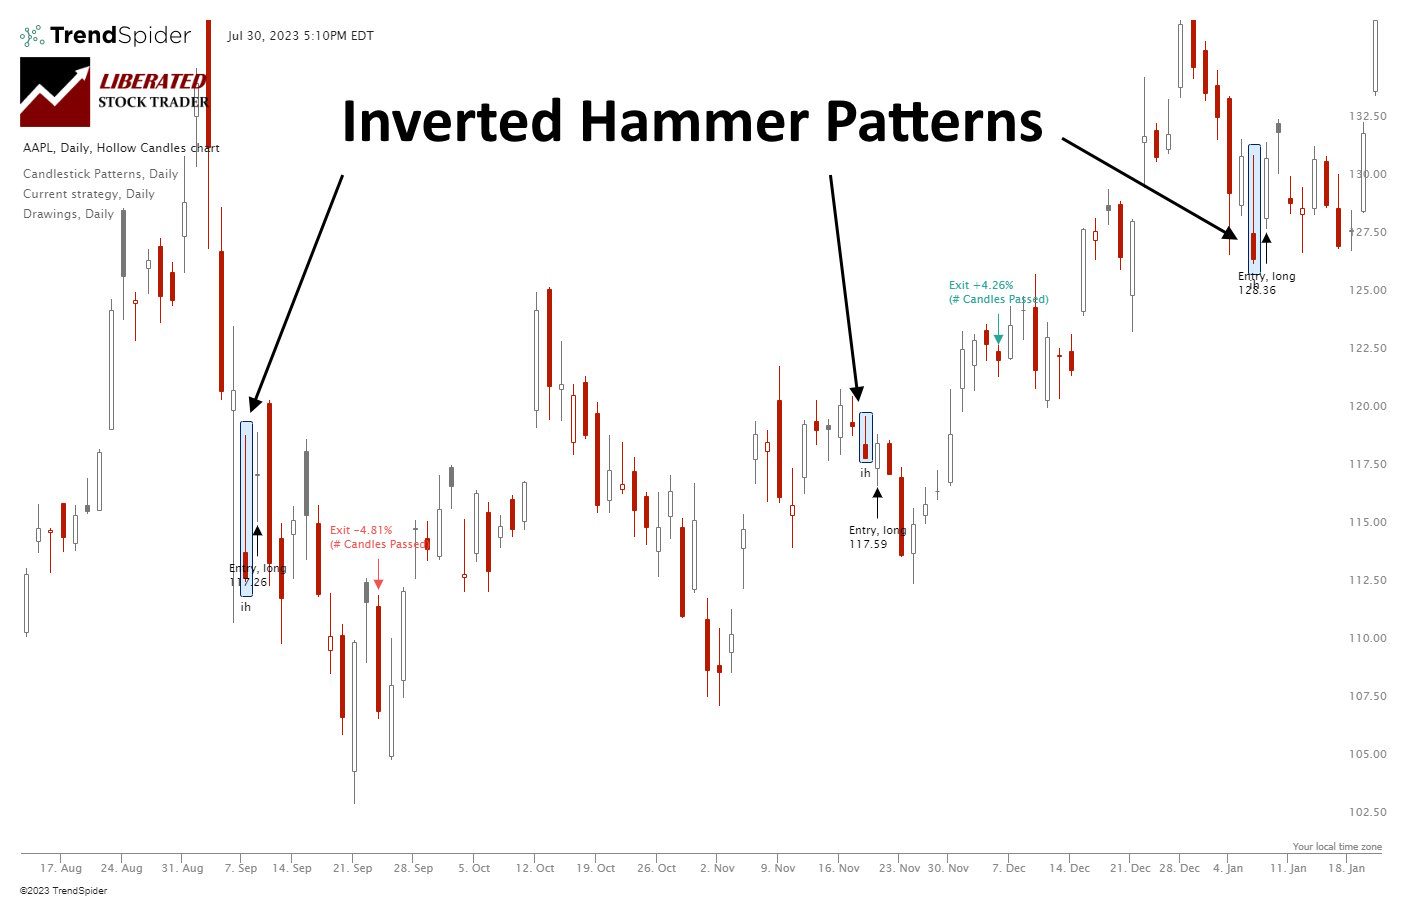
Our research shows the Inverted Hammer is the most accurate and profitable candlestick pattern. Used as a bullish signal, it has a 60% success rate and an average win of 4.2%, based on 588 years of data.| Liberated Stock Trader
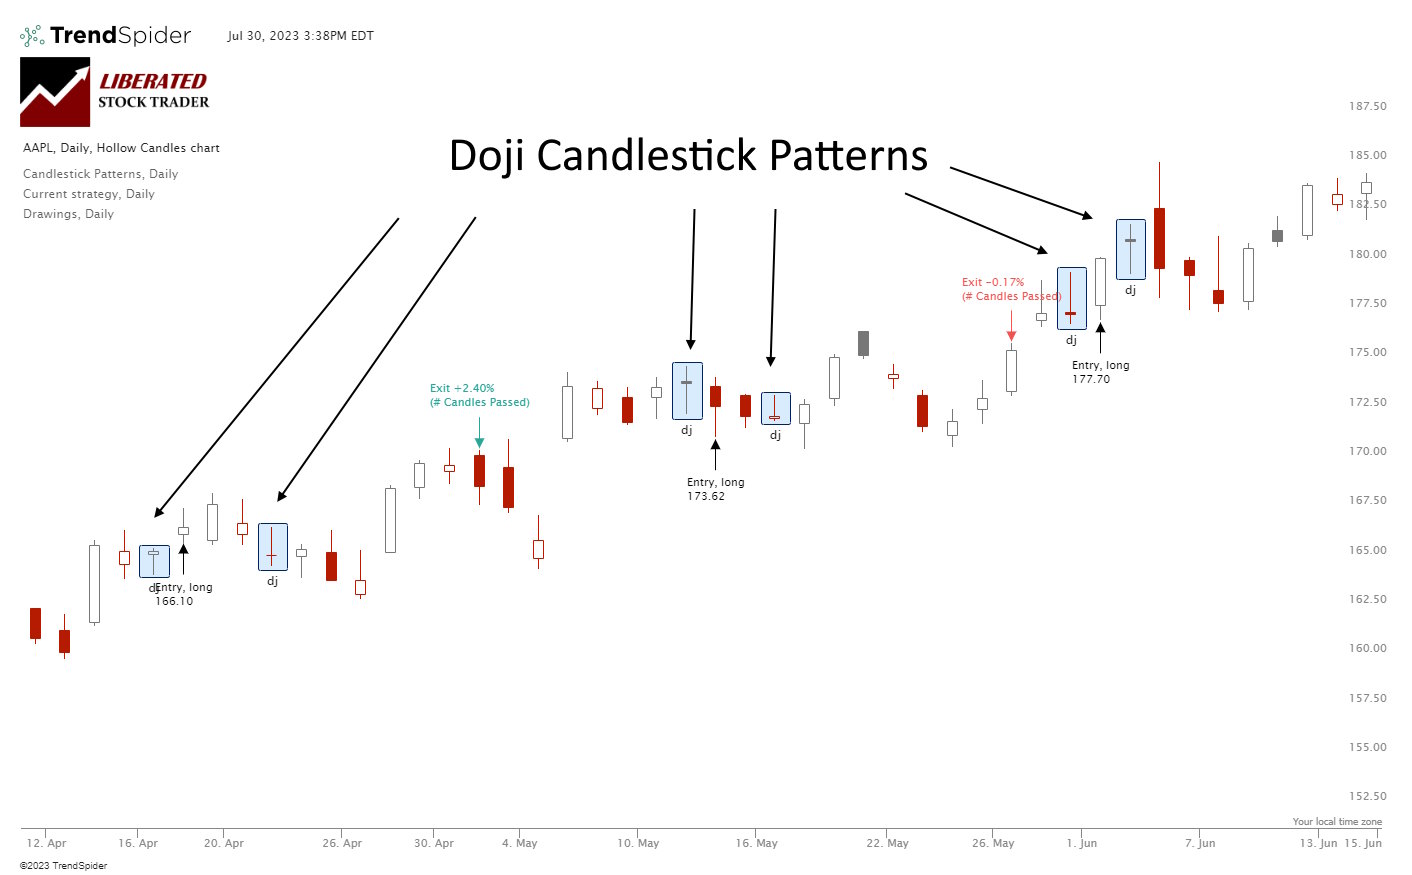
A Doji candlestick chart pattern indicates a battle between buyers and sellers, ending in equilibrium. The Doji marks a potential trend reversal. Is the Doji pattern profitable or accurate? Our evidence suggests its profitability is marginal.| Liberated Stock Trader
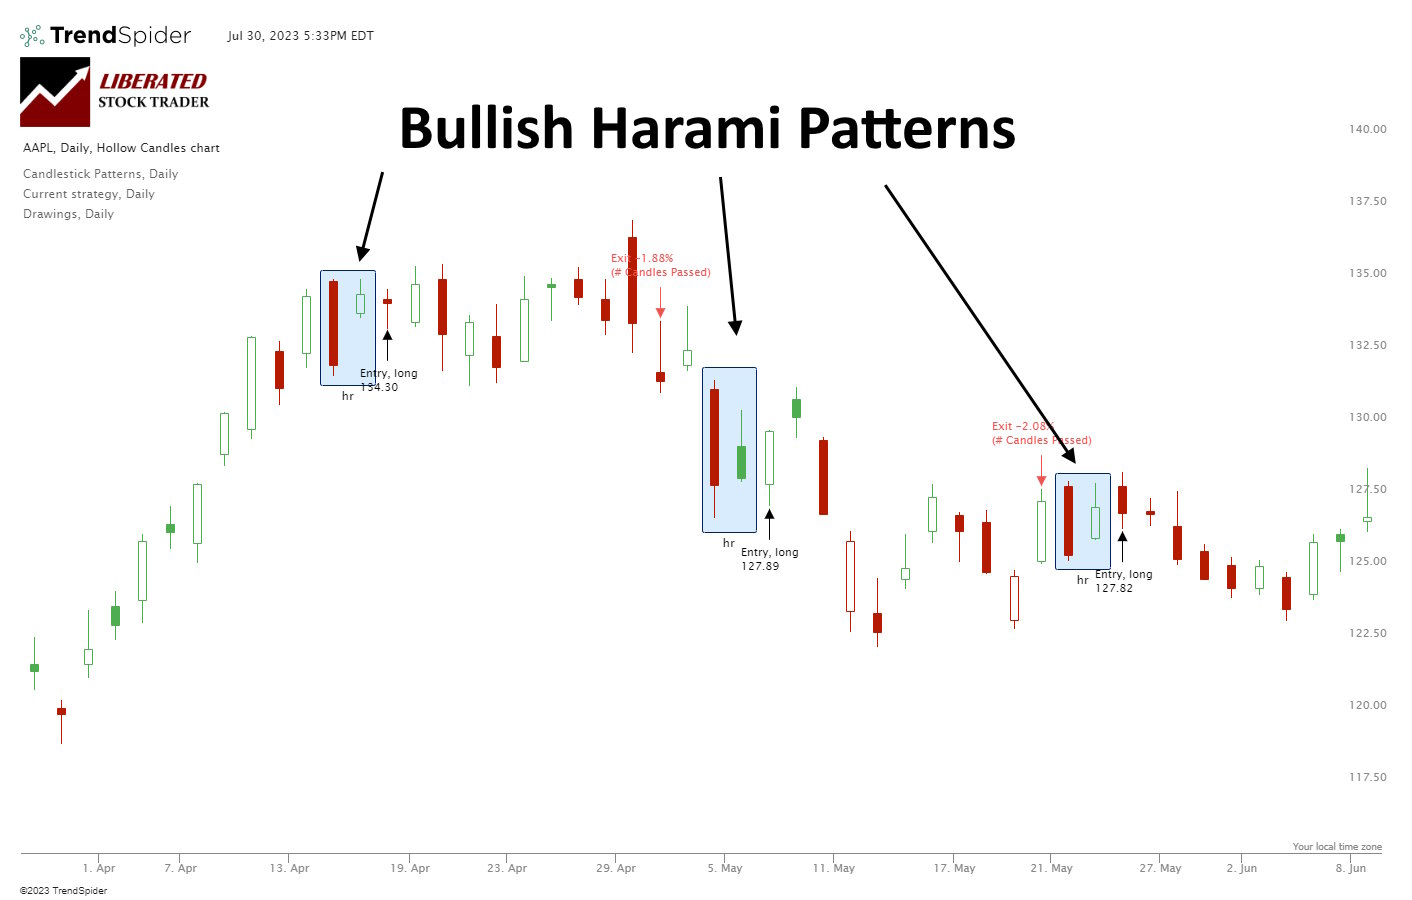
Our research shows Bullish Harami and Bullish Harami Cross are profitable patterns. Based on 1,112 years of data, the bullish Harami has an average profit per trade of 0.5% and the Harami Cross 0.58%.| Liberated Stock Trader
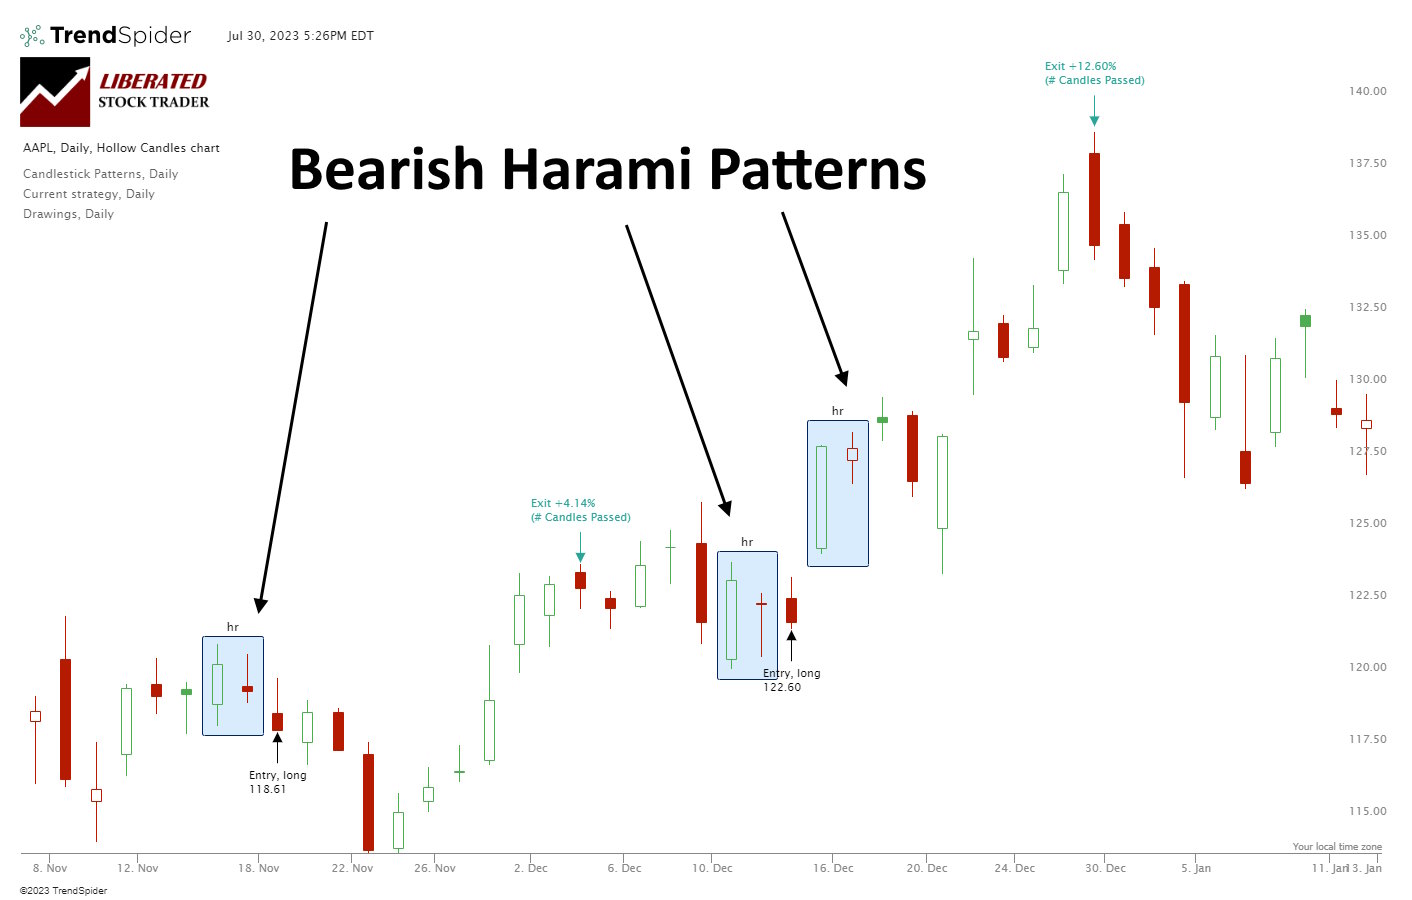
Our research shows Bearish Harami and Bearish Harami Cross are profitable patterns. Based on 1,136 years of data, the Bullish Harami has an average profit per trade of 0.48% and the Harami Cross 0.57%.| Liberated Stock Trader
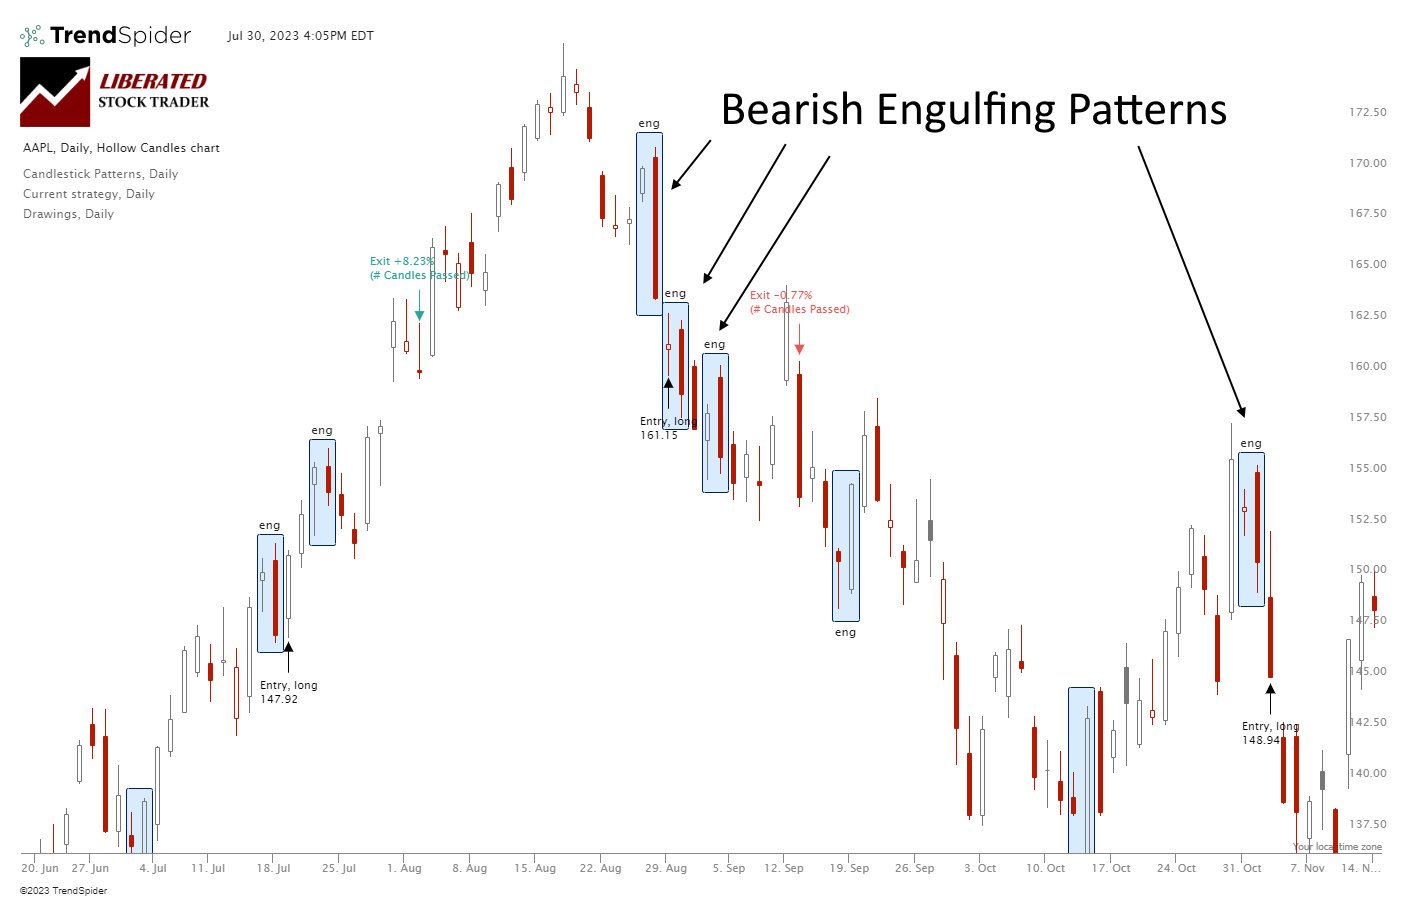
My research shows the Bearish Engulfing candle is an accurate and profitable pattern. Using 568 years of data, my testing revealed a 57% success rate and an average win of 3.7%.| Liberated Stock Trader
An exponential moving average (EMA) technical indicator reduces the lag associated with simple moving averages (SMA) by applying a multiplier to the most recent data. EMAs provide improved sensitivity, enhancing the accuracy of trend analysis.| Liberated Stock Trader
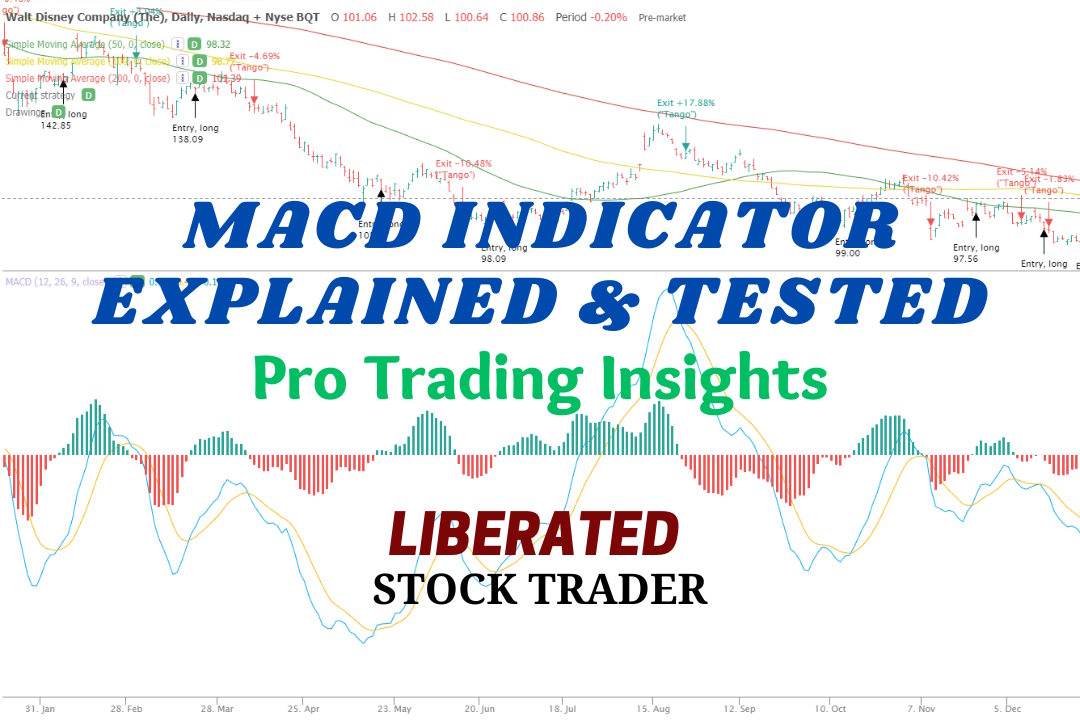
MACD is a trend-following momentum indicator used to identify price trends. We conducted 606,422 test trades to find the best settings and trading strategies.| Liberated Stock Trader
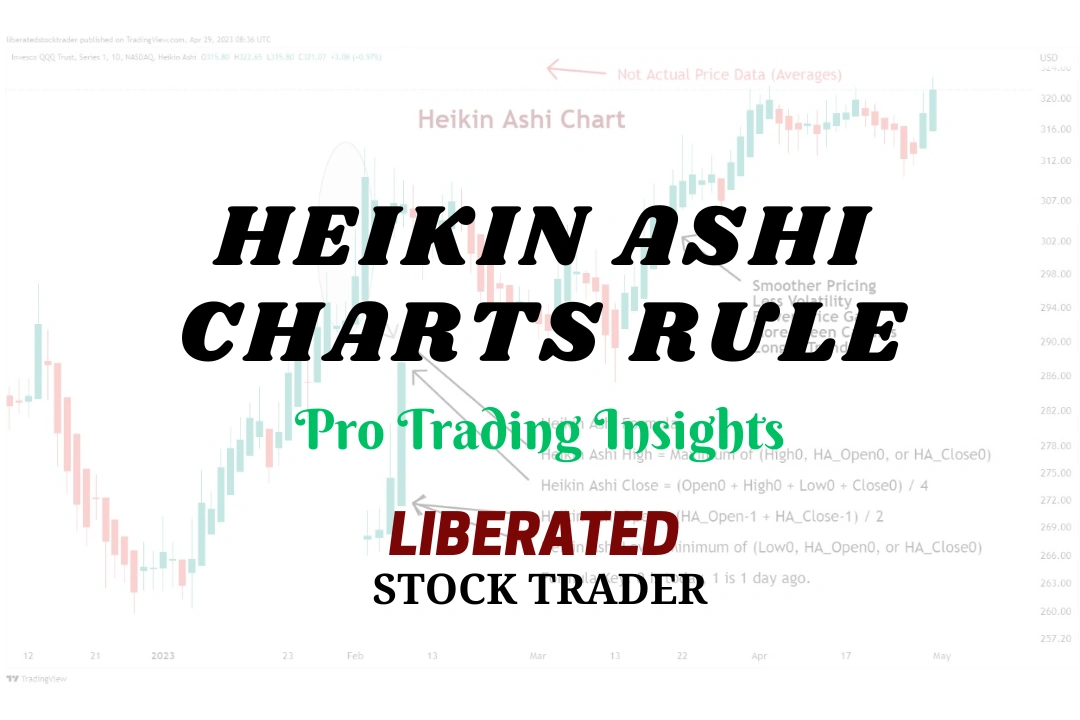
I backtested 360 years of data on the 30 most important US stocks, and our findings prove that Heikin-Ashi chart strategies outperform 66% of equities vs. a buy-and-hold strategy.| Liberated Stock Trader
To create an algo trading system, you must choose a strategy, select a trading platform, choose the asset type, select the indicators and patterns, backtest, and refine the strategy.| Liberated Stock Trader
The simple moving average (SMA) technical analysis indicator helps identify stock price trends. It calculates an arithmetic average of prices, offering a smooth line that eliminates short-term price volatility.| Liberated Stock Trader
The Relative Strength Index (RSI) is an oscillating momentum indicator that measures the speed and change of stock price movements. RSI uses a scale from 0 to 100 to indicate overbought or oversold conditions.| Liberated Stock Trader
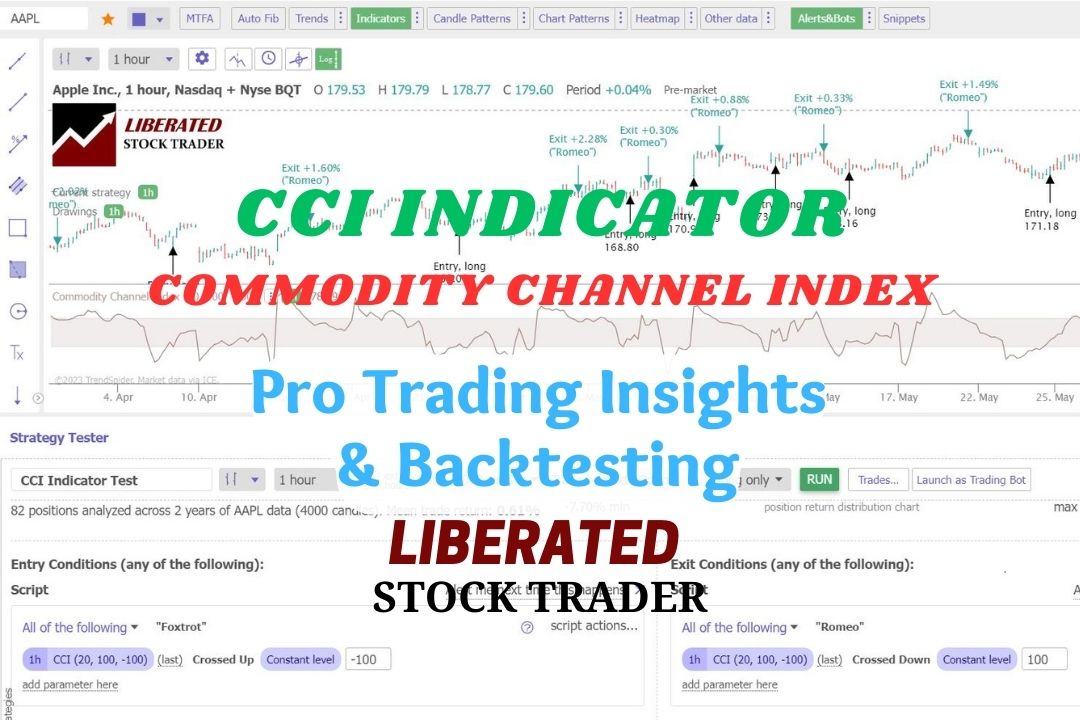
Our test data shows that using the CCI indicator with a 50 setting on the S&P 500 index stocks over 20 years was incredibly profitable, returning a 1,108% profit compared to the market, which returned 555%.| Liberated Stock Trader
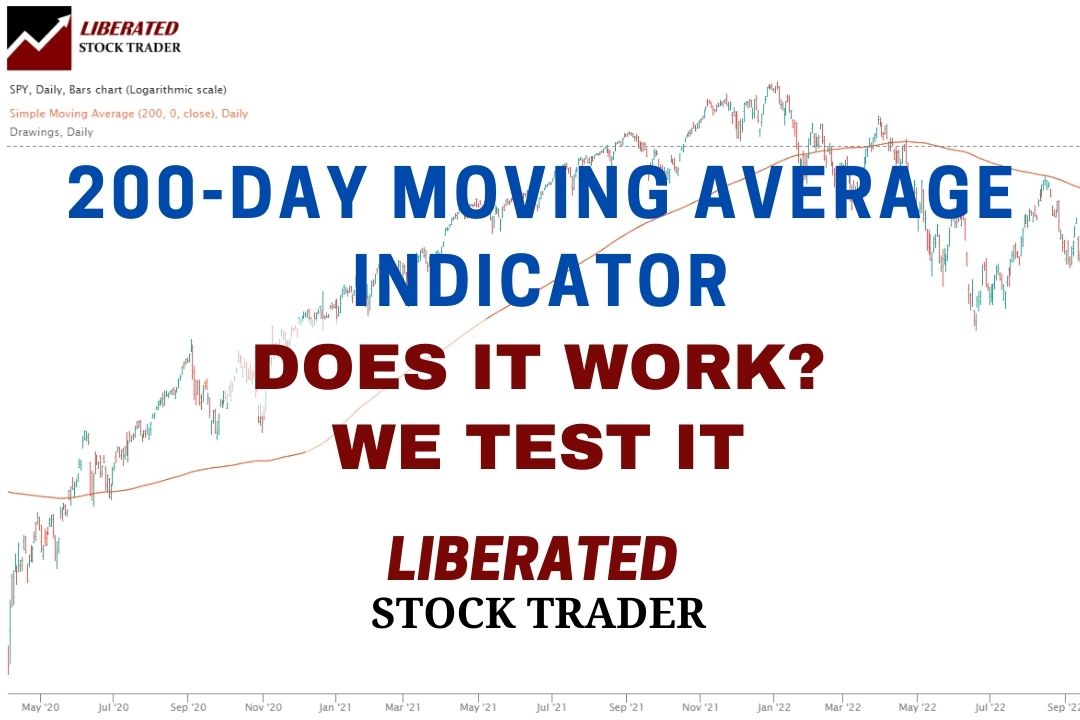
Our testing of the 200-day MA on the S&P500 over 16 years revealed that using this indicator is a losing proposition. A buy-and-hold strategy made a profit of 192% vs. the 200-day MA, which made only 152%.| Liberated Stock Trader
Our research on 10,400 years of exchange data shows the best day trading indicators are the Price Rate of Change, VWAP, Weighted Moving Average, Hull Moving Average, Simple Moving Average, and RSI.| Liberated Stock Trader
The Hull Moving Average (HMA) is a highly responsive technical analysis indicator designed to reduce lag. Our research reveals it outperforms other moving averages.| Liberated Stock Trader