Sell Signals In Stock Trading: How I Identify, Evaluate, and Act
A sell signal gives traders a heads-up on when to consider closing positions, helping them lock in gains or cut losses using actual triggers, not just hunches.| Liberated Stock Trader
A sell signal gives traders a heads-up on when to consider closing positions, helping them lock in gains or cut losses using actual triggers, not just hunches.| Liberated Stock Trader

As a Professional market analyst, I build effective trading strategies using techniques such as indicator divergences, multi-time frame analysis, indicator combinations, and rigorous backtesting.| Liberated Stock Trader
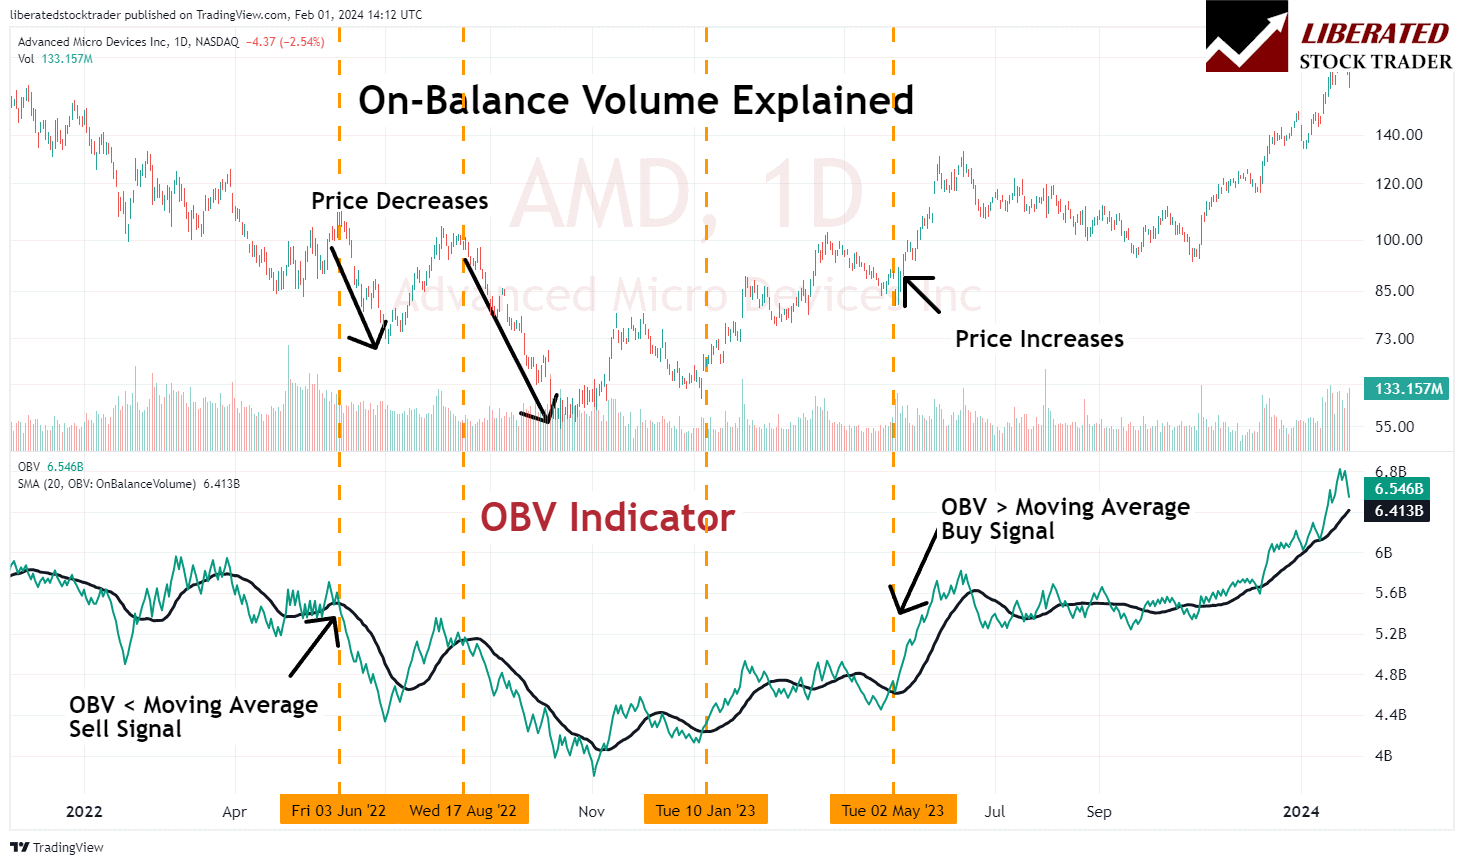
On-balance volume (OBV) is a cumulative indicator in technical analysis designed to show the volume flow relative to a security's price movements. The OBV reflects the collective buying and selling pressure crystallized through the volume trend.| Liberated Stock Trader
Based on our extensive testing, it has been determined that when used as a standalone indicator, Supertrend does not demonstrate reliability or profitability. With an average profit expectancy of 0.24, it is recommended to combine Supertrend with other indicators.| Liberated Stock Trader

The average true range (ATR) is a nondirectional momentum indicator that measures price volatility. Our 1,205 test trades showed a solid 1.77 reward-to-risk ratio with an average 8.5% winning trade.| Liberated Stock Trader
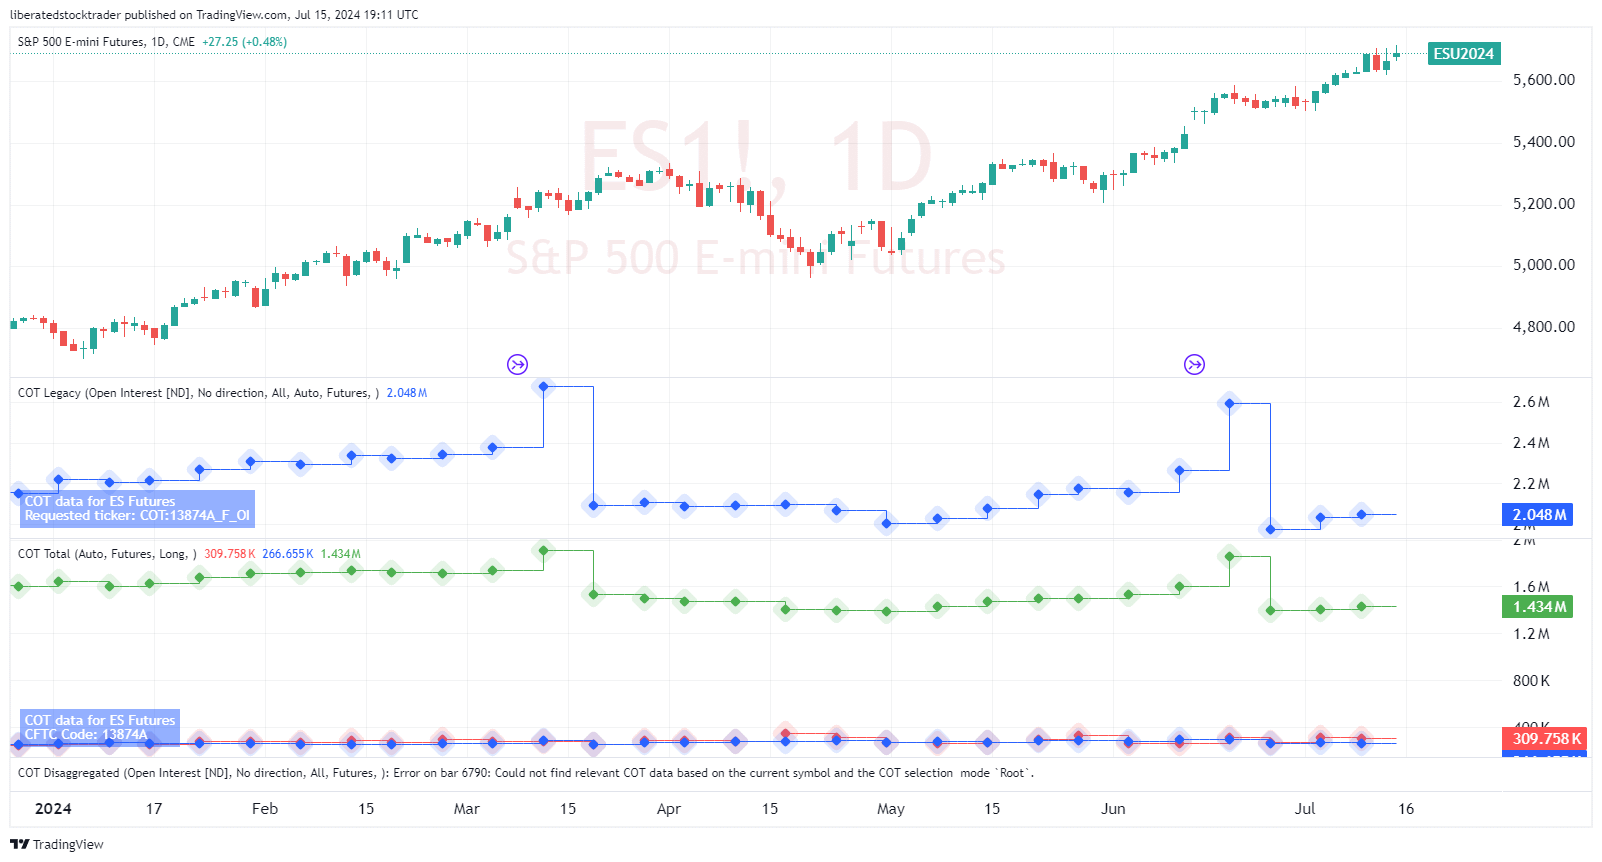
The Commitment of Traders (COT) Report is a valuable tool for traders wanting to understand market sentiment in the futures markets.| Liberated Stock Trader
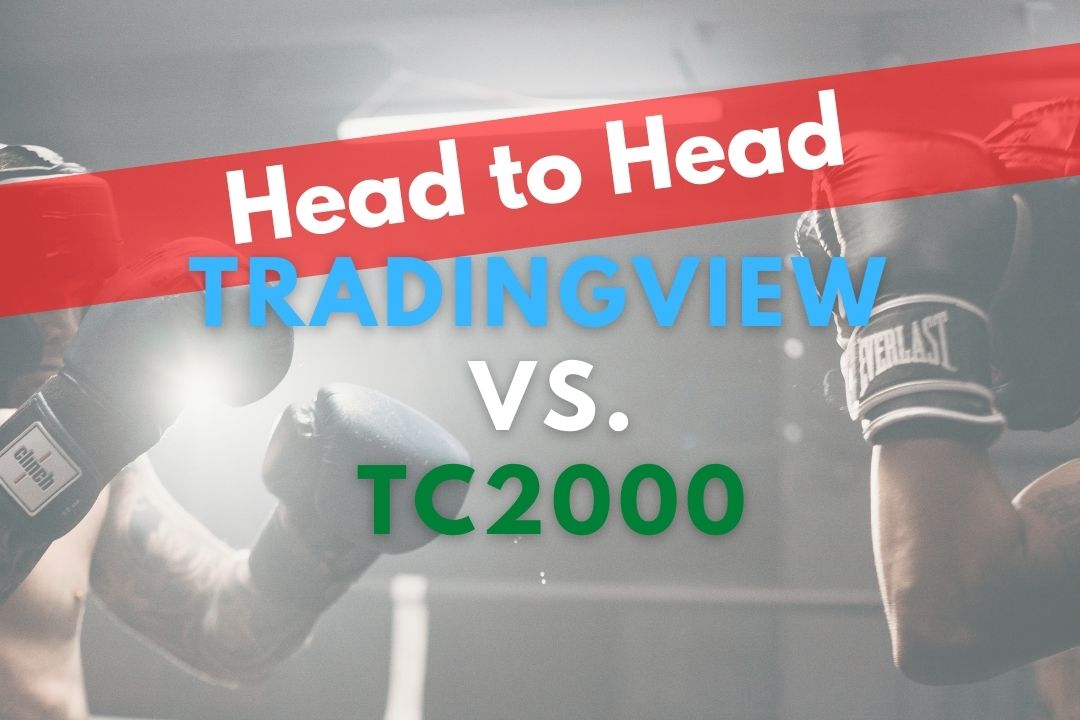
TradingView's depth of features is the key difference versus TC2000. TC2000 offers powerful charts, scanning, and stock and options trading in the USA. But TradingView enables charting, screening, backtesting, and trading stocks, forex, futures, and crypto globally.| Liberated Stock Trader

Seasonal trends refer to certain sectors, like retail, which often perform better during holiday seasons, while agricultural products might see spikes during harvest times.| Liberated Stock Trader

My testing shows the best TradingView indicators for advanced analysis are Volume Profile HD, VWAP, Supertrend, ATR, Relative Volatility, and RSI. TradingView's candlestick and chart pattern recognition algorithms are game changers for improving trading outcomes.| Liberated Stock Trader
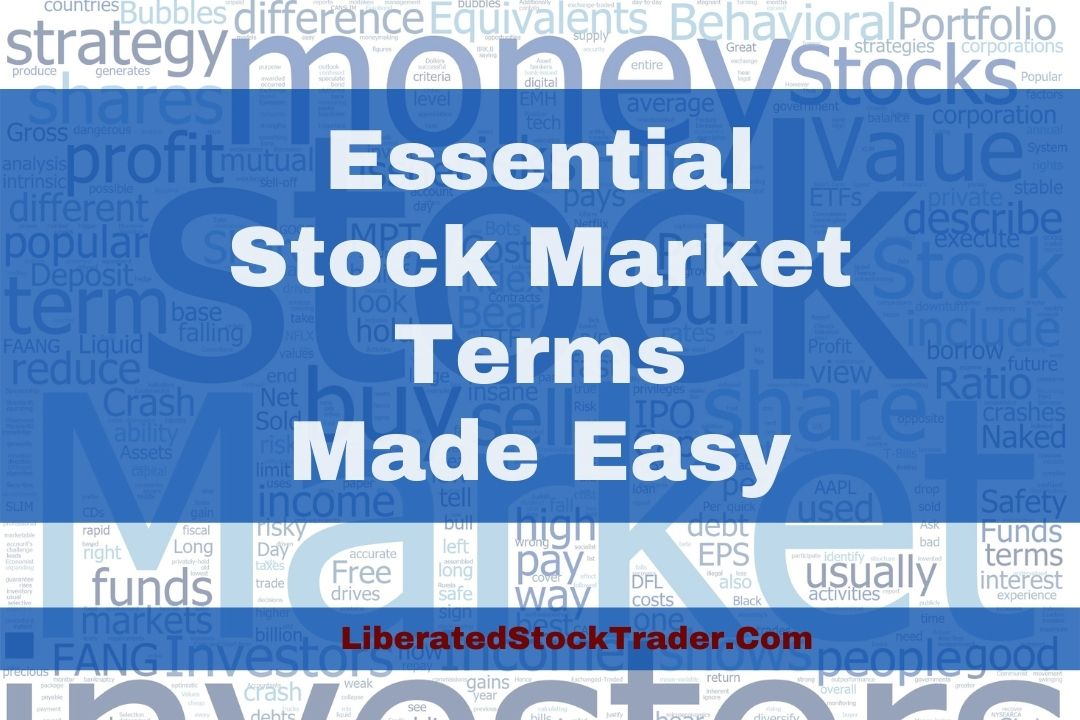
We explain the 101 most important stock market terms and decipher financial jargon with simple definitions and practical examples.| Liberated Stock Trader
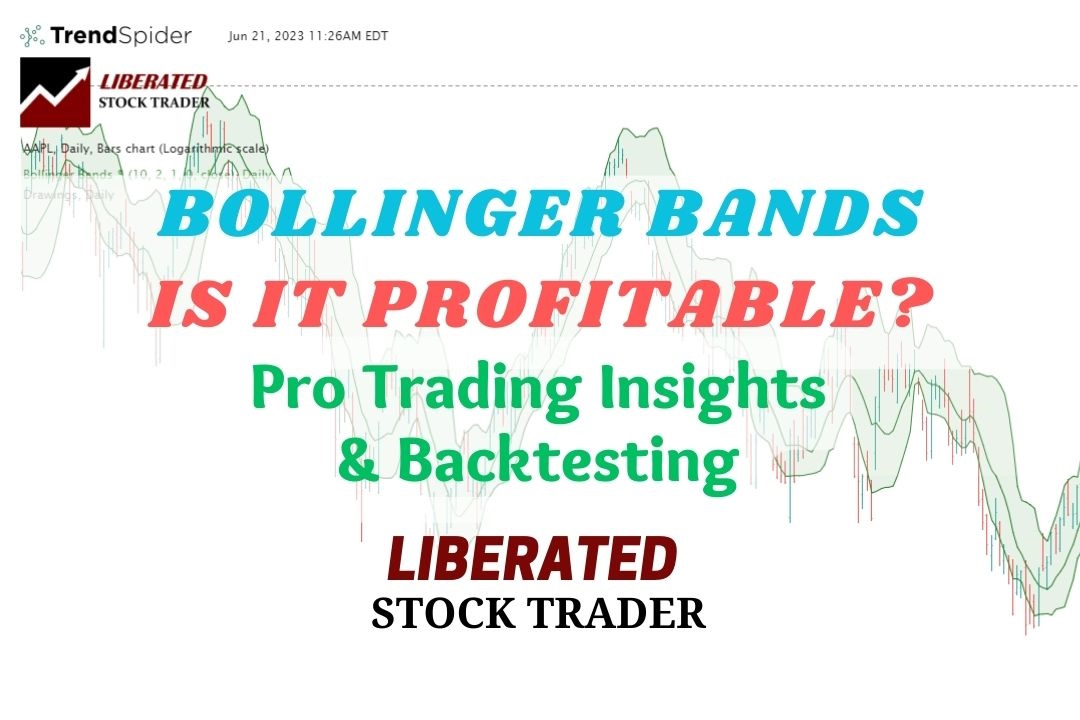
My reliability testing of Bollinger Bands on the S&P 500, using 13,360 years of data, suggests it is an unprofitable indicator for traders. However, Bollinger Bands can be highly profitable, with the optimal settings.| Liberated Stock Trader
Our ultimate guide to technical analysis, with its 14 videos and detailed examples covering charts, trends, indicators, patterns, and tools, will fast-track your knowledge.| Liberated Stock Trader
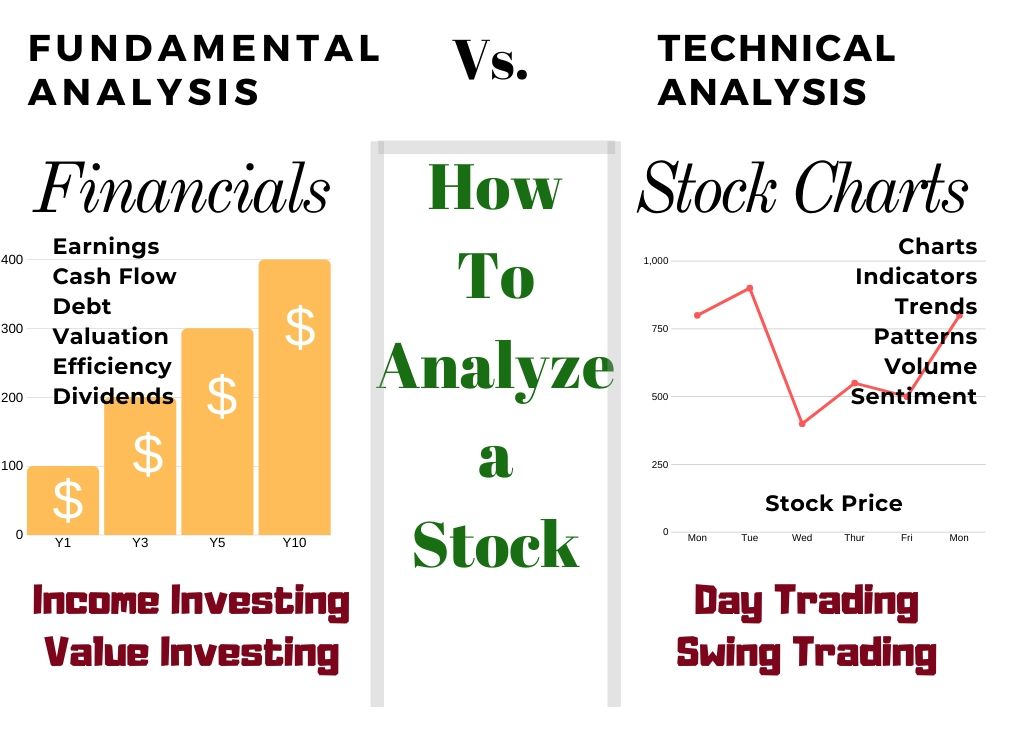
There are two ways to analyze stocks. Fundamental analysis, which evaluates criteria such as PE ratio, earnings, and cash flow. Technical analysis, which involves studying charts, stock prices, volume, and indicators.| Liberated Stock Trader
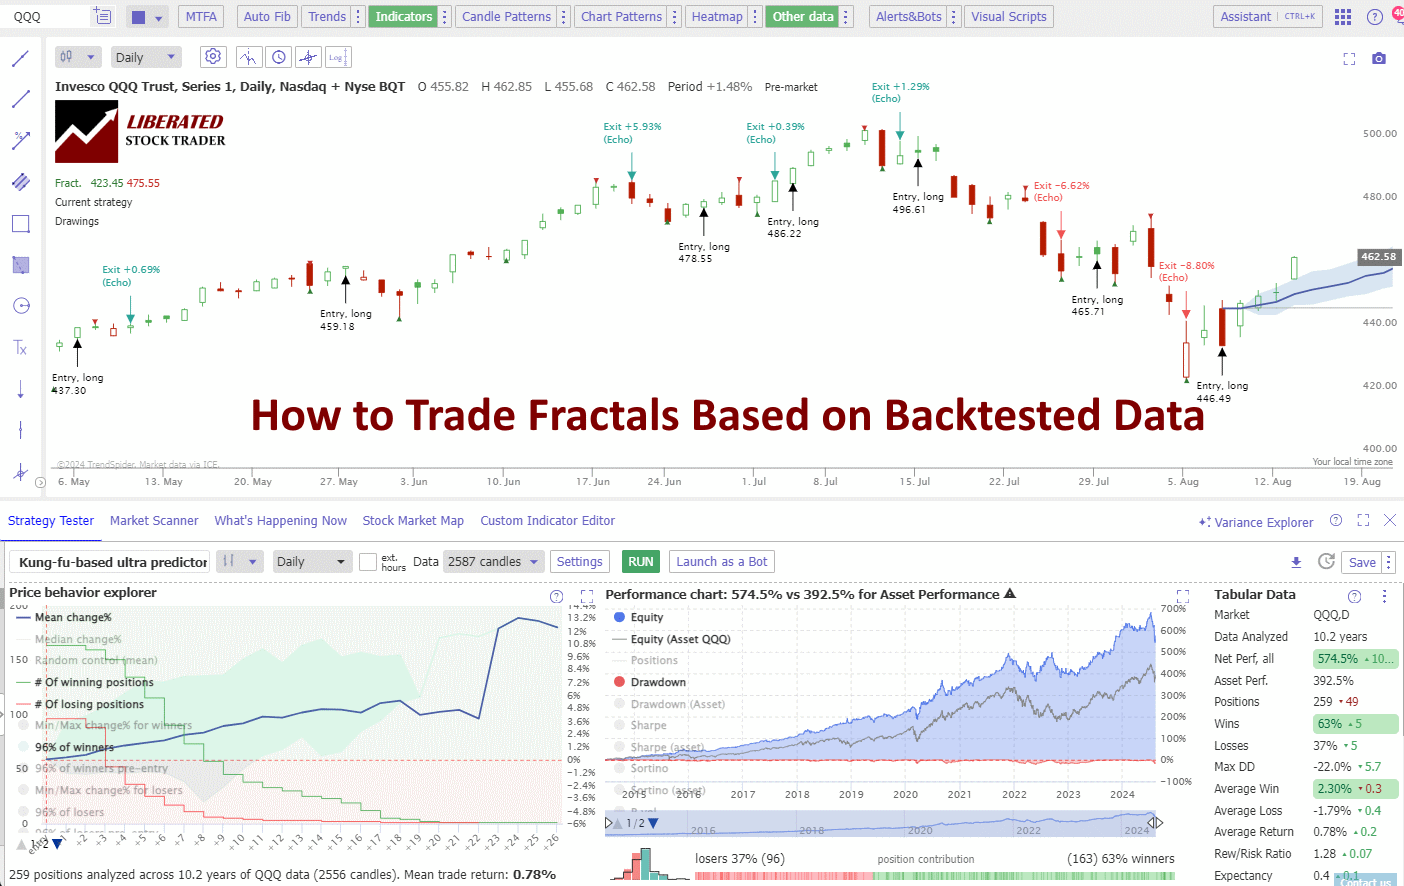
Based on 2,510 tested trades on 80 years of exchange data, I can confirm trading fractal patterns is profitable, with an average reward-to-risk ratio rate of 1.5 across all timescales.| Liberated Stock Trader
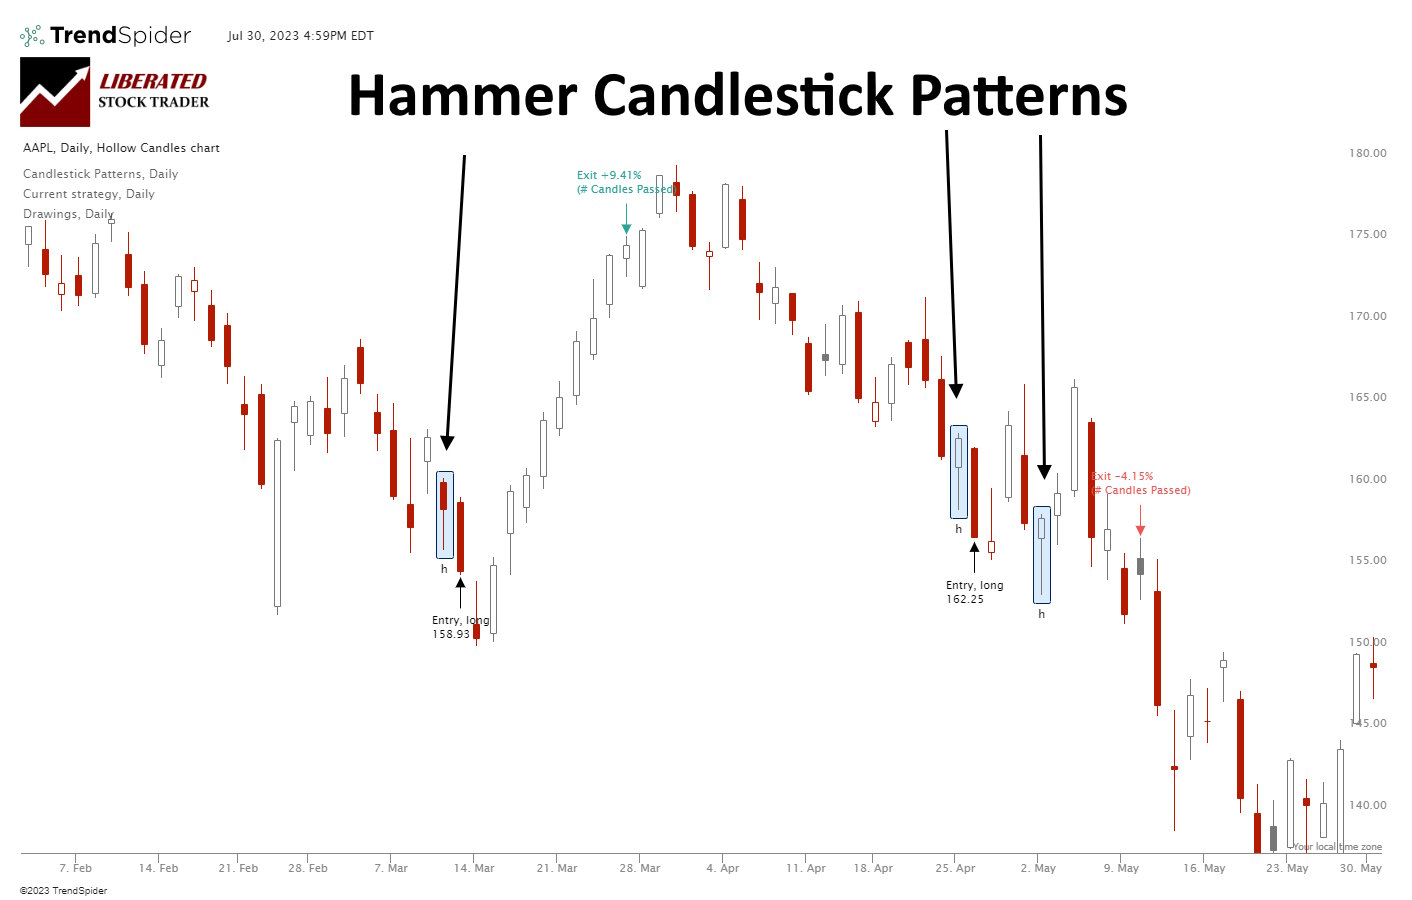
According to 2,219 tested trades, a Hammer is extremely unreliable and unprofitable. It has a low % accuracy rate of 52.1%, resulting in a razor-thin 0.18% profit per trade.| Liberated Stock Trader
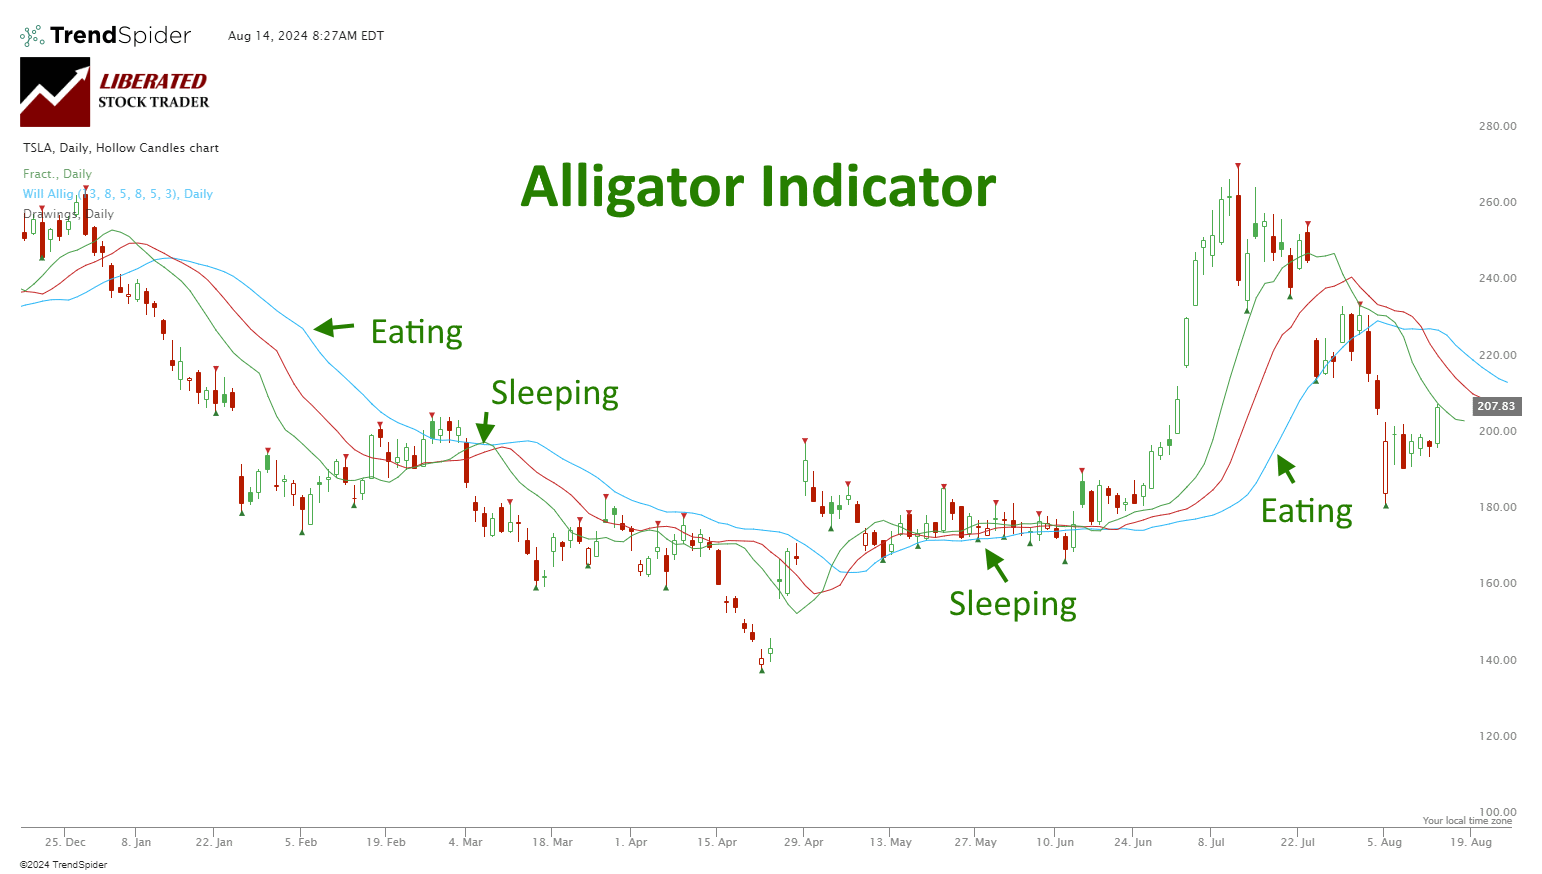
My unique research shows that the Alligator indicator is highly profitable in stocks and indices, using daily and weekly chart timeframes. It is also only profitable on a weekly chart for Forex.| Liberated Stock Trader

Ultimately, for 95% of speculators, day trading is not worth it. Although day traders can make significant money quickly, statistics show that most day traders lose money. Over a six-month period excessive commissions, poor trading decisions, weak strategies, and bad market timing cause losses.| Liberated Stock Trader
The mean reversion trading strategy suggests prices and returns eventually move back toward the mean or average. Reliable indicators like Stochastics, RSI, and Bollinger bands are based on mean reversion to identify overbought and oversold conditions.| Liberated Stock Trader
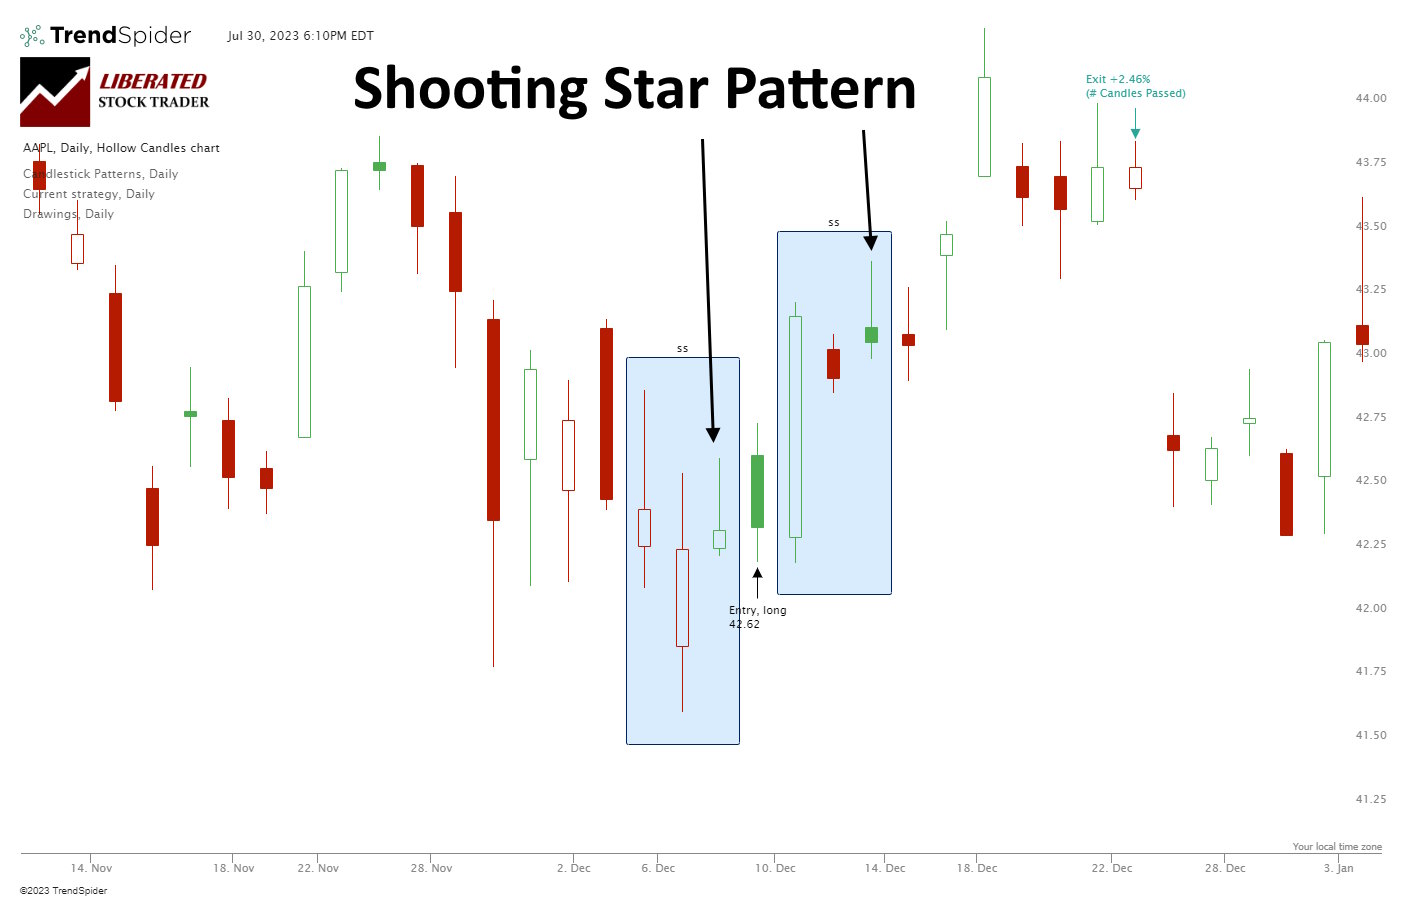
Based on our 568 years of backtested data, the Shooting Star candle is profitable. It has a 57.1% upside success rate and an average winning trade of 3.6%. Each trade made using a shooting star nets an average of 0.56% profit.| Liberated Stock Trader
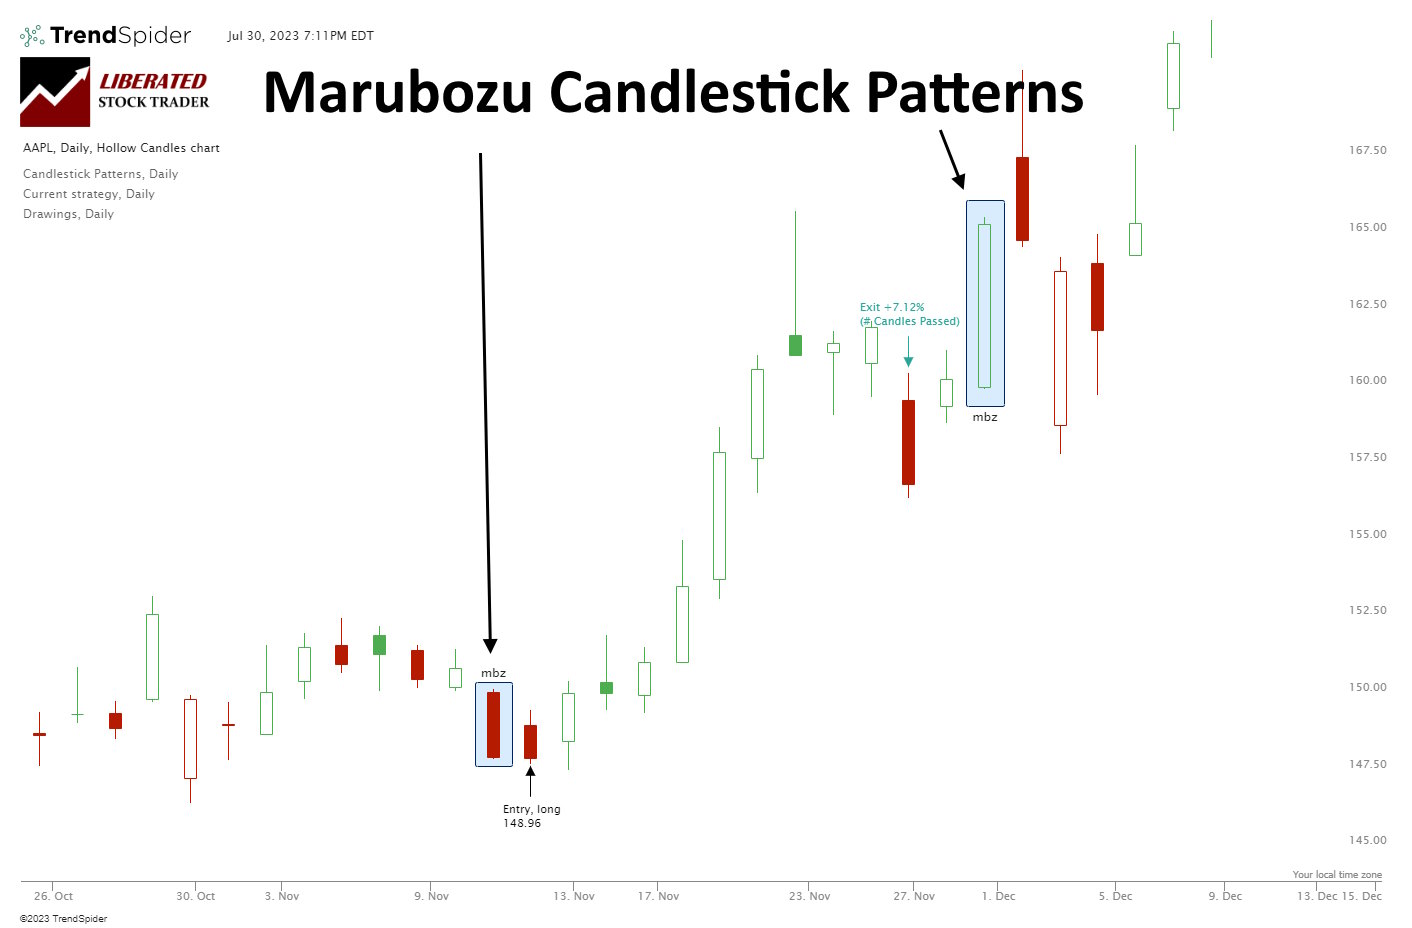
Our research shows Bearish Marubozu candles are among the most profitable patterns. Based on 568 years of data, it has a 56.1% success rate and an average win of 4.1%. Conversely, the Bullish Marubozu is one of the worst.| Liberated Stock Trader
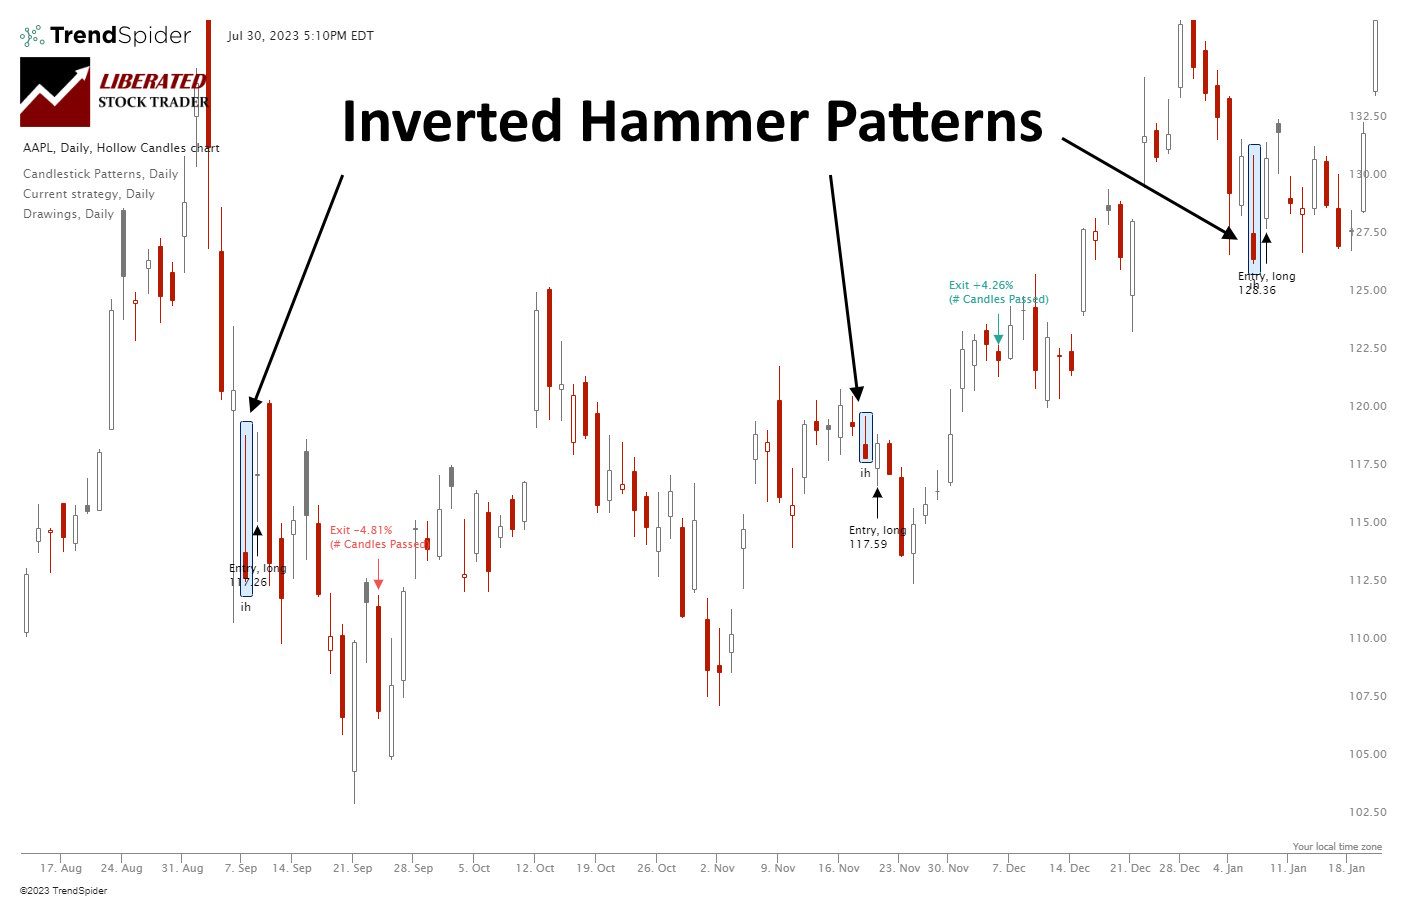
Our research shows the Inverted Hammer is the most accurate and profitable candlestick pattern. Used as a bullish signal, it has a 60% success rate and an average win of 4.2%, based on 588 years of data.| Liberated Stock Trader
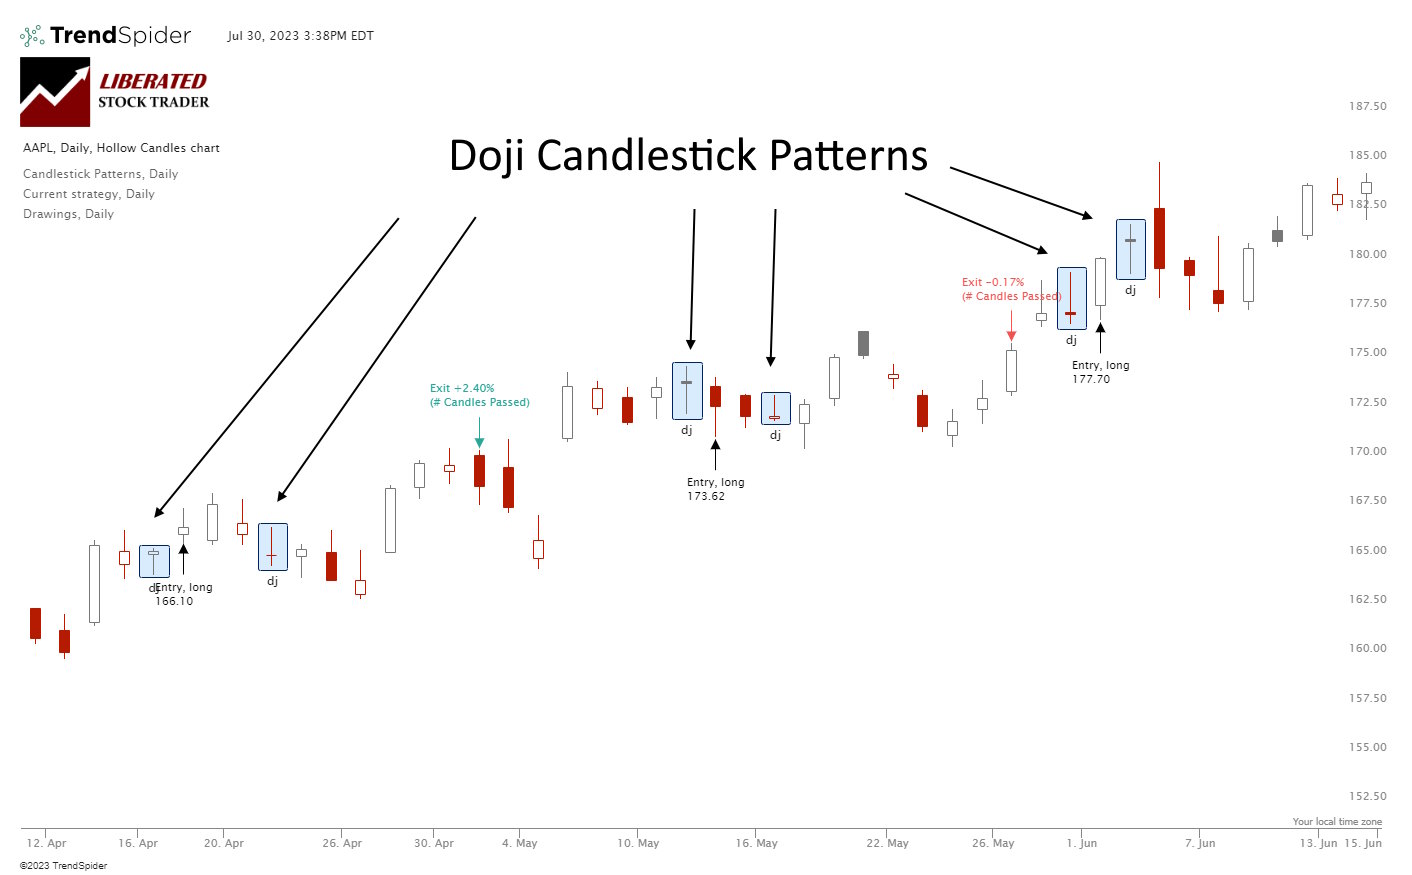
A Doji candlestick chart pattern indicates a battle between buyers and sellers, ending in equilibrium. The Doji marks a potential trend reversal. Is the Doji pattern profitable or accurate? Our evidence suggests its profitability is marginal.| Liberated Stock Trader
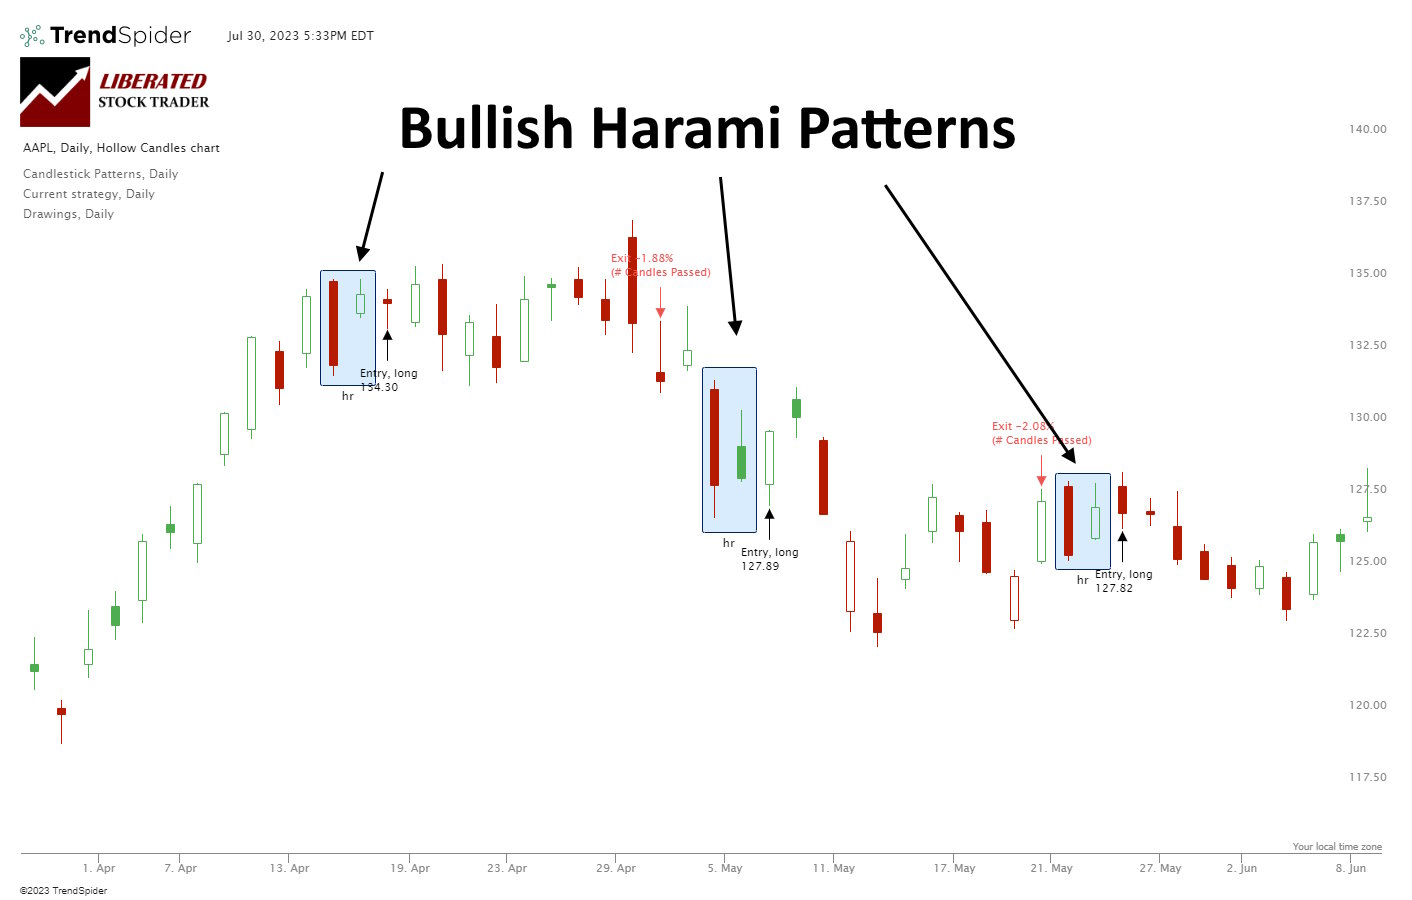
Our research shows Bullish Harami and Bullish Harami Cross are profitable patterns. Based on 1,112 years of data, the bullish Harami has an average profit per trade of 0.5% and the Harami Cross 0.58%.| Liberated Stock Trader
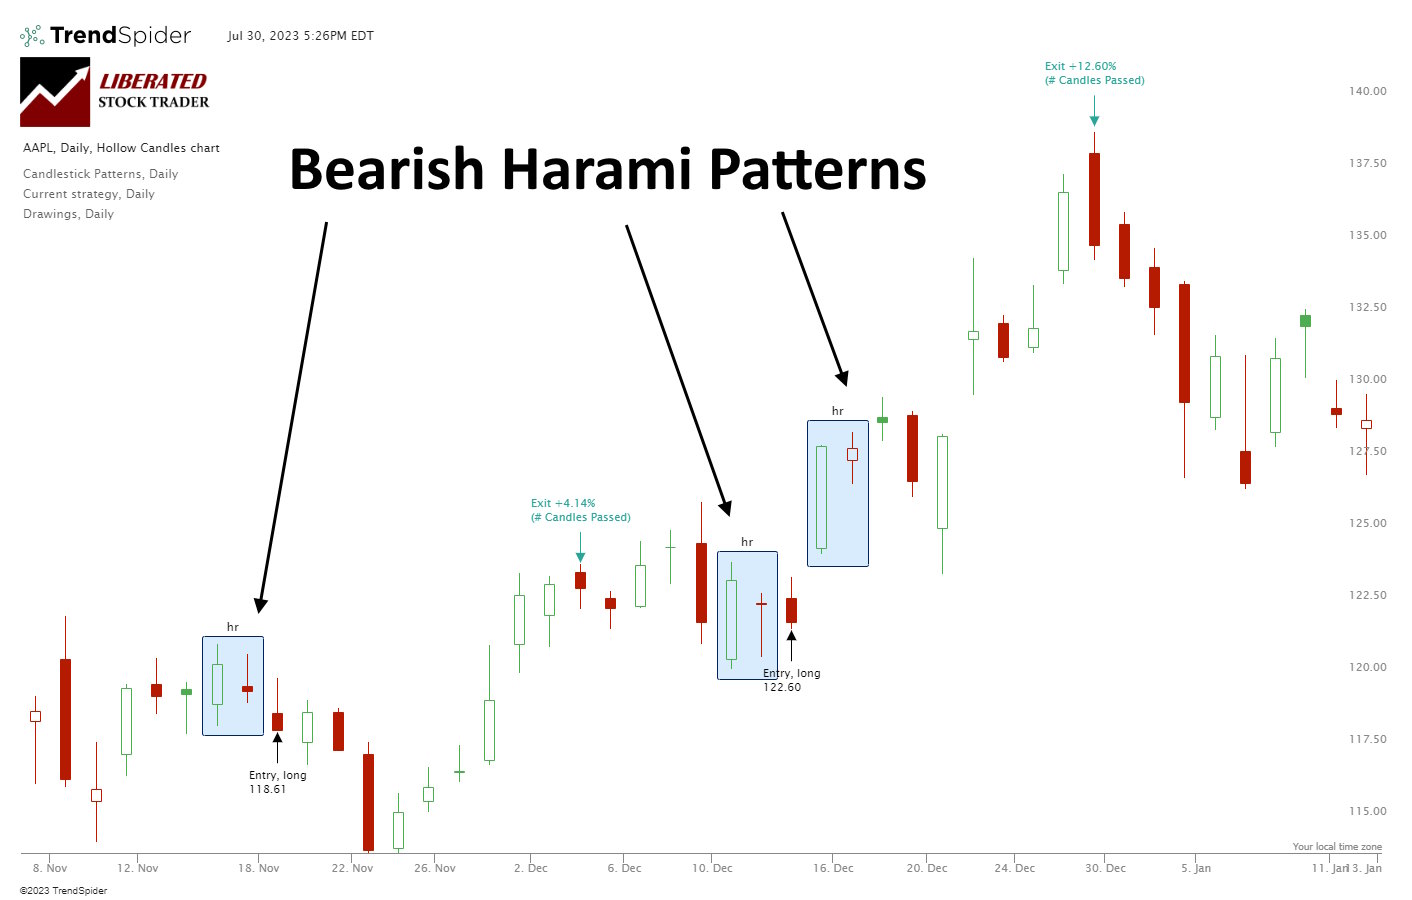
Our research shows Bearish Harami and Bearish Harami Cross are profitable patterns. Based on 1,136 years of data, the Bullish Harami has an average profit per trade of 0.48% and the Harami Cross 0.57%.| Liberated Stock Trader
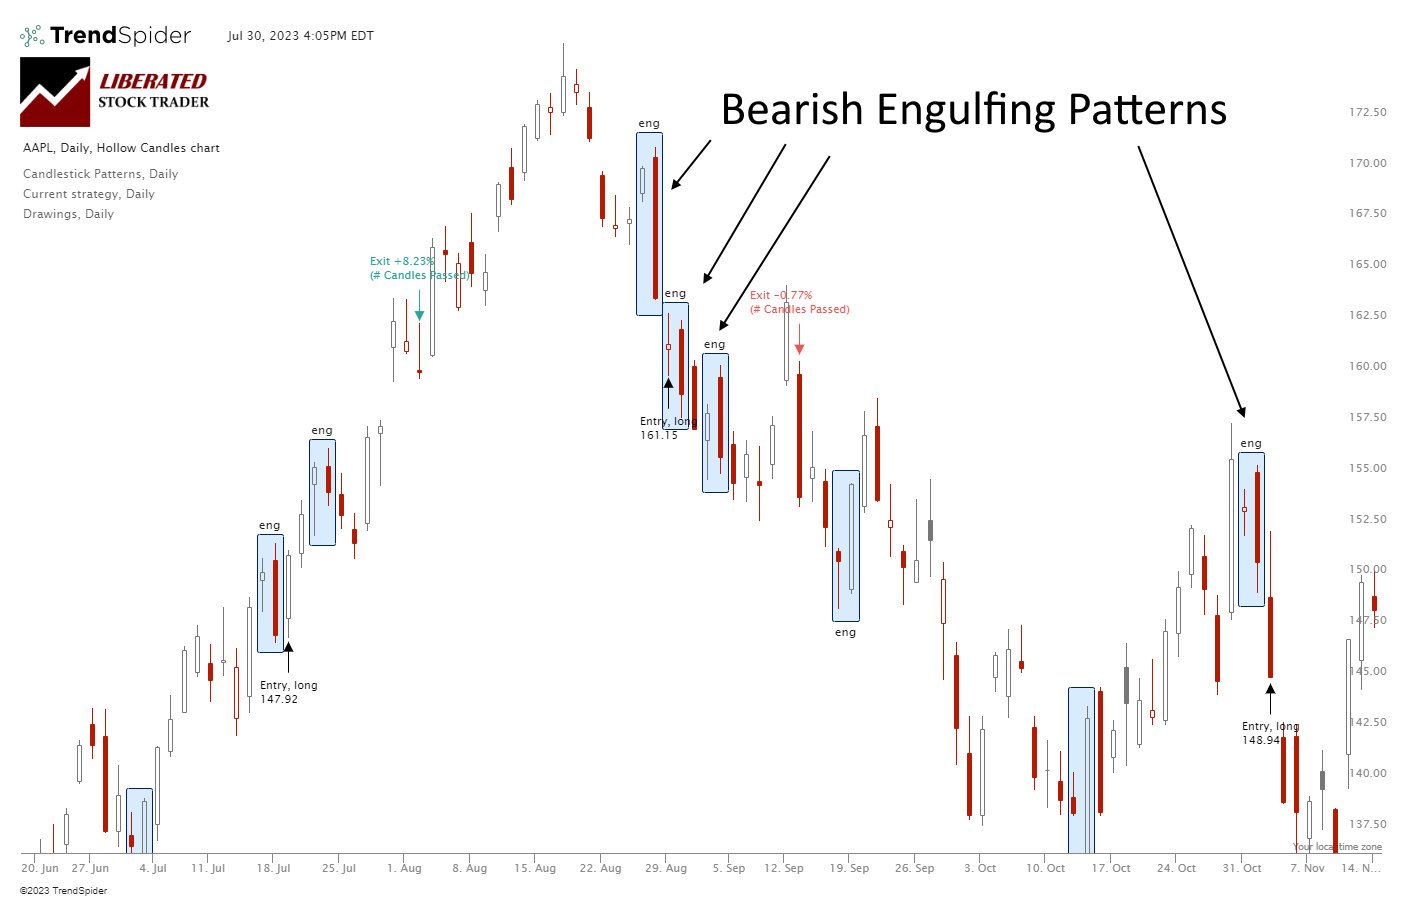
My research shows the Bearish Engulfing candle is an accurate and profitable pattern. Using 568 years of data, my testing revealed a 57% success rate and an average win of 3.7%.| Liberated Stock Trader
I believe the best ways to learn stock trading include books, audiobooks, data-backed analytical research, and reputable investing courses taught by industry-certified instructors.| Liberated Stock Trader
To create an algo trading system, you must choose a strategy, select a trading platform, choose the asset type, select the indicators and patterns, backtest, and refine the strategy.| Liberated Stock Trader
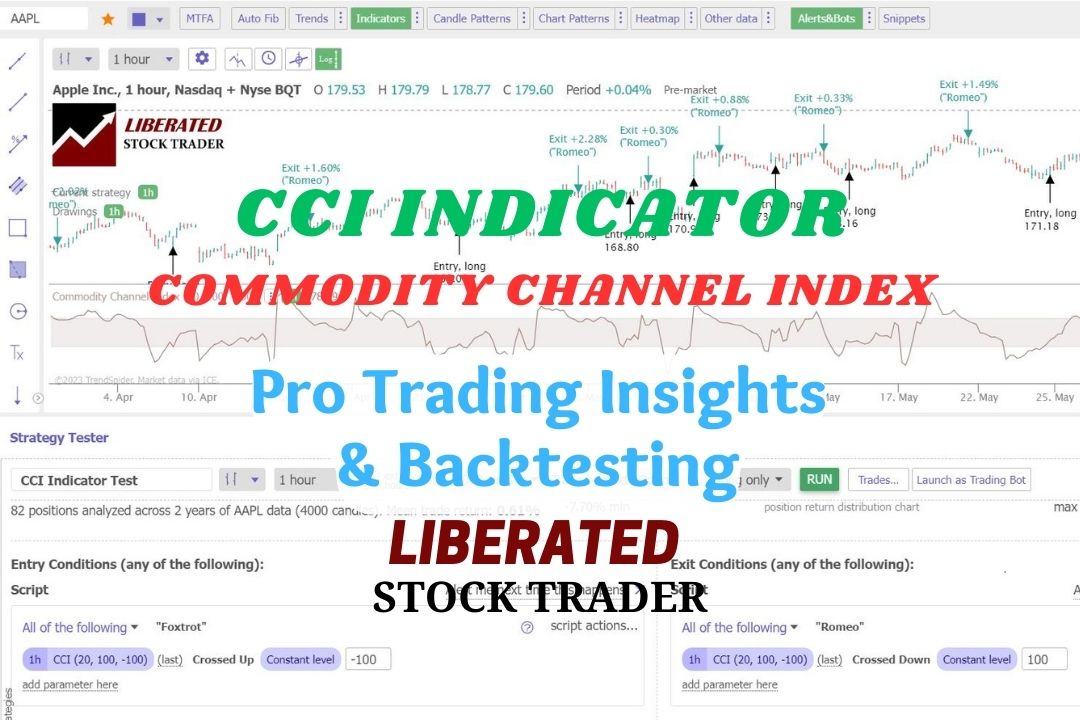
Our test data shows that using the CCI indicator with a 50 setting on the S&P 500 index stocks over 20 years was incredibly profitable, returning a 1,108% profit compared to the market, which returned 555%.| Liberated Stock Trader

The best moving average settings are SMA or EMA 20 on a daily chart, which achieves a 23% win rate. At settings 50, 100, and 200, it is better to use the Hull moving average, which has win rates of 27%, 10%, and 17%, respectively.| Liberated Stock Trader
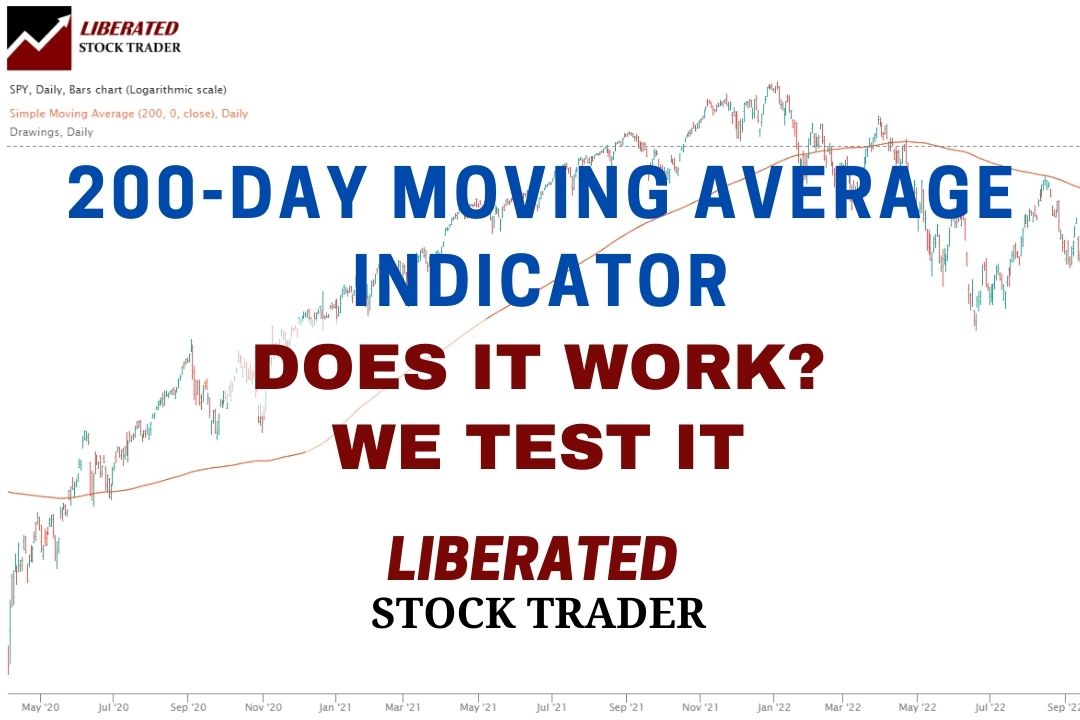
Our testing of the 200-day MA on the S&P500 over 16 years revealed that using this indicator is a losing proposition. A buy-and-hold strategy made a profit of 192% vs. the 200-day MA, which made only 152%.| Liberated Stock Trader
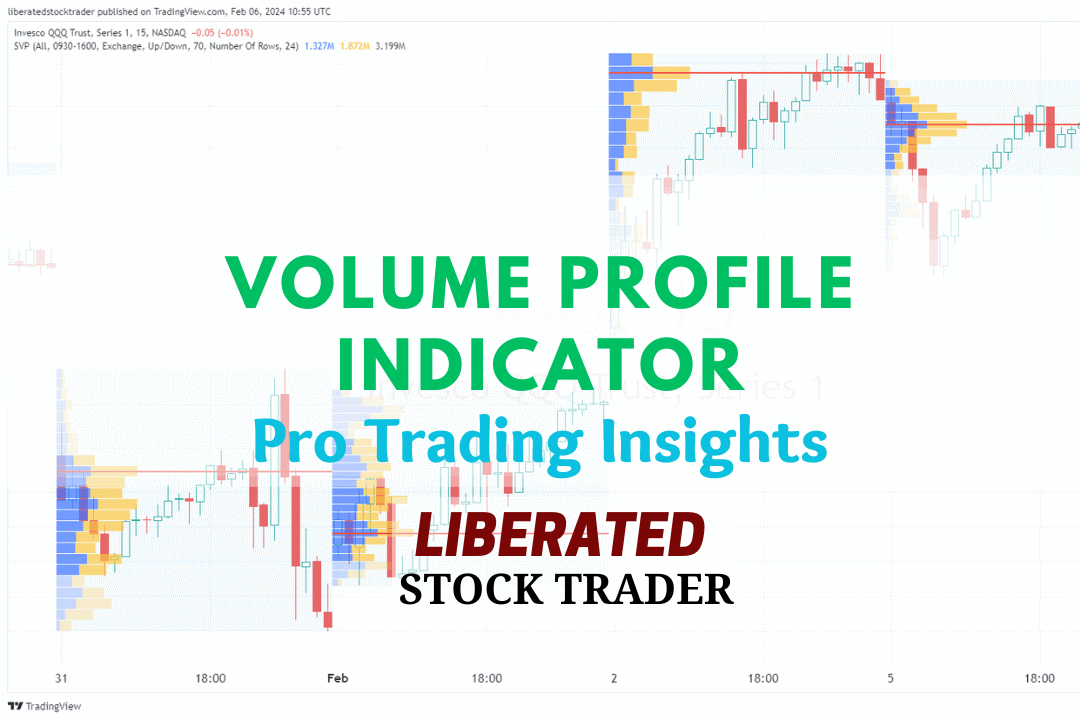
Volume profile technical analysis indicators provide a uniquely detailed overview of volume distribution across price levels, offering traders insights into market structure and supply and demand zones.| Liberated Stock Trader

Our research on 10,400 years of exchange data shows the best day trading indicators are the Price Rate of Change, VWAP, Weighted Moving Average, Hull Moving Average, Simple Moving Average, and RSI.| Liberated Stock Trader
The Hull Moving Average (HMA) is a highly responsive technical analysis indicator designed to reduce lag. Our research reveals it outperforms other moving averages.| Liberated Stock Trader
In technical analysis, momentum indicators help traders identify the strength and direction of a stock's price. We explain and test three popular momentum indicators for reliability.| Liberated Stock Trader
