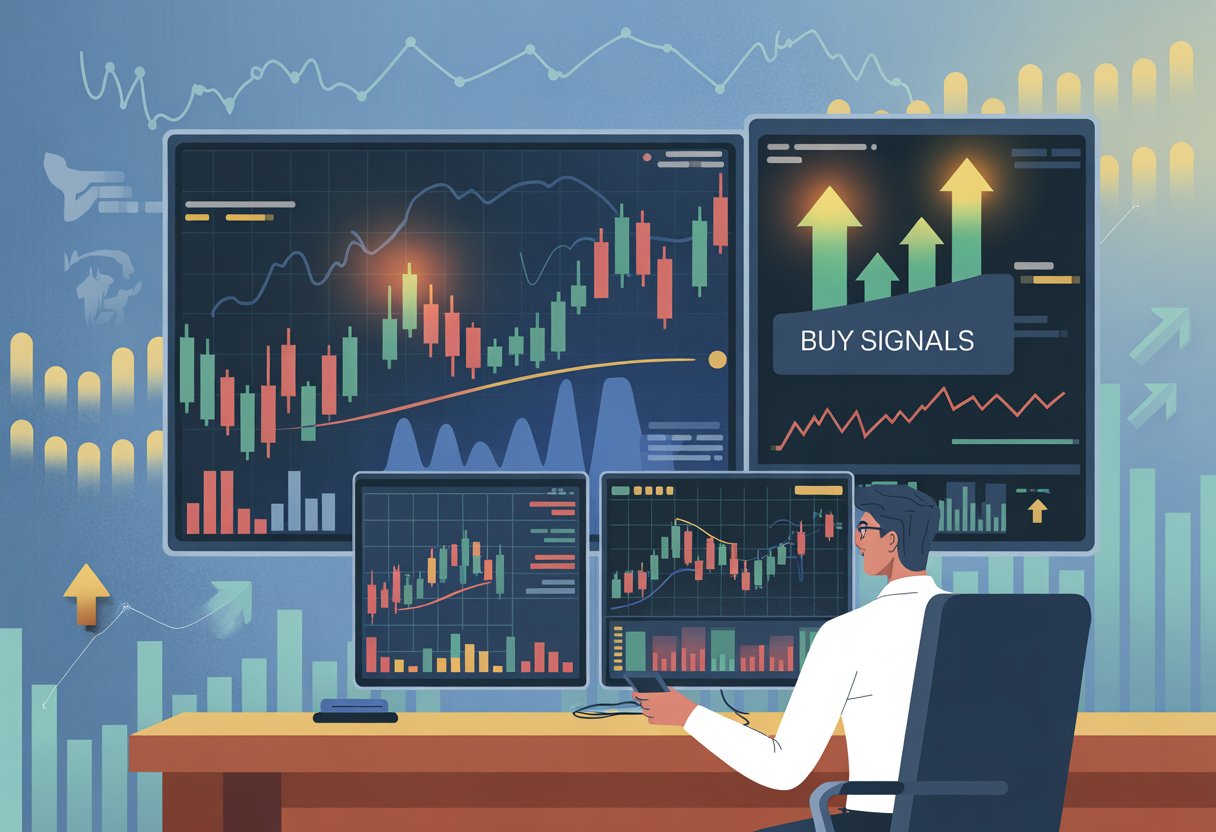
A buy signal is essentially an indicator or event that suggests it may be a good time to purchase a particular stock, whether based on technical data, chart patterns, or intrinsic value.| Liberated Stock Trader
TradingView's depth of features is the key difference versus TC2000. TC2000 offers powerful charts, scanning, and stock and options trading in the USA. But TradingView enables charting, screening, backtesting, and trading stocks, forex, futures, and crypto globally.| Liberated Stock Trader
Our ultimate guide to technical analysis, with its 14 videos and detailed examples covering charts, trends, indicators, patterns, and tools, will fast-track your knowledge.| Liberated Stock Trader
Ultimately, for 95% of speculators, day trading is not worth it. Although day traders can make significant money quickly, statistics show that most day traders lose money. Over a six-month period excessive commissions, poor trading decisions, weak strategies, and bad market timing cause losses.| Liberated Stock Trader
Renko charts filter out unnecessary price fluctuations to provide a clear stock price trend that traders can use in their investing strategies. Unlike a traditional bar or candlestick chart, Renko charts are based on price changes rather than time.| Liberated Stock Trader
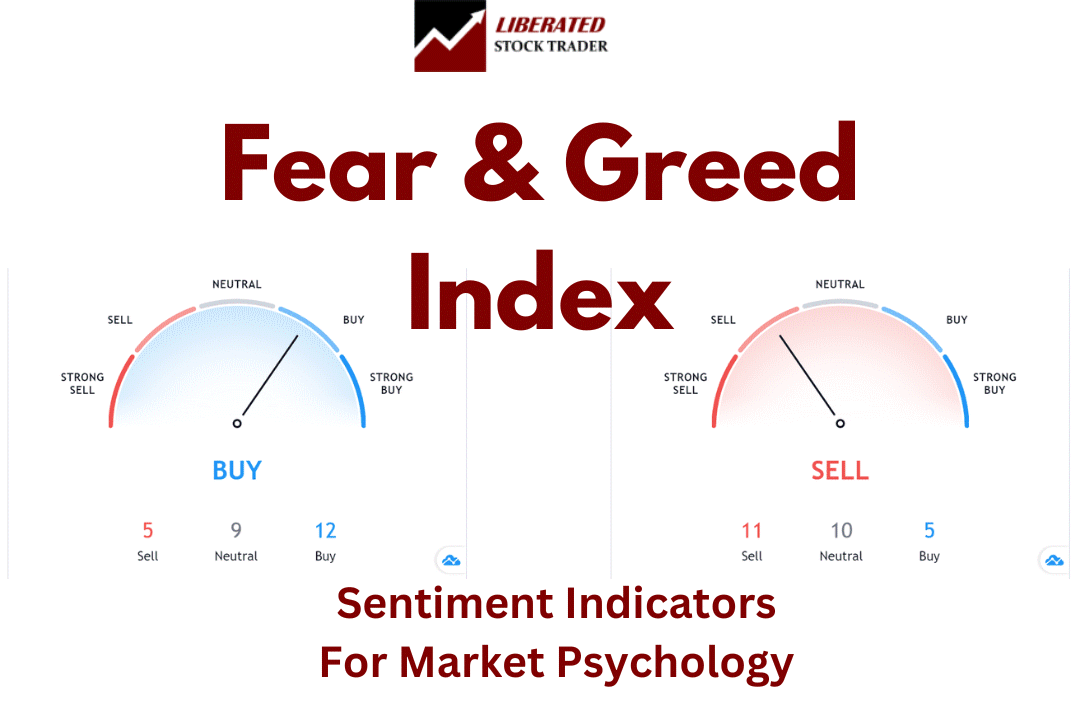
Our Fear and Greed Index goes beyond the basics, offering nine real-time and historical charts to help you stay ahead. With live data from the Federal Reserve, VIX CBOE, and 15 technical stock price signals, you'll have the tools to make smarter decisions today.| Liberated Stock Trader
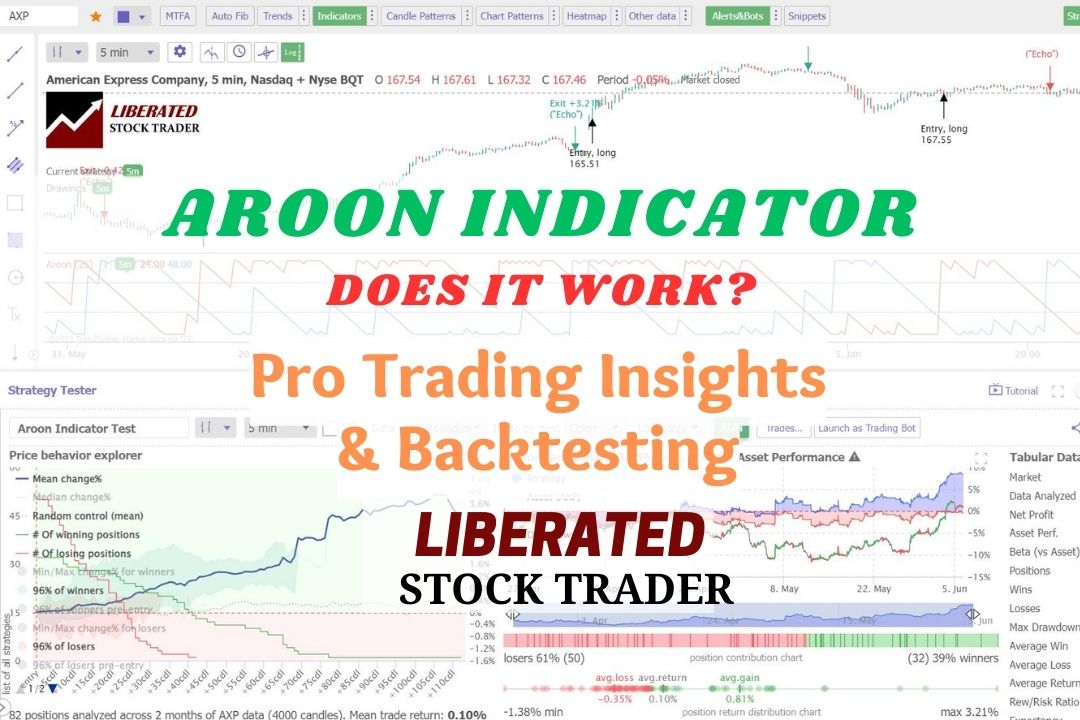
In technical analysis, the Aroon indicator identifies trend reversals and trend strength. This oscillating indicator has two parts: the "Aroon Up" line measures uptrend strength, and the "Aroon Down" line for downtrend strength.| Liberated Stock Trader
To create an algo trading system, you must choose a strategy, select a trading platform, choose the asset type, select the indicators and patterns, backtest, and refine the strategy.| Liberated Stock Trader
Professional analysts define all stock market trends using timeframe and direction: Timeframes are short-term, medium-term, and long-term. Direction is described using uptrend, downtrend, or consolidation.| Liberated Stock Trader
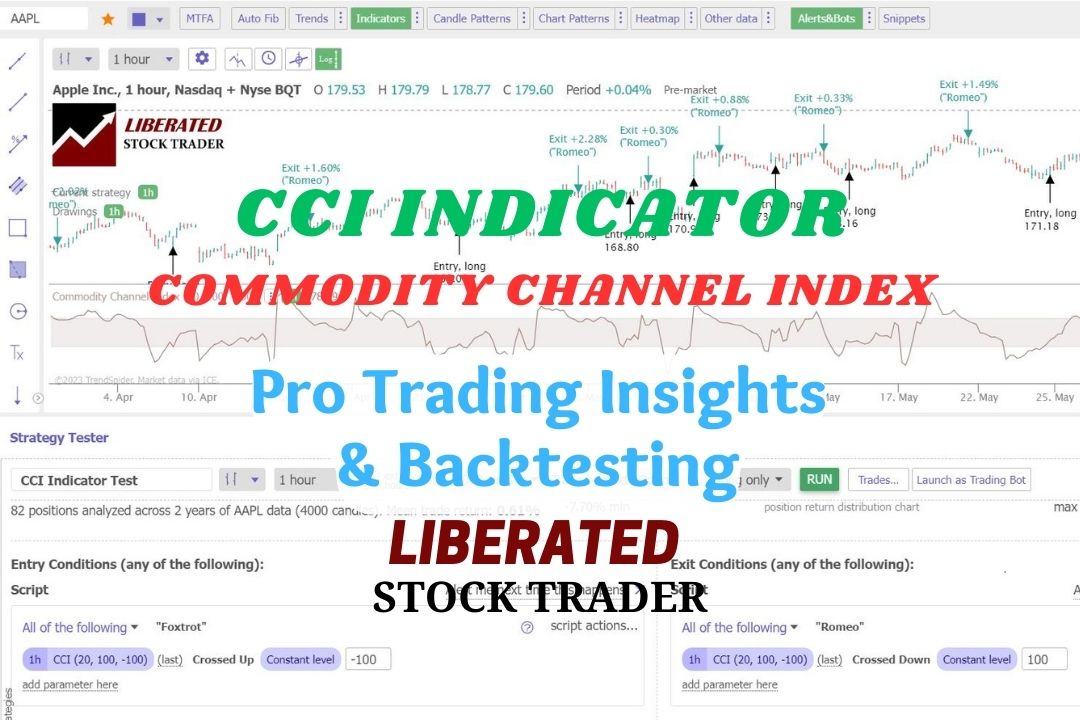
Our test data shows that using the CCI indicator with a 50 setting on the S&P 500 index stocks over 20 years was incredibly profitable, returning a 1,108% profit compared to the market, which returned 555%.| Liberated Stock Trader
Based on the market and business cycle theory, the next stock market correction will occur in 2027 (Kitchin Cycle) and 2031 (Juglar Cycle). The future crash will have two or more of the six systemic risks of inflation, rising interest rates, asset bubbles, financial mismanagement, political turmoil, or high unemployment.| Liberated Stock Trader
The best moving average settings are SMA or EMA 20 on a daily chart, which achieves a 23% win rate. At settings 50, 100, and 200, it is better to use the Hull moving average, which has win rates of 27%, 10%, and 17%, respectively.| Liberated Stock Trader
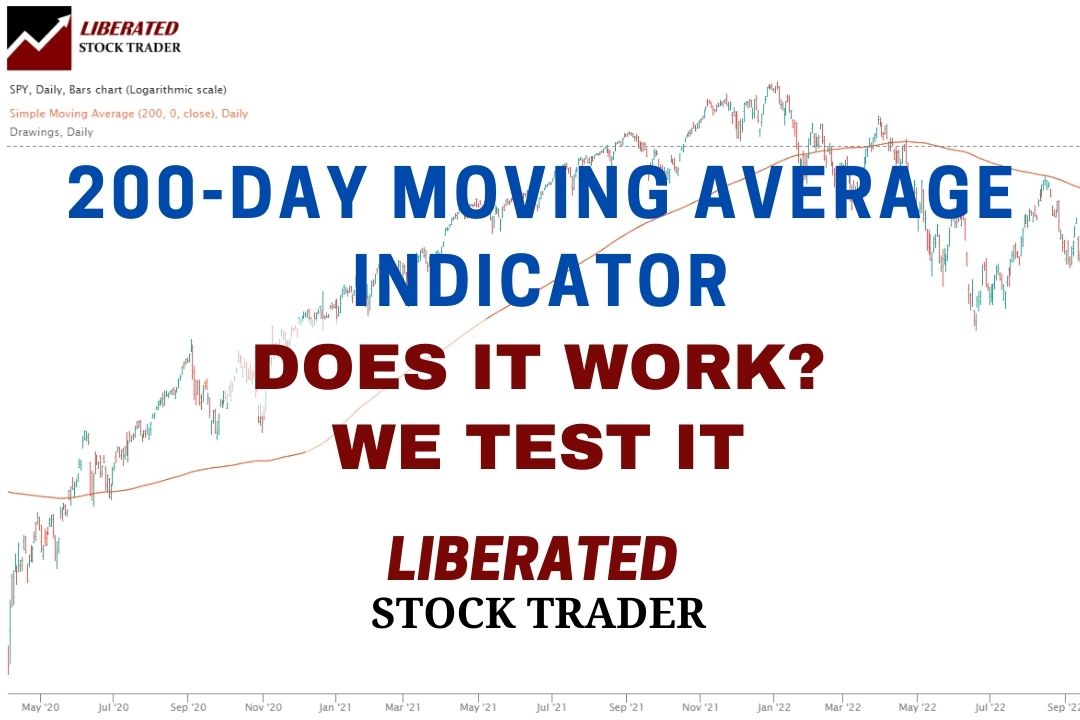
Our testing of the 200-day MA on the S&P500 over 16 years revealed that using this indicator is a losing proposition. A buy-and-hold strategy made a profit of 192% vs. the 200-day MA, which made only 152%.| Liberated Stock Trader
Our research on 10,400 years of exchange data shows the best day trading indicators are the Price Rate of Change, VWAP, Weighted Moving Average, Hull Moving Average, Simple Moving Average, and RSI.| Liberated Stock Trader
The Hull Moving Average (HMA) is a highly responsive technical analysis indicator designed to reduce lag. Our research reveals it outperforms other moving averages.| Liberated Stock Trader