Sell Signals In Stock Trading: How I Identify, Evaluate, and Act
A sell signal gives traders a heads-up on when to consider closing positions, helping them lock in gains or cut losses using actual triggers, not just hunches.| Liberated Stock Trader
A sell signal gives traders a heads-up on when to consider closing positions, helping them lock in gains or cut losses using actual triggers, not just hunches.| Liberated Stock Trader

Price action trading is a method of day trading that relies on technical analysis but ignores conventional fundamental indicators, focusing instead on the movement of prices.| Liberated Stock Trader
Swing Trading and Day Trading differ in the timeframe, strategy, tools, and leverage. Day traders trade intraday using leverage; swing traders hold positions for days or weeks. Swing traders use real-time news, patterns, and indicators to make decisions, whereas day traders typically look for volatility to enable price scalping.| Liberated Stock Trader
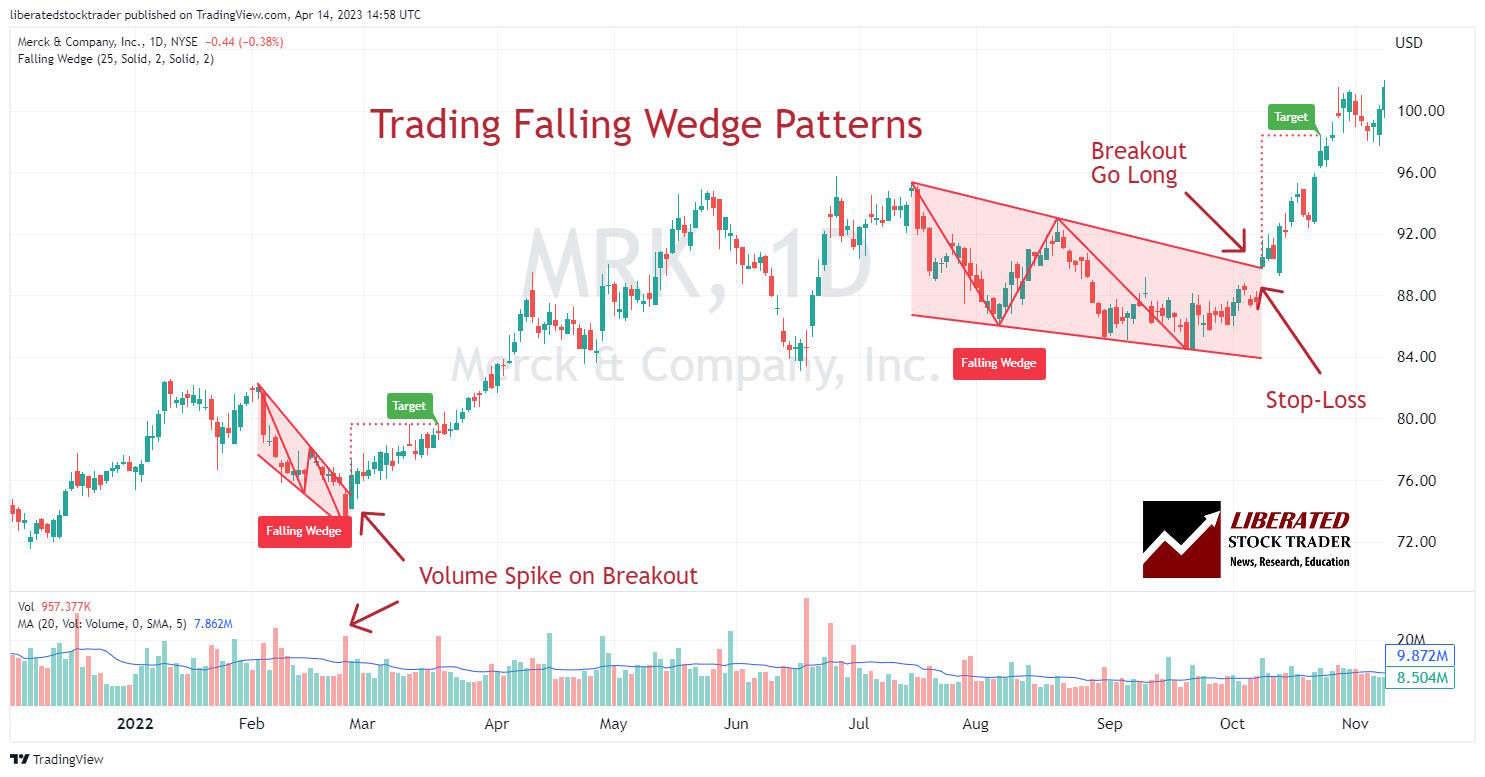
According to published research, the falling wedge pattern has a 74% success rate in bull markets with an average potential profit of +38%.| Liberated Stock Trader
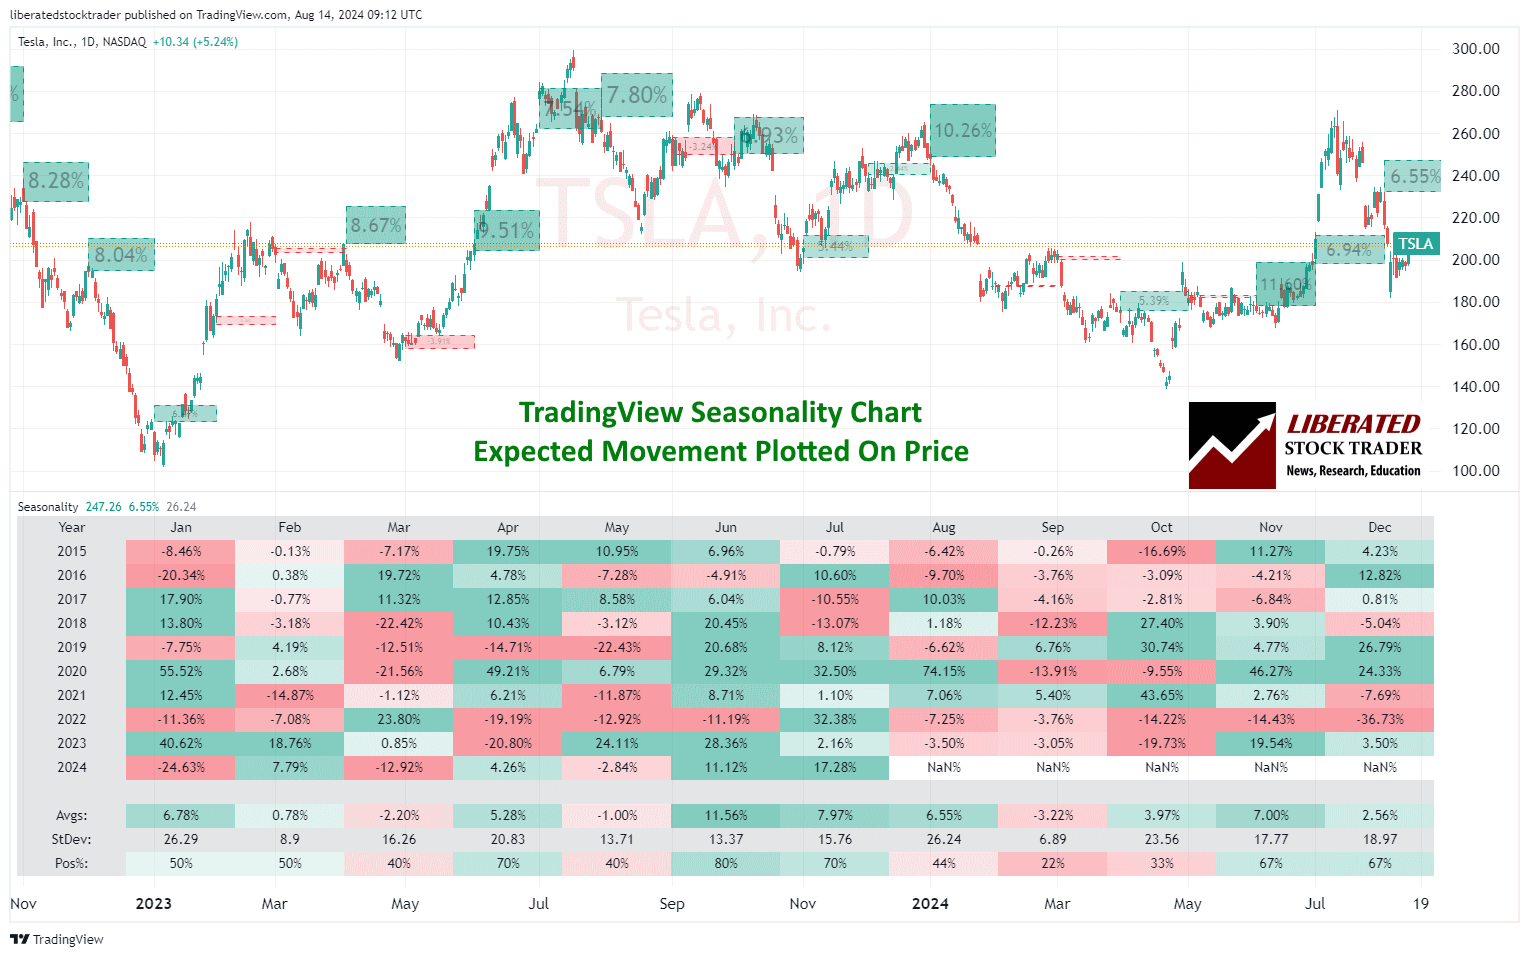
Seasonality charts provide predictable patterns that stocks follow during specific days, weeks, and months of the year. These trends are influenced by recurring events or cycles.| Liberated Stock Trader
Data-driven research, education, and insights for independent investors. We test charts, patterns, indicators, and develop unique growth, dividend, and value investing strategies.| Liberated Stock Trader
Yes, you can buy and sell the same stock on the same day four times weekly in the USA. If you day trade more often, you must follow the FINRA rules on Pattern Day Trading (PDT), which means being a registered day trader and having a $25K minimum account balance.| Liberated Stock Trader
My reliability testing of Bollinger Bands on the S&P 500, using 13,360 years of data, suggests it is an unprofitable indicator for traders. However, Bollinger Bands can be highly profitable, with the optimal settings.| Liberated Stock Trader
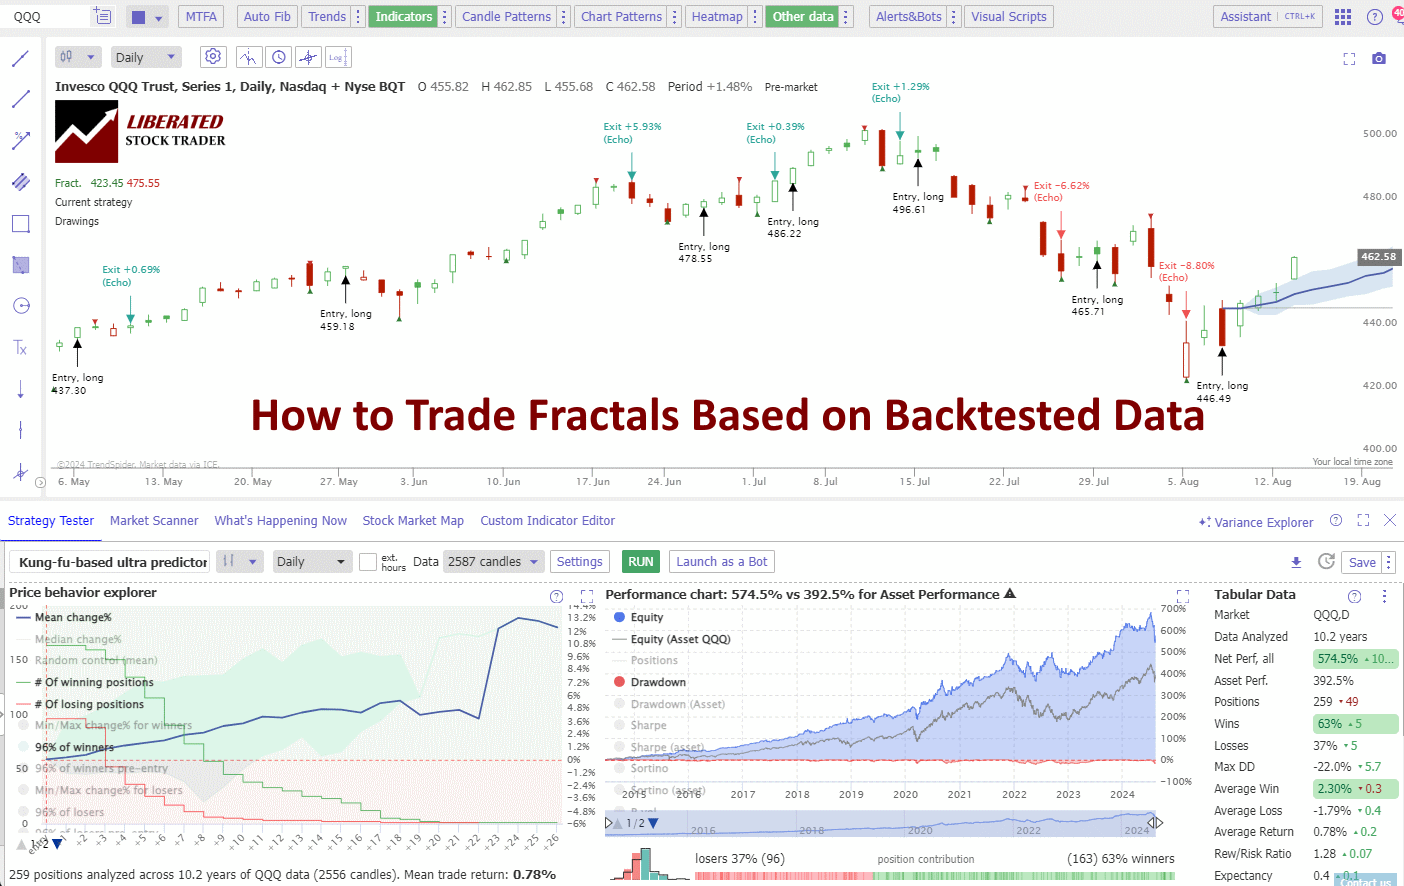
Based on 2,510 tested trades on 80 years of exchange data, I can confirm trading fractal patterns is profitable, with an average reward-to-risk ratio rate of 1.5 across all timescales.| Liberated Stock Trader
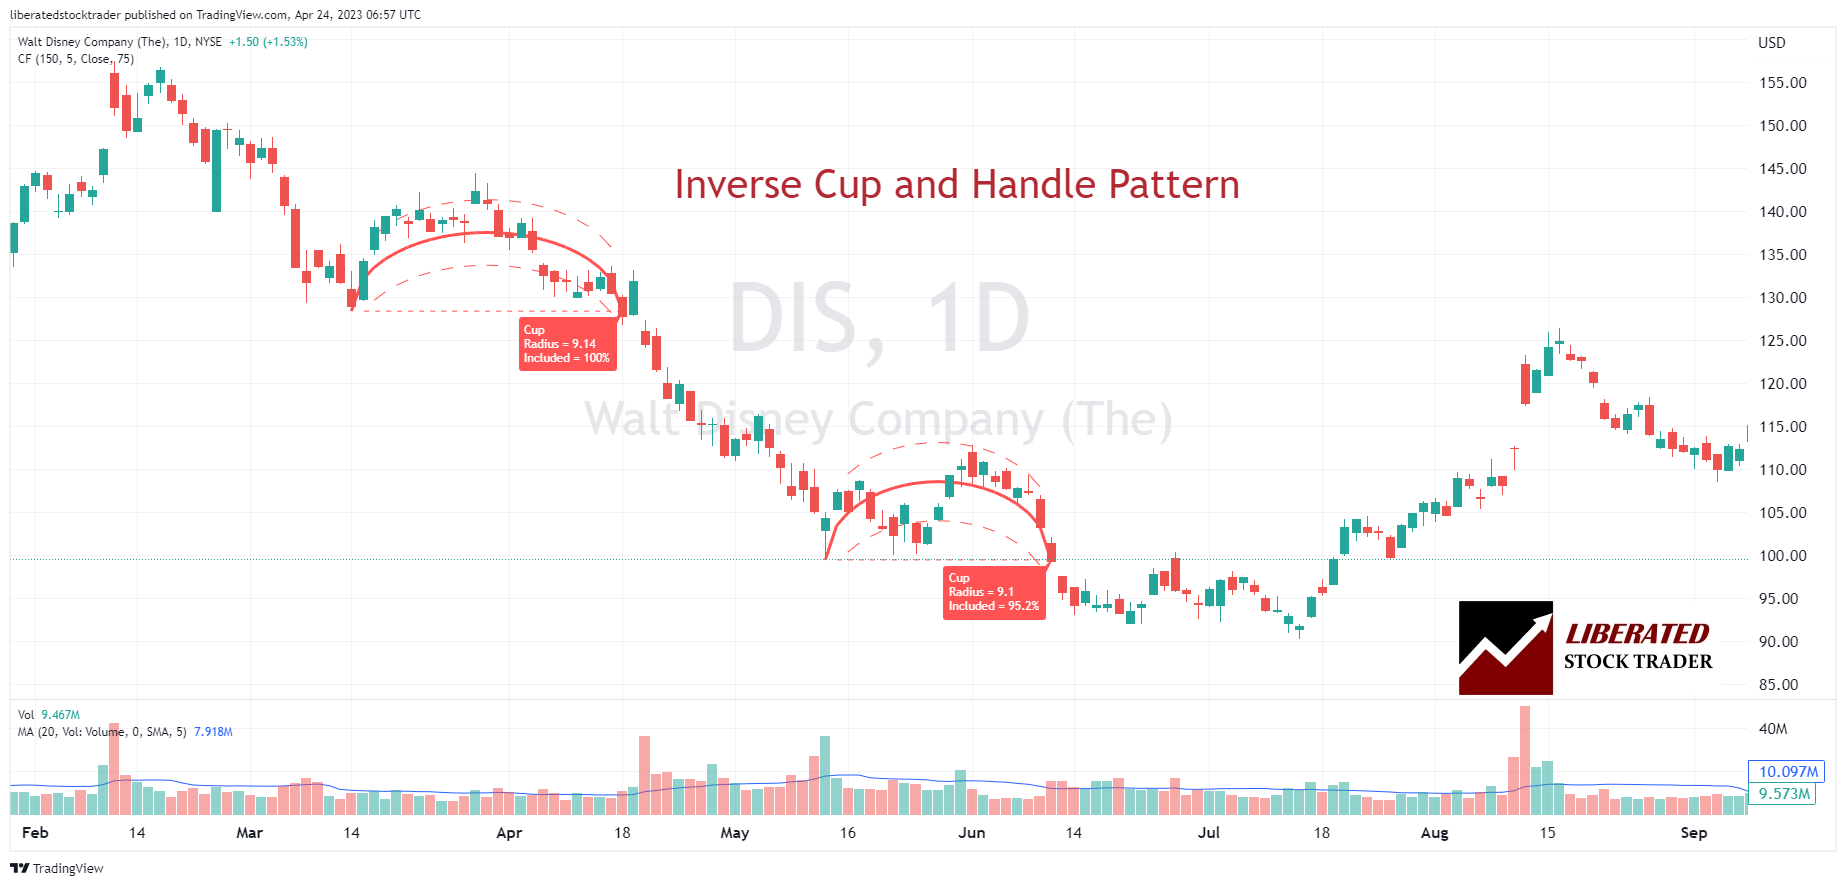
Two decades of trading research indicate that the inverse cup and handle pattern has an 82% success rate and average price drops of 17%. It is an ideal pattern for short-selling.| Liberated Stock Trader

Be careful when trading bearish flags. According to published research, the bear flag pattern has a low success rate of 45%. This means you are flipping a coin when trading this pattern, as the odds are not in your favor. The high-tight bear flag is the only flag pattern you should trade.| Liberated Stock Trader

Ultimately, for 95% of speculators, day trading is not worth it. Although day traders can make significant money quickly, statistics show that most day traders lose money. Over a six-month period excessive commissions, poor trading decisions, weak strategies, and bad market timing cause losses.| Liberated Stock Trader
Decades of research have proven the most predictable bearish chart patterns are the inverted cup-and-handle, with an average price decrease of 17%, the rectangle top (-16%), head-and-shoulders (-16%), and the descending triangle (-15%).| Liberated Stock Trader
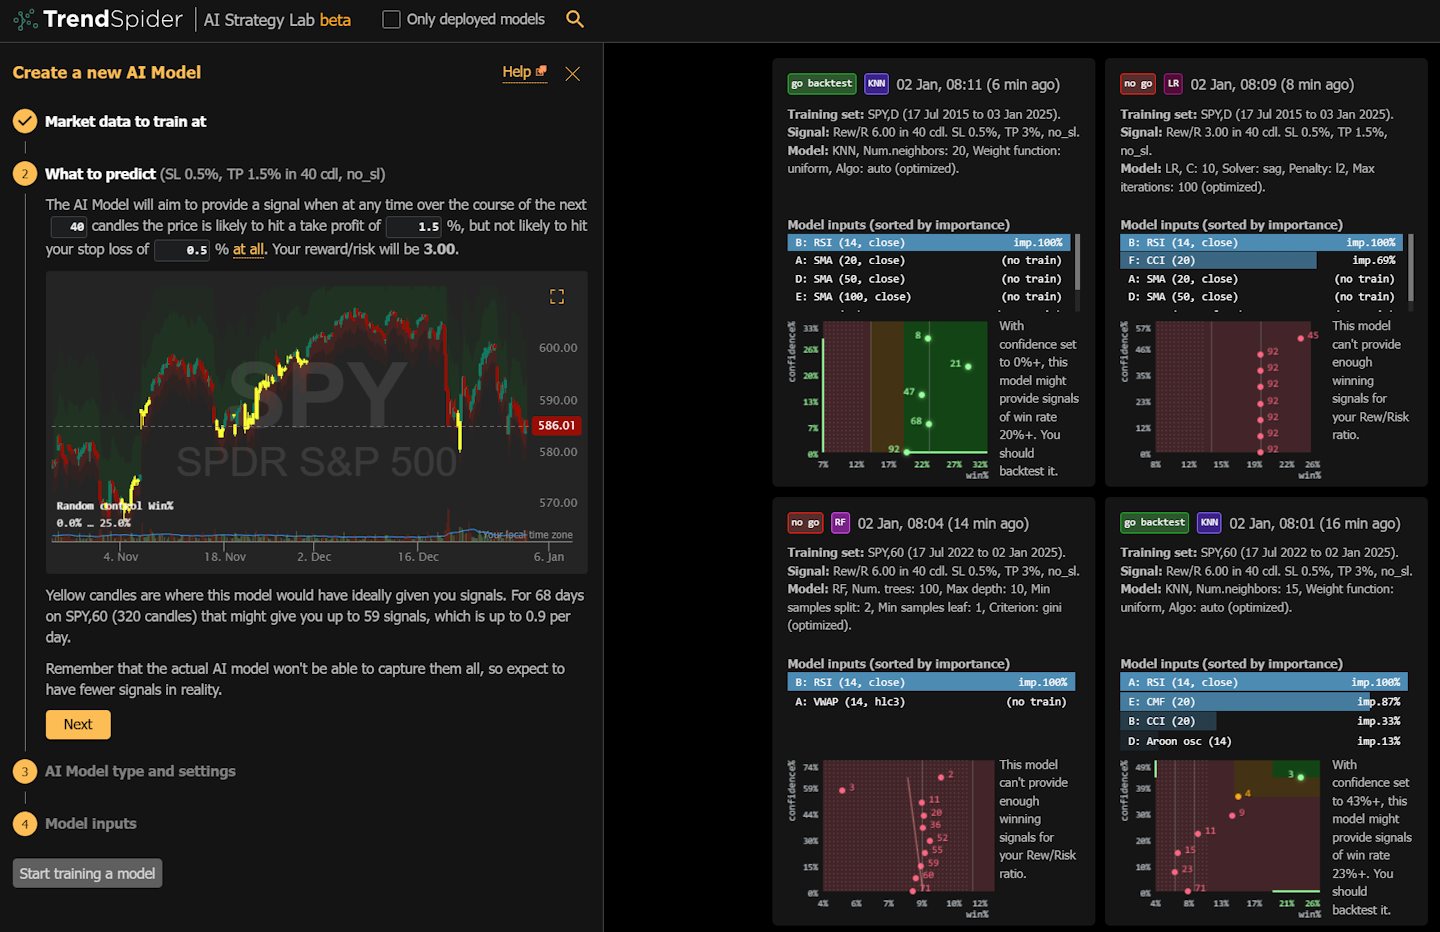
While platforms like TradingView and Trade Ideas offer many algorithms, only TrendSpider lets you fully train your own models. It’s a game-changer for traders looking to create unique strategies!| Liberated Stock Trader
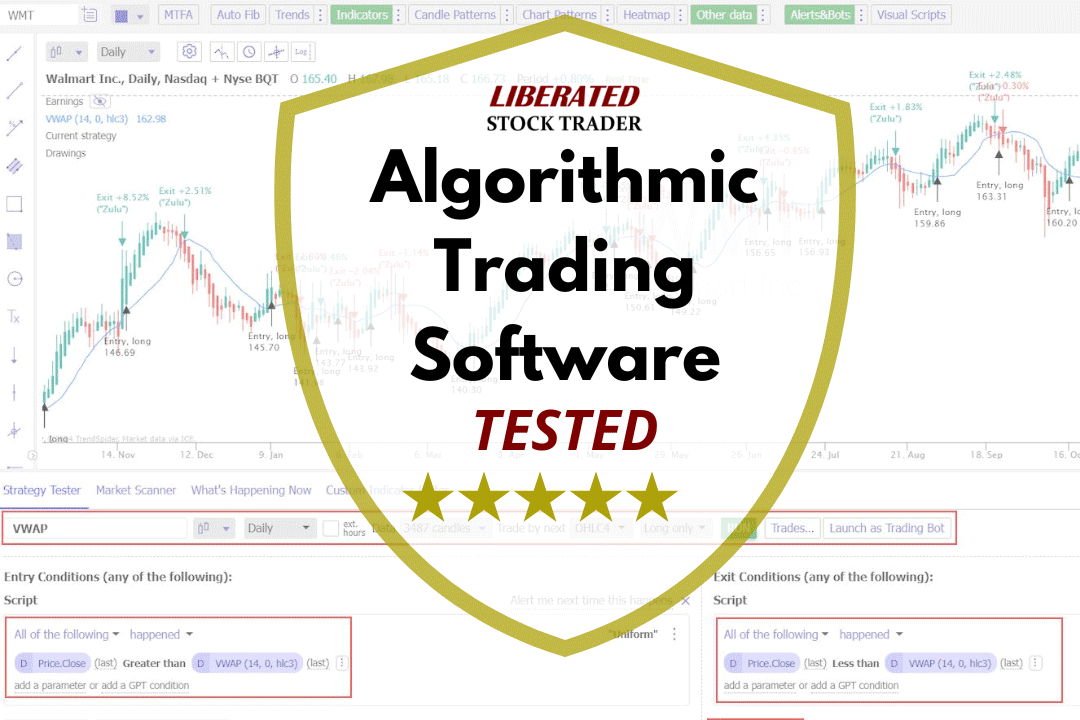
My testing shows that TrendSpider, Trade Ideas, TradingView, and Tickeron are the most effective software for creating, testing, and executing trading algorithms.| Liberated Stock Trader
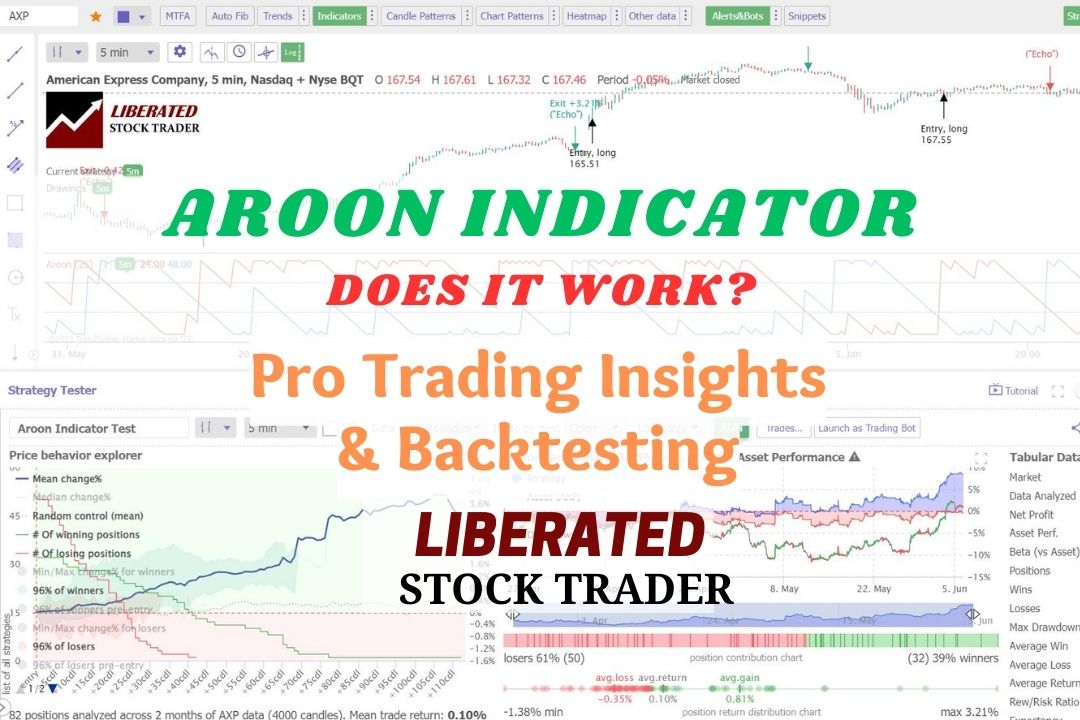
In technical analysis, the Aroon indicator identifies trend reversals and trend strength. This oscillating indicator has two parts: the "Aroon Up" line measures uptrend strength, and the "Aroon Down" line for downtrend strength.| Liberated Stock Trader

There are two types of continuation patterns: bullish and bearish. Bullish continuation patterns occur when the market is trending upwards, while bearish continuation patterns happen when the market is trending downwards.| Liberated Stock Trader
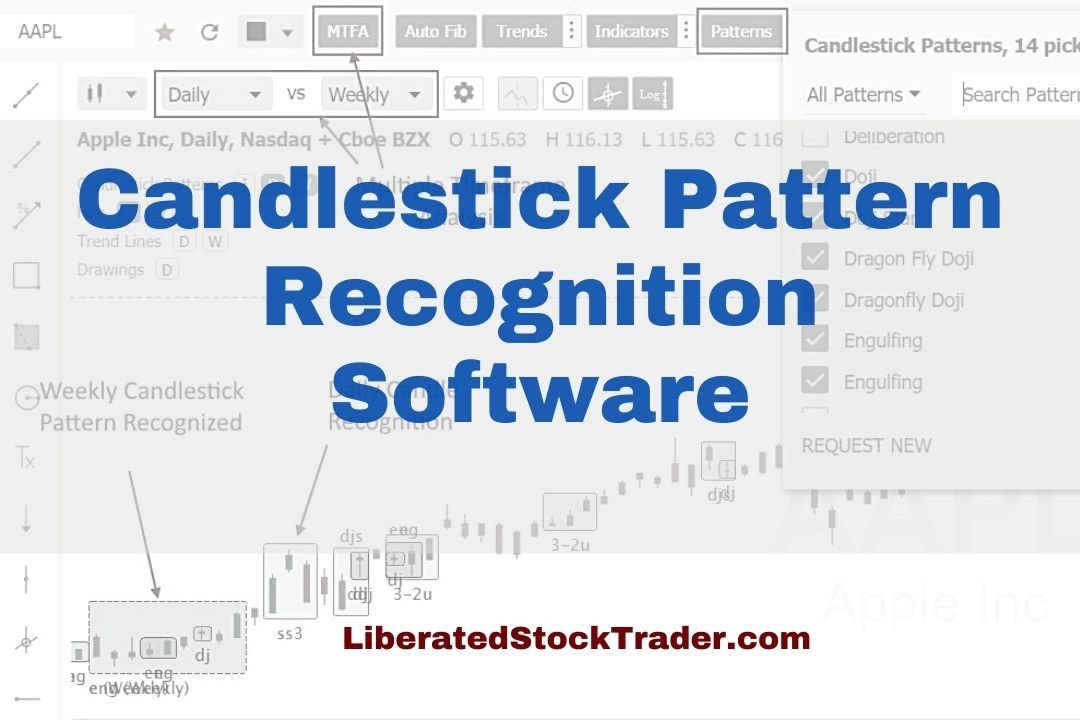
Testing reveals the best stock chart candlestick pattern recognition software is TrendSpider, TradingView, MetaStock, and Finviz.| Liberated Stock Trader
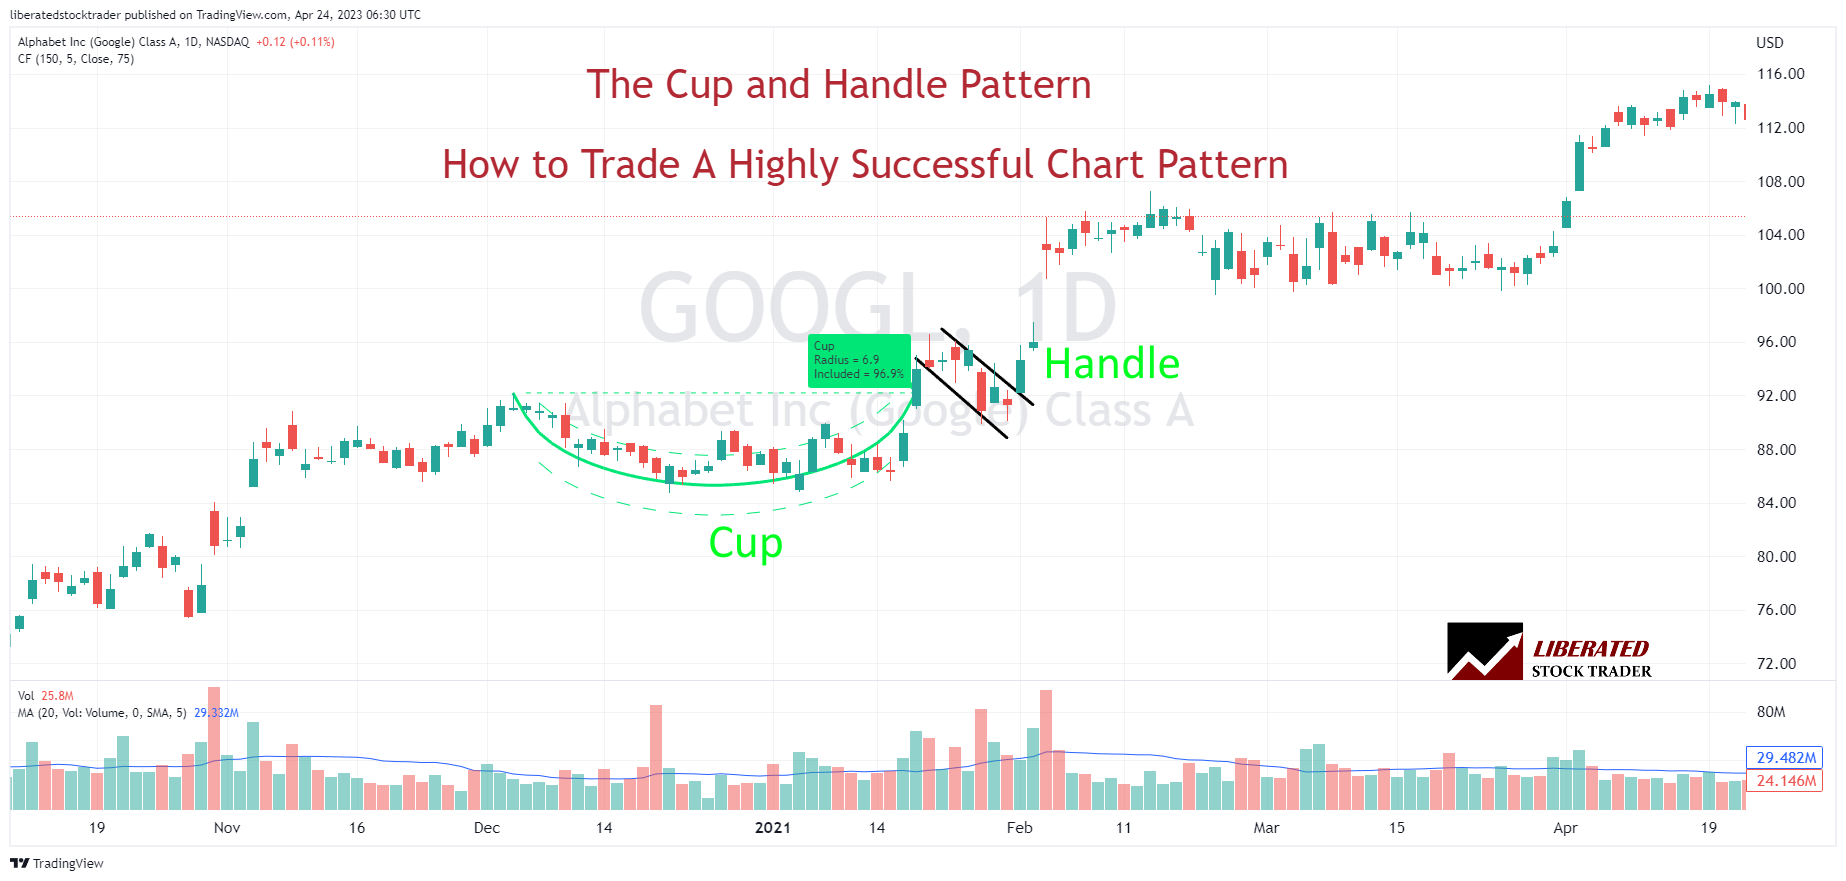
Twenty years of trading research show that the cup and handle pattern has a 95% success rate in bull markets and returns an average profit of +54%.| Liberated Stock Trader
