Price action trading is a method of day trading that relies on technical analysis but ignores conventional fundamental indicators, focusing instead on the movement of prices.| Liberated Stock Trader
Swing Trading and Day Trading differ in the timeframe, strategy, tools, and leverage. Day traders trade intraday using leverage; swing traders hold positions for days or weeks. Swing traders use real-time news, patterns, and indicators to make decisions, whereas day traders typically look for volatility to enable price scalping.| Liberated Stock Trader
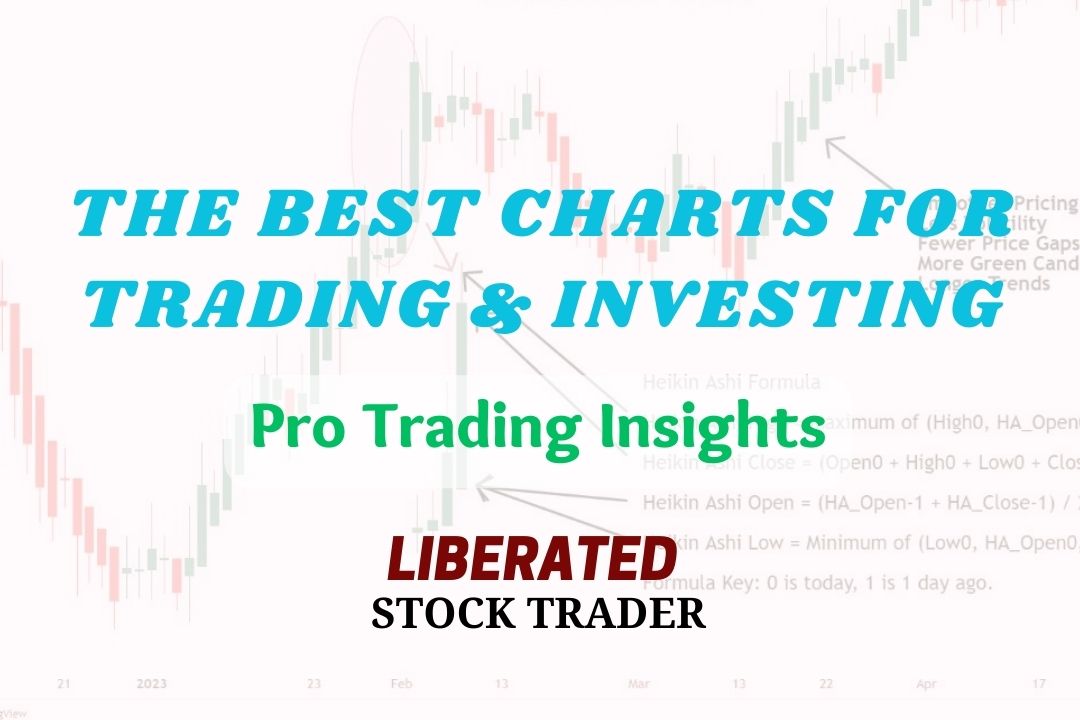
My research indicates that the most effective chart types for traders are Heikin-Ashi, Candlestick, OHLC, Raindrop, and Renko charts. These charts provide the optimal balance of price and trend reversal information to help investors develop effective trading strategies.| Liberated Stock Trader
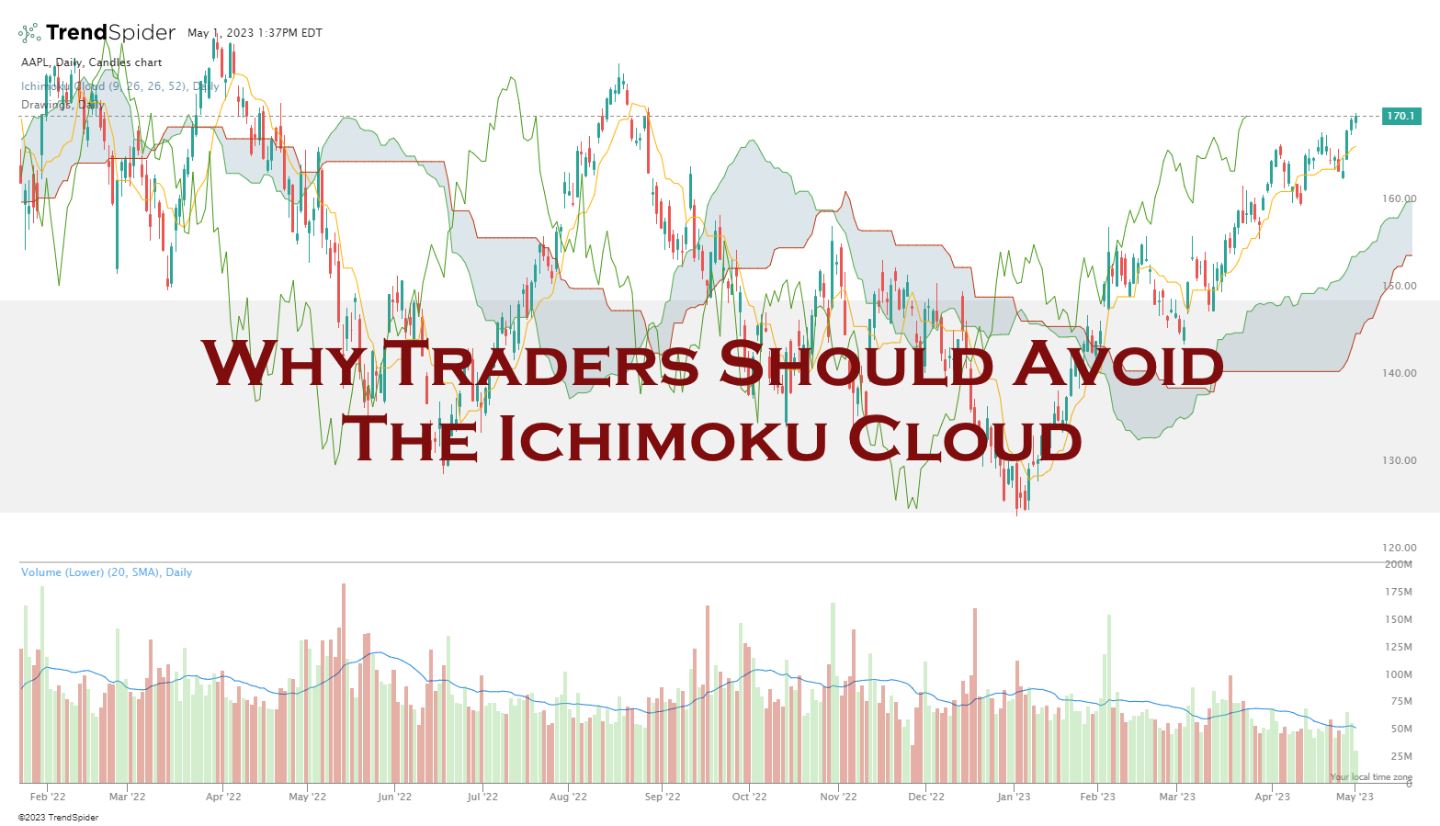
The Ichimoku test results are a dismal 10% win rate, underperforming a buy-and-hold strategy 90% of the time. The Ichimoku indicator is a poor choice for traders.| Liberated Stock Trader
Based on our extensive testing, it has been determined that when used as a standalone indicator, Supertrend does not demonstrate reliability or profitability. With an average profit expectancy of 0.24, it is recommended to combine Supertrend with other indicators.| Liberated Stock Trader
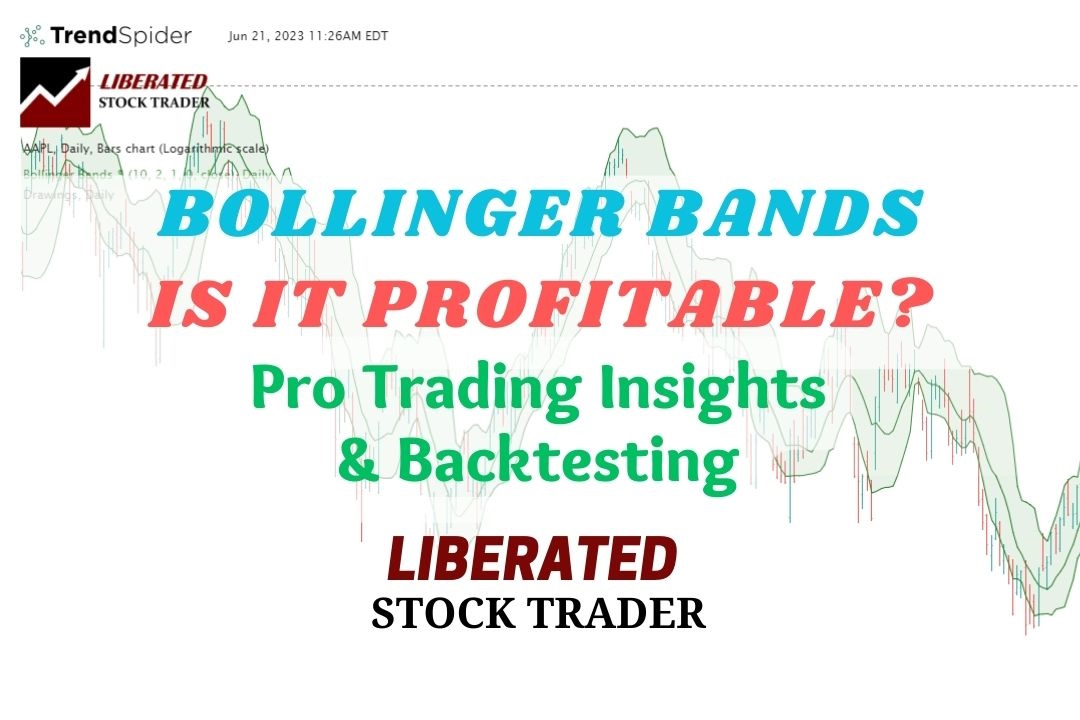
My reliability testing of Bollinger Bands on the S&P 500, using 13,360 years of data, suggests it is an unprofitable indicator for traders. However, Bollinger Bands can be highly profitable, with the optimal settings.| Liberated Stock Trader
Using VWAP with a 14 setting on a daily Heikin Ashi chart is vastly superior to conventional OHLC charts. Using an OHLC chart, the strategy barely breaks even with a low-profit expectancy of 0.15. In contrast with a Heikin Ashi chart, the strategy is incredibly profitable, with a profit expectance of 0.83 and a reward-to-risk ratio of 3.03.| Liberated Stock Trader
In technical analysis, Fibonacci retracement is used by traders to predict levels of support and resistance by drawing horizontal lines according to the Fibonacci sequence. But Does It Work?| Liberated Stock Trader
Ultimately, for 95% of speculators, day trading is not worth it. Although day traders can make significant money quickly, statistics show that most day traders lose money. Over a six-month period excessive commissions, poor trading decisions, weak strategies, and bad market timing cause losses.| Liberated Stock Trader
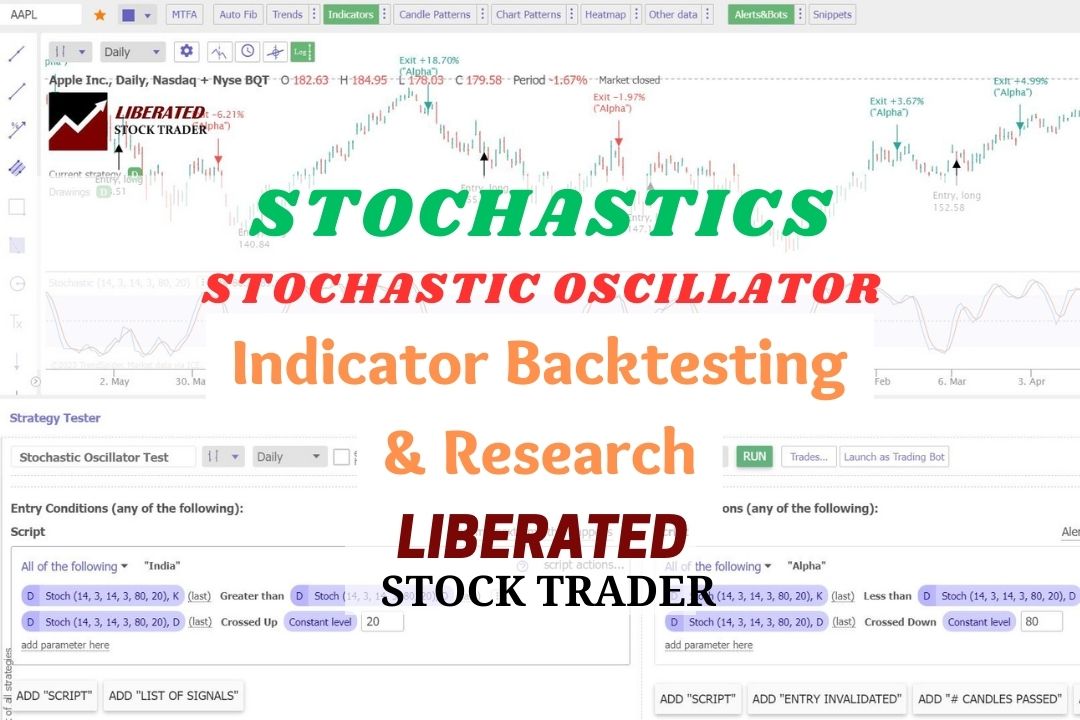
The Stochastic Oscillator momentum indicator compares an asset's closing price to a range of its previous prices. It oscillates between 0 and 100; below 20 indicates oversold, and above 80 suggests an overbought market.| Liberated Stock Trader
An exponential moving average (EMA) technical indicator reduces the lag associated with simple moving averages (SMA) by applying a multiplier to the most recent data. EMAs provide improved sensitivity, enhancing the accuracy of trend analysis.| Liberated Stock Trader
According to testing, the top day trading software is TrendSpider's backtesting, scanning, and trading bots, and Trade Ideas with AI automated trading signals, and free stock trades.| Liberated Stock Trader
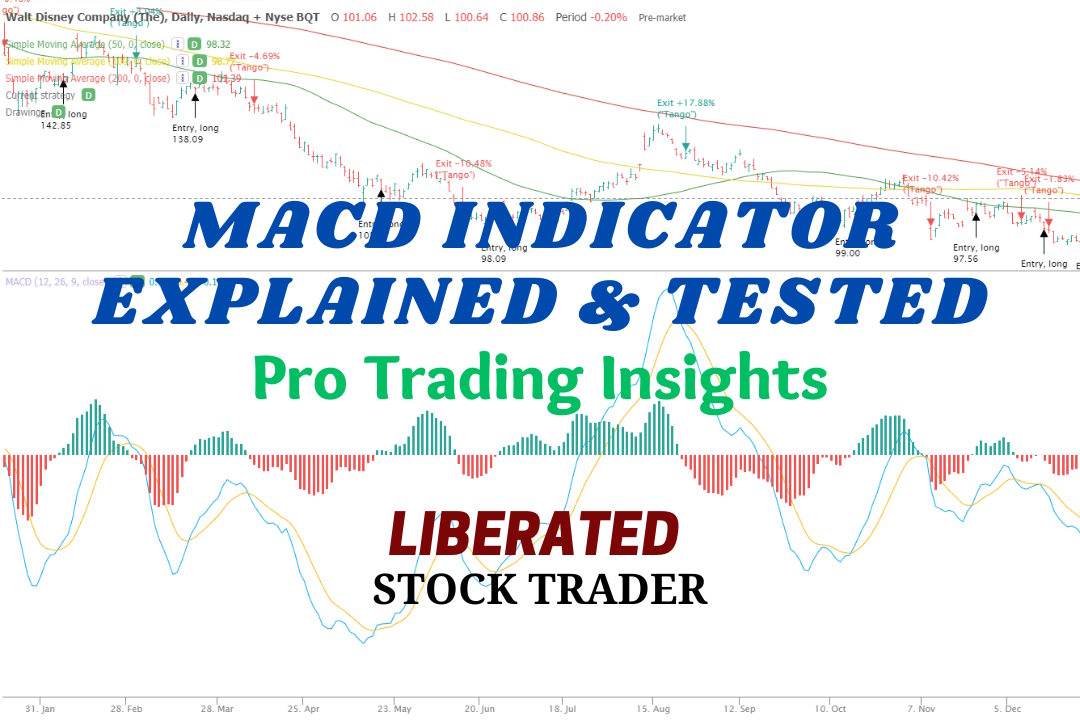
MACD is a trend-following momentum indicator used to identify price trends. We conducted 606,422 test trades to find the best settings and trading strategies.| Liberated Stock Trader
Day and swing trading uses technical chart analysis to trade short-term price moves, whereas growth and value investing use long-term fundamental financial analysis. The tools and strategies used for these types of trading are completely different.| Liberated Stock Trader
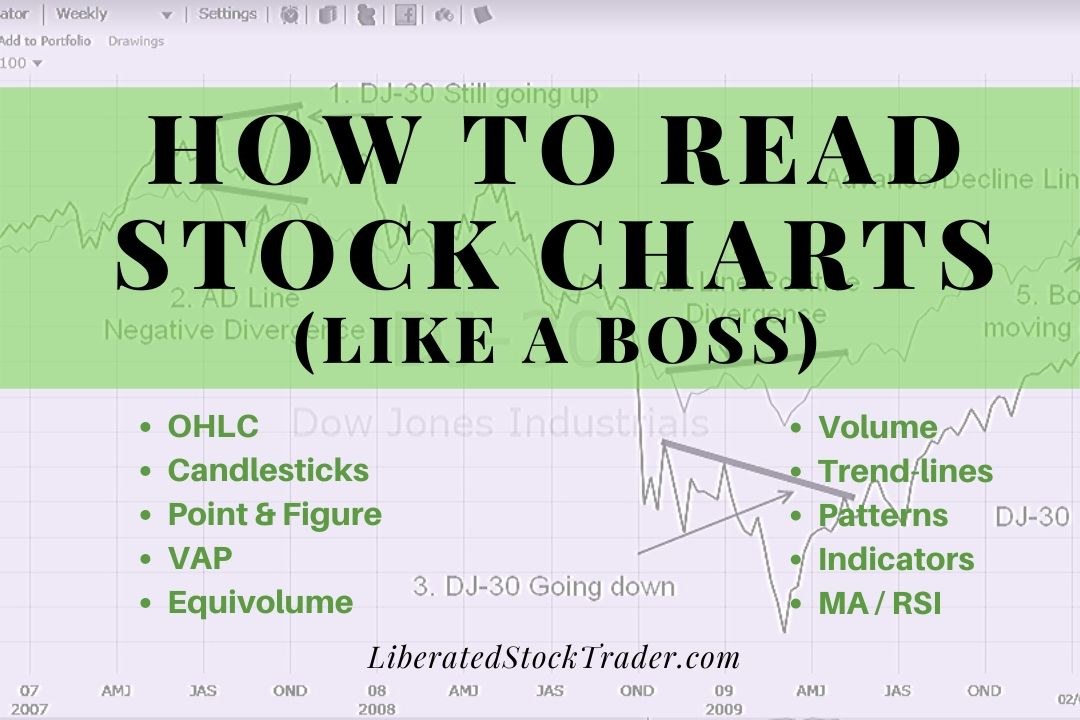
To read stock charts you need to use stock charting software, select your chart type, configure your timeframe, determine price direction using trendlines and use indicators to estimate future prices.| Liberated Stock Trader
To create an algo trading system, you must choose a strategy, select a trading platform, choose the asset type, select the indicators and patterns, backtest, and refine the strategy.| Liberated Stock Trader
The simple moving average (SMA) technical analysis indicator helps identify stock price trends. It calculates an arithmetic average of prices, offering a smooth line that eliminates short-term price volatility.| Liberated Stock Trader
The Relative Strength Index (RSI) is an oscillating momentum indicator that measures the speed and change of stock price movements. RSI uses a scale from 0 to 100 to indicate overbought or oversold conditions.| Liberated Stock Trader
The Rate of Change (ROC) is a momentum indicator that measures the speed and direction of asset price movements. It helps traders determine whether a security is trending and how quickly its price changes.| Liberated Stock Trader
My 2025 testing awards TradingView 4.8 stars due to its continued innovation in chart analysis, pattern recognition, screening, and backtesting. TradingView is my top recommendation for US and international traders.| Liberated Stock Trader
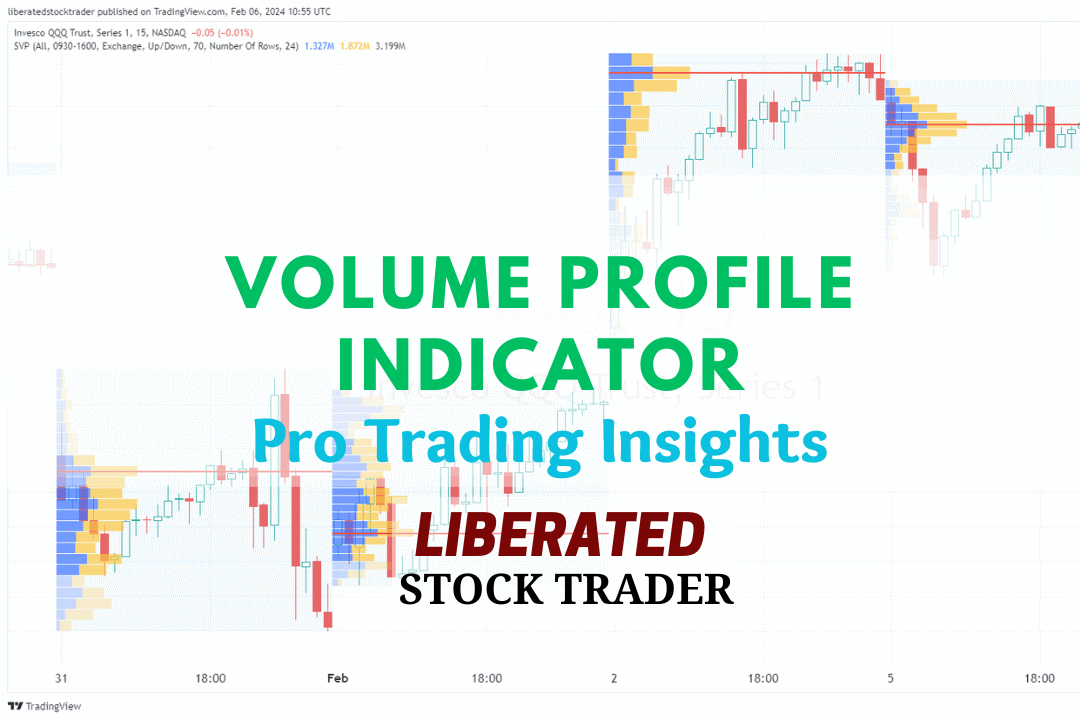
Volume profile technical analysis indicators provide a uniquely detailed overview of volume distribution across price levels, offering traders insights into market structure and supply and demand zones.| Liberated Stock Trader
Our research on 10,400 years of exchange data shows the best day trading indicators are the Price Rate of Change, VWAP, Weighted Moving Average, Hull Moving Average, Simple Moving Average, and RSI.| Liberated Stock Trader
The Hull Moving Average (HMA) is a highly responsive technical analysis indicator designed to reduce lag. Our research reveals it outperforms other moving averages.| Liberated Stock Trader