
Our Wall Street Cheat Sheet Helps Master Market Sentiment
Our free interactive Wall Street Cheat Sheet helps you get ahead of the game by navigating the emotional highs and lows that investors face during market cycles.| Liberated Stock Trader
Our free interactive Wall Street Cheat Sheet helps you get ahead of the game by navigating the emotional highs and lows that investors face during market cycles.| Liberated Stock Trader
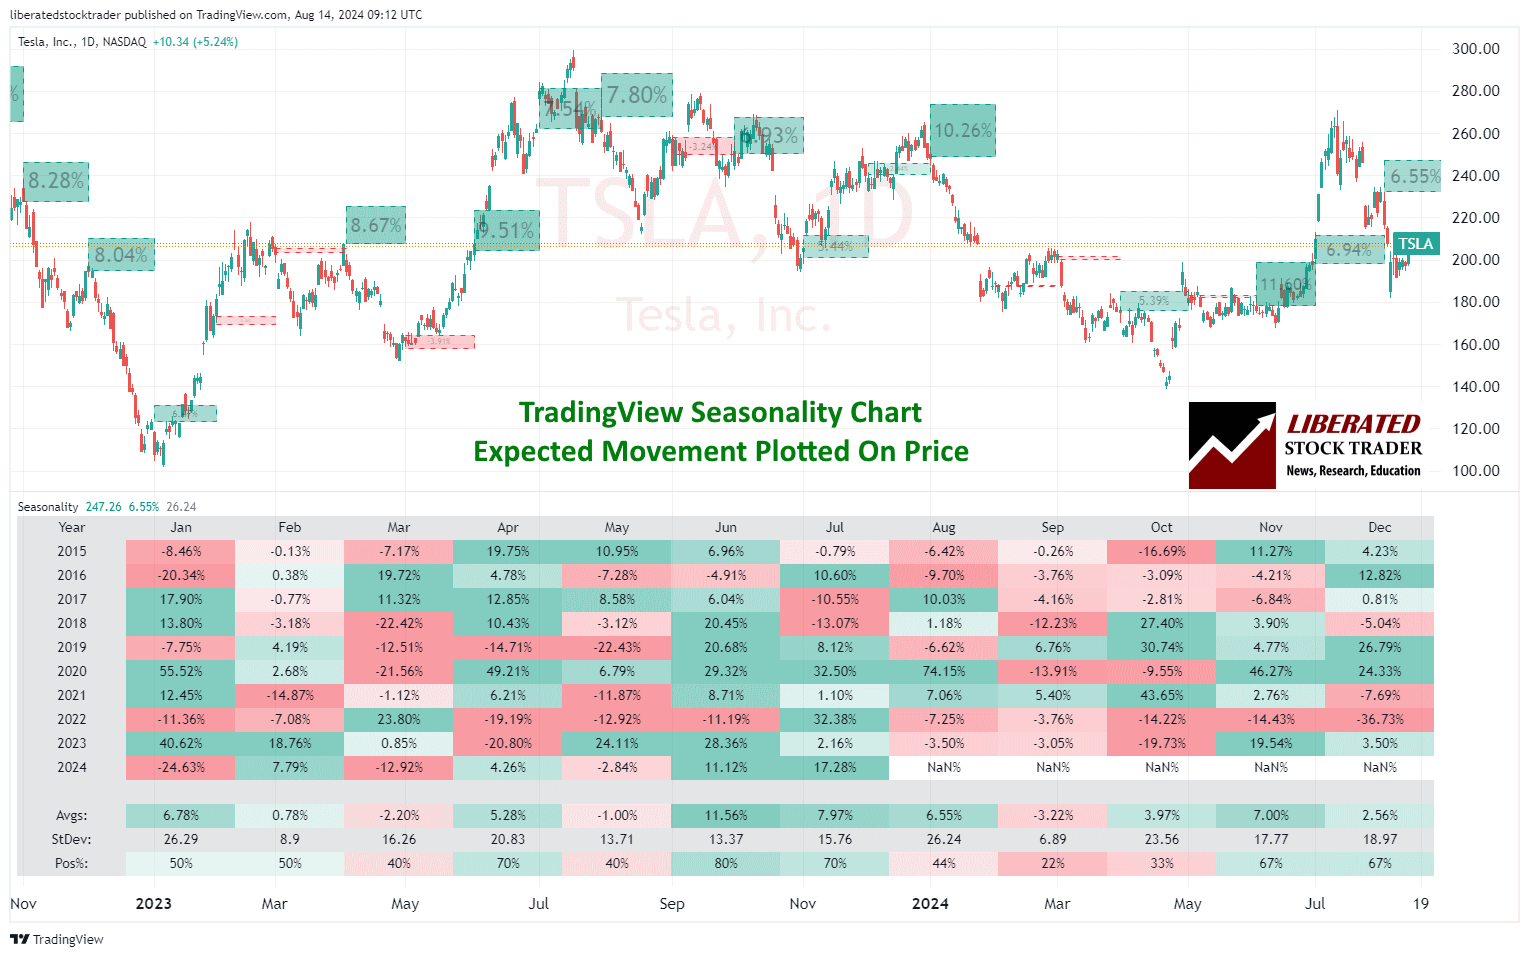
Seasonality charts provide predictable patterns that stocks follow during specific days, weeks, and months of the year. These trends are influenced by recurring events or cycles.| Liberated Stock Trader

Seasonal trends refer to certain sectors, like retail, which often perform better during holiday seasons, while agricultural products might see spikes during harvest times.| Liberated Stock Trader

I tested 23,487 RSI trades on 820 years of exchange data. When configured correctly, RSI can be highly profitable, with a 53% success rate and an average of 65% winning trades. The RSI setting of 14 on a 1-hour chart is the most reliable configuration for identifying profitable buy and sell signals.| Liberated Stock Trader
