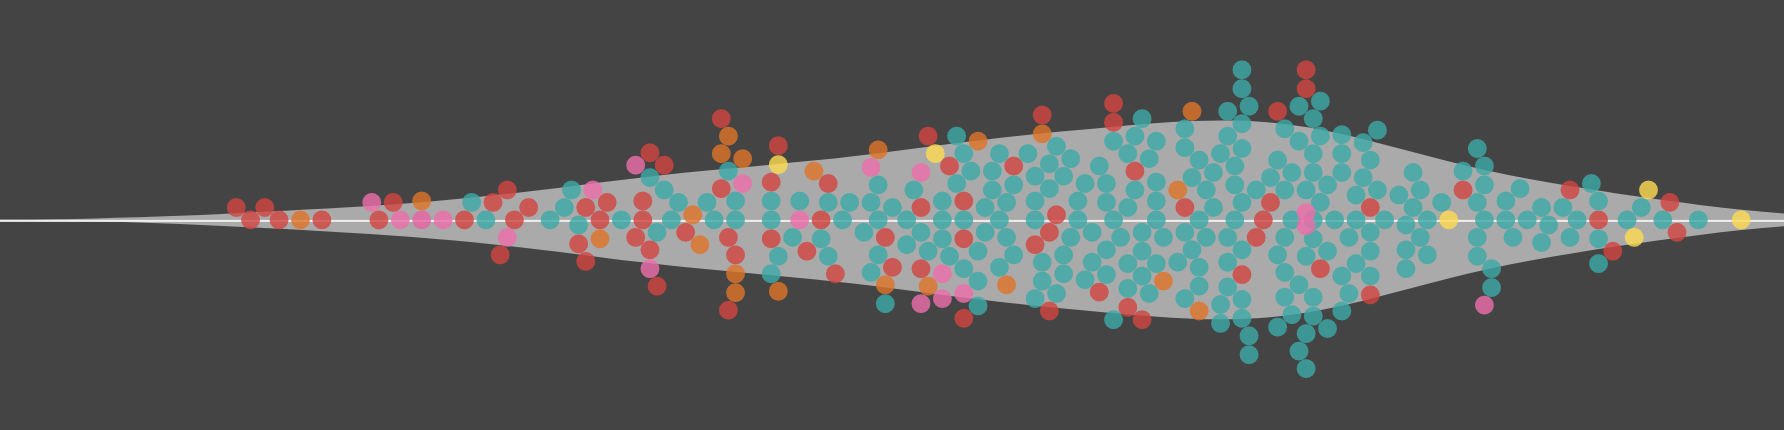
Introducing beeswarms 🐝, violin plots 🎻 and WebGL charts ⚡️ | The Flourish blog | Flourish | Data Visualization & Storytelling
Visualize your data insights with Flourish’s violin plot and beeswarm maker. Read our blog to learn how to use these charts and bring your data to life with our Scatter modes.| Flourish
