Price action trading is a method of day trading that relies on technical analysis but ignores conventional fundamental indicators, focusing instead on the movement of prices.| Liberated Stock Trader
Swing Trading and Day Trading differ in the timeframe, strategy, tools, and leverage. Day traders trade intraday using leverage; swing traders hold positions for days or weeks. Swing traders use real-time news, patterns, and indicators to make decisions, whereas day traders typically look for volatility to enable price scalping.| Liberated Stock Trader
Inventory to Sales Ratio is a crucial financial metric indicating the relationship between a company's inventory and sales volume. It sheds light on the efficiency of inventory management and plays a significant role in assessing performance against industry benchmarks.| Liberated Stock Trader
Common stock has voting rights and price appreciation in line with market prices, whereas preferred stock does not. However, preferred stock has higher priority dividend payments and liquidity rights in case of insolvency. The downside of preferred stock is that it has no voting rights, and they are callable.| Liberated Stock Trader
Preferred stock dividends are a form of payment made to preferred stock shareholders. Preferred stock is a type of ownership in a company granting privileges such as priority over common stockholders in the event of bankruptcy or liquidation.| Liberated Stock Trader
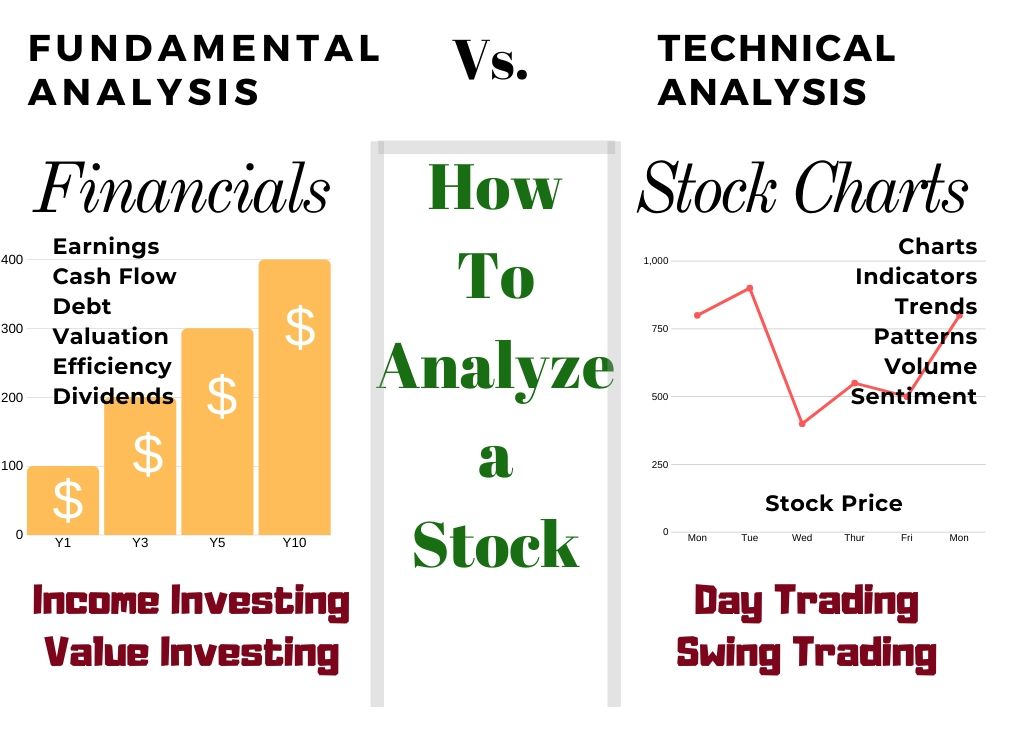
Learn technical analysis and how to read stock charts. This helps you understand the movement of stock prices, stock trends, and the supply-demand equation. Stock chart indicators and market sentiment are all important factors.| Liberated Stock Trader
The Price to Earnings Ratio is a commonly misunderstood calculation for determining a company's relative value. The PE Ratio is only useful for comparing companies in the same industry with similar business models. It should not be used to compare radically different businesses.| Liberated Stock Trader
Market makers provide liquidity by constantly being ready to buy or sell a particular security, ensuring that trades can be executed quickly and at fair prices.| Liberated Stock Trader
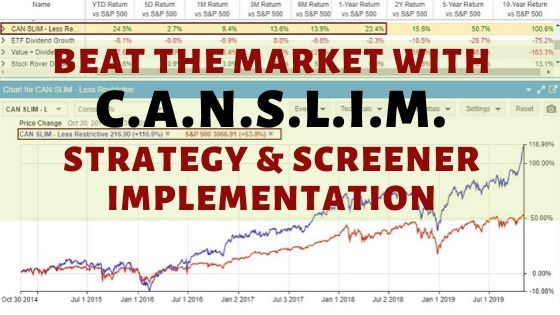
CANSLIM is an active investment strategy that utilizes specific screening criteria such as earnings, market leadership, product innovation, institutional ownership, and stock price trends. These key criteria play a vital role in the process of stock selection.| Liberated Stock Trader
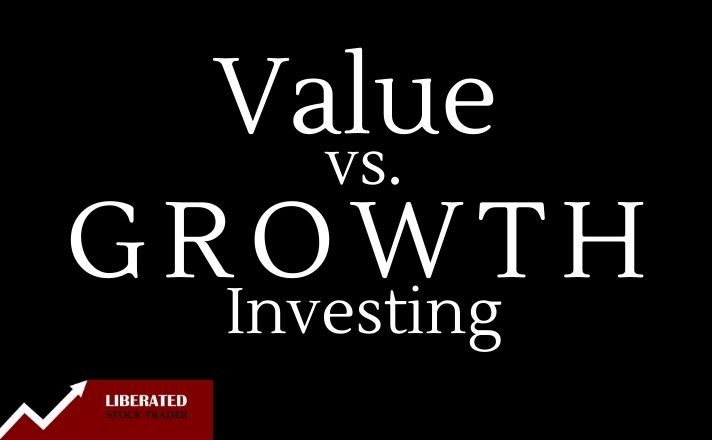
Our data analysis for the past decade shows that growth stocks have outperformed value stocks. Growth investing has shown a remarkable return rate of 523%, while value investing has yielded 247%.| Liberated Stock Trader
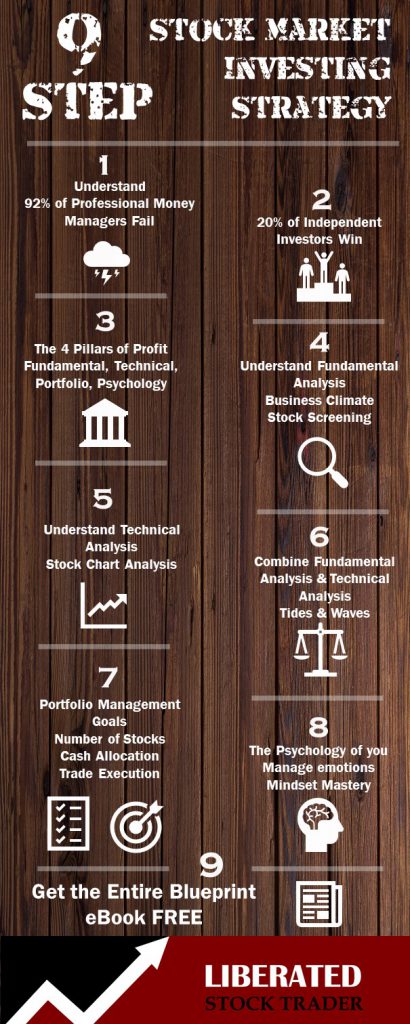
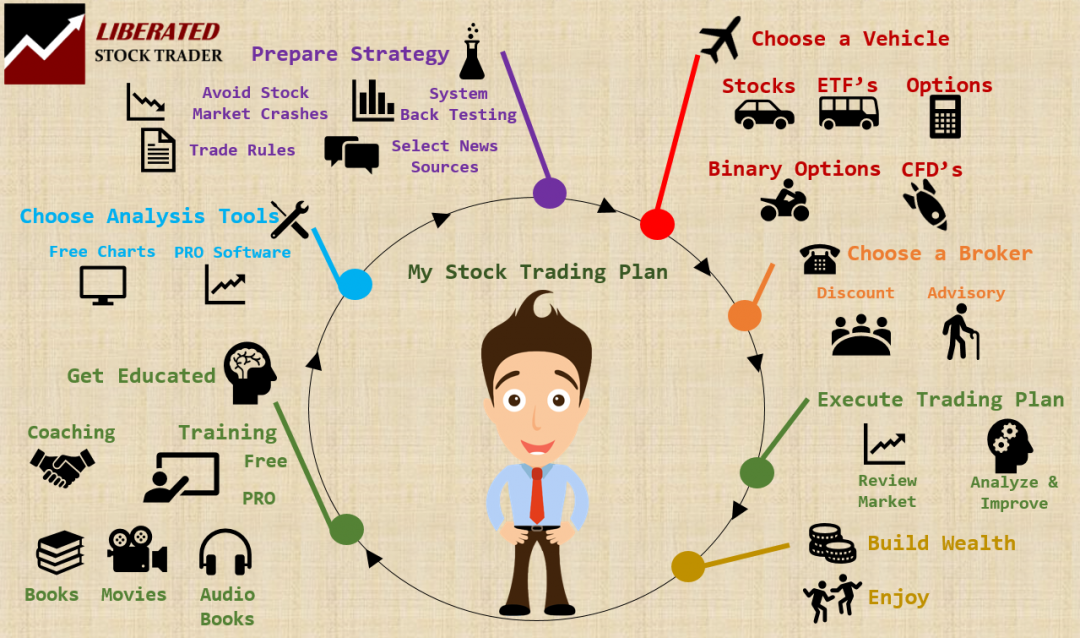
The stock market strategy blueprint is a handcrafted process to help you to understand all the factors at play in the stock market.| Liberated Stock Trader
Stock futures are derivative contracts that track the future price of a certain stock. They are agreements to buy or sell a specific stock at a predetermined price on a set date in the future.| Liberated Stock Trader
To trade stock options successfully, you should have a strong foundation in basic stock market knowledge and an understanding of how options work. Options are contracts that give the buyer the right, but not the obligation, to buy or sell a specific stock at a predetermined price on or before a certain date.| Liberated Stock Trader
Value investing is an investment strategy focused on buying stocks trading at a discount relative to their intrinsic or fair value. Academic research shows value investing generates lower risk and higher long-term returns than dividend and growth investing.| Liberated Stock Trader
A bond is an agreement between an issuer, usually a corporation or a government and a holder usually a commercial institution, individual or another government.| Liberated Stock Trader
Based on our extensive testing, it has been determined that when used as a standalone indicator, Supertrend does not demonstrate reliability or profitability. With an average profit expectancy of 0.24, it is recommended to combine Supertrend with other indicators.| Liberated Stock Trader
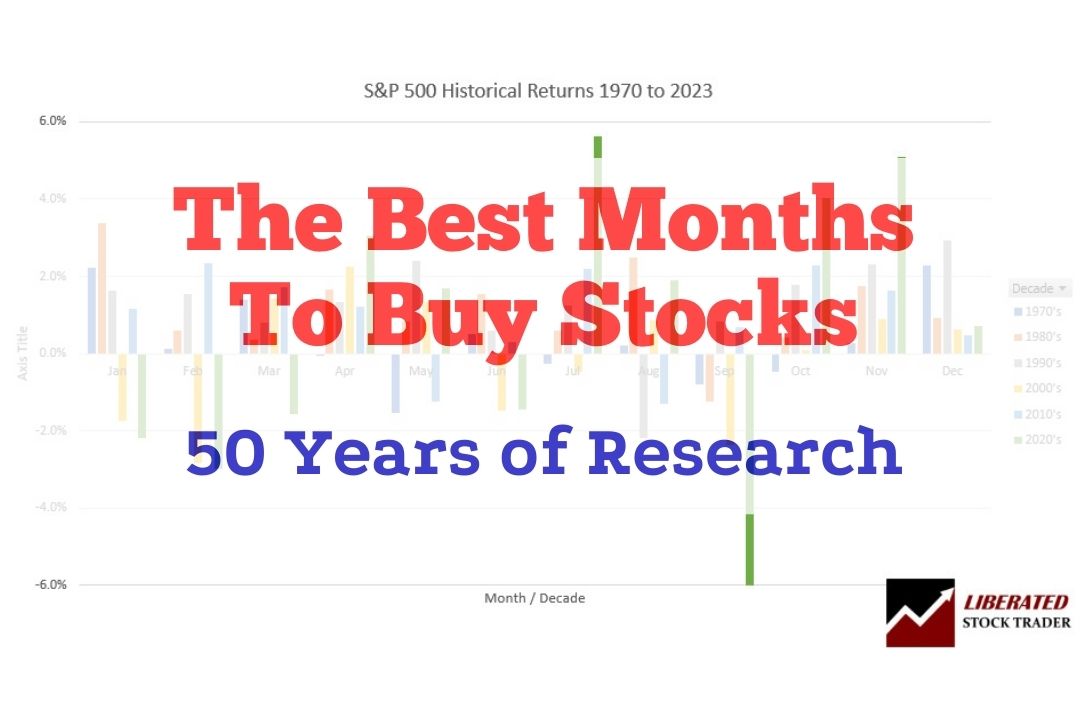
According to our research, using 53 years of stock exchange data, the best time to buy stocks is in October, and the best time to sell stocks is in July.| Liberated Stock Trader
According to my research, during a bull market, investors should hold a stock for between 50 and 300 days to allow profits to develop optimally. The ideal hold time for swing traders is 45 days for an average profit of 30%.| Liberated Stock Trader
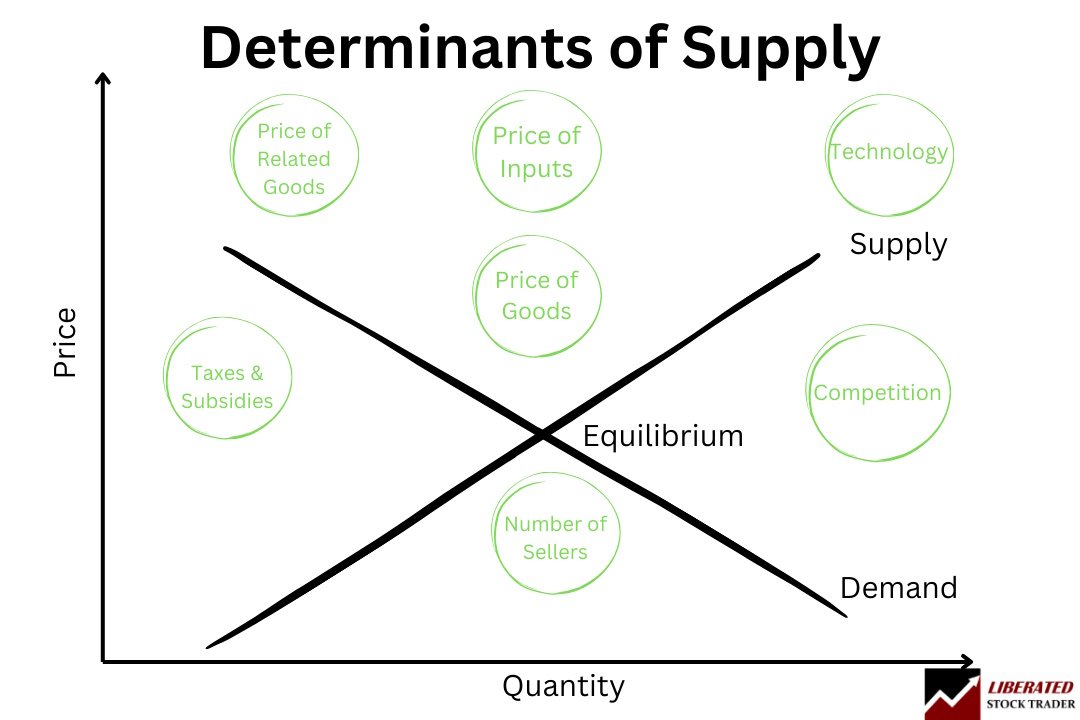
The determinants of supply are crucial in economics, forming the foundation of functioning markets and the economy. Key determinants of pricing, labor, taxes, competition, suppliers, and technology cause the supply of goods and services to change.| Liberated Stock Trader
To consistently beat the market is difficult but not impossible. O'Neill, Greenblatt, Buffett, and Klarman are legendary investors who have beaten the market. I test the strategies and show you the best ways to implement them.| Liberated Stock Trader
We explain the 101 most important stock market terms and decipher financial jargon with simple definitions and practical examples.| Liberated Stock Trader
Yes, you can buy and sell the same stock on the same day four times weekly in the USA. If you day trade more often, you must follow the FINRA rules on Pattern Day Trading (PDT), which means being a registered day trader and having a $25K minimum account balance.| Liberated Stock Trader
Most stocks are considered liquid assets because they are traded on open exchanges. But not all stocks are liquid. Penny stocks trading on over-the-counter (OTC) exchanges can have few buyers and sellers, making them illiquid, high-risk investments.| Liberated Stock Trader
A stock price represents a share of a company in the US, while the share price is more commonly used in the UK, Australia, and other parts of the world.| Liberated Stock Trader
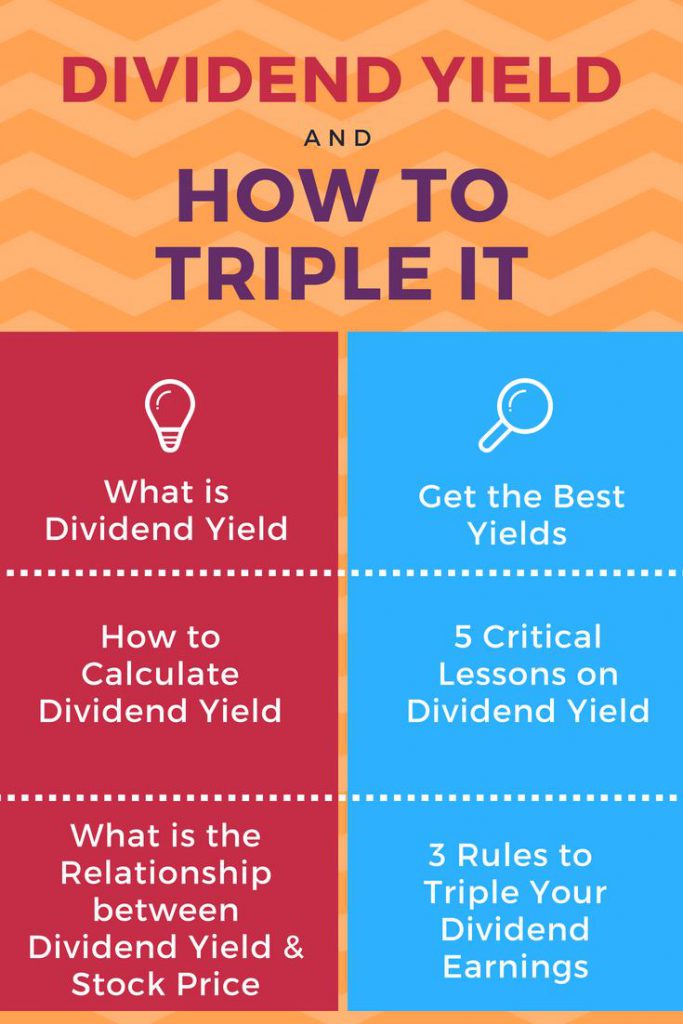
To calculate dividend yield, divide the stock's annual dividend per share by the stock's current market price. The dividend yield increases as share prices drop, so to triple your yields, buy stock price panic crashes.| Liberated Stock Trader
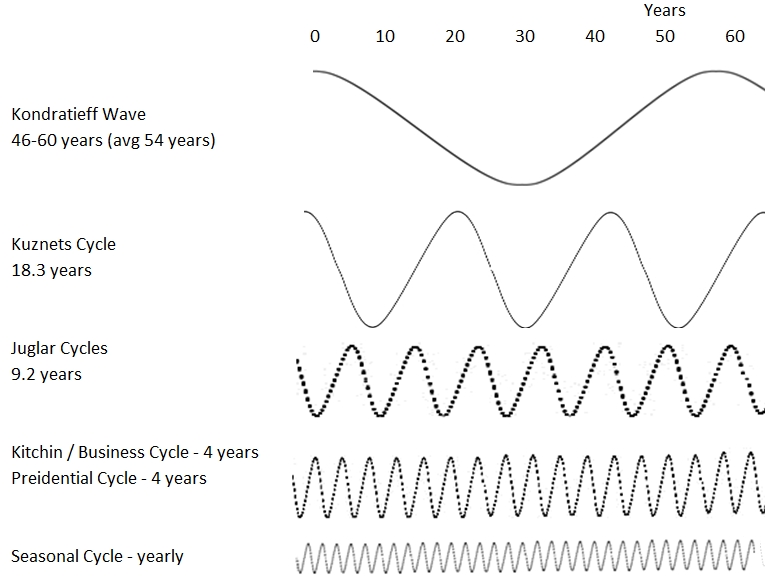
Six waves and cycles influence how our economies, businesses, and financial markets expand and contract. The Kondratieff Wave, Kuznets Cycle, Juglar Cycle, Business Cycle, Presidential Cycle, and Seasonal Cycle will change how you see the world.| Liberated Stock Trader
Stock market cycle theory is the practice of understanding economic, political, and psychological events and their impact on the stock market.| Liberated Stock Trader
Yes, options trading is similar to gambling if you are betting on the direction of a stock. Options are more like insurance if you use them to protect against losses in assets you own.| Liberated Stock Trader
Our ultimate guide to technical analysis, with its 14 videos and detailed examples covering charts, trends, indicators, patterns, and tools, will fast-track your knowledge.| Liberated Stock Trader
There are two ways to analyze stocks. Fundamental analysis, which evaluates criteria such as PE ratio, earnings, and cash flow. Technical analysis, which involves studying charts, stock prices, volume, and indicators.| Liberated Stock Trader
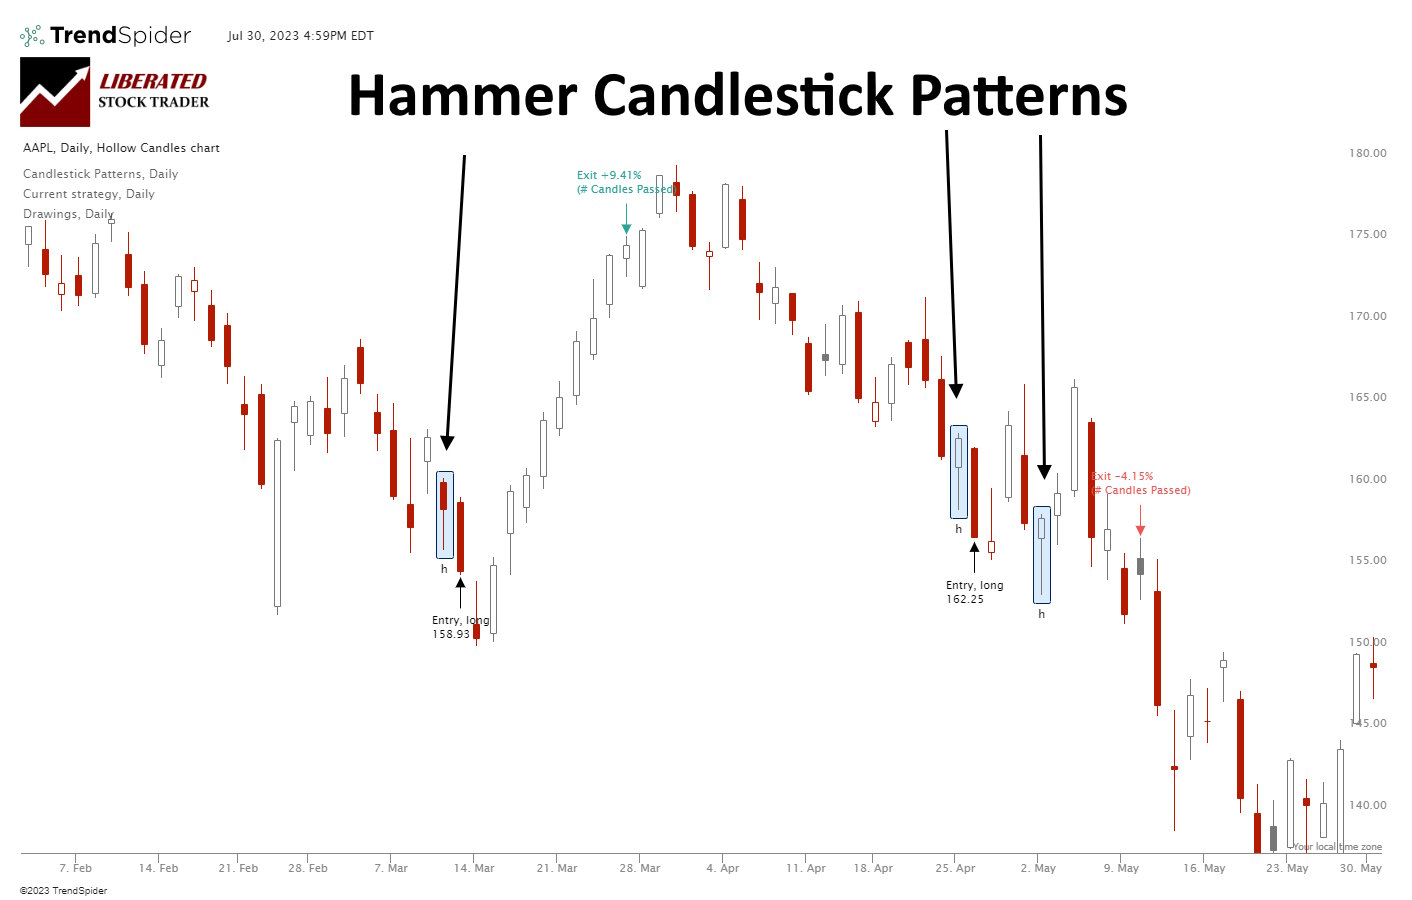
According to 2,219 tested trades, a Hammer is extremely unreliable and unprofitable. It has a low % accuracy rate of 52.1%, resulting in a razor-thin 0.18% profit per trade.| Liberated Stock Trader
The key tactics to improve your short selling strategy are: use fundamental and technical analysis, use the right charts, indicators, and proven bearish patterns. Finally, ensure proper risk management and use leverage wisely.| Liberated Stock Trader
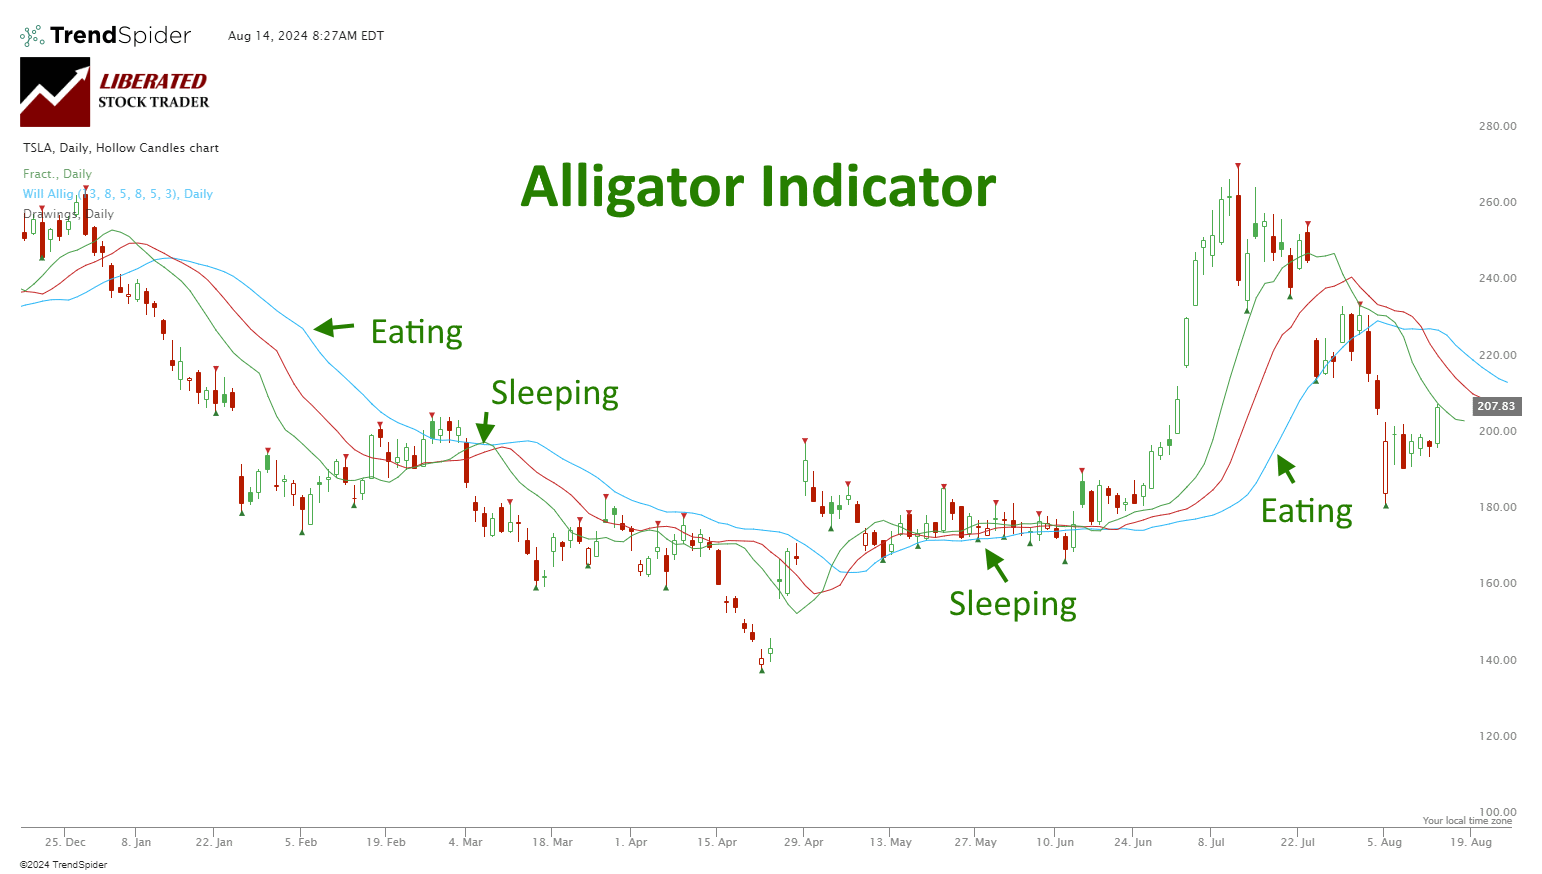
My unique research shows that the Alligator indicator is highly profitable in stocks and indices, using daily and weekly chart timeframes. It is also only profitable on a weekly chart for Forex.| Liberated Stock Trader
A one-point move in a stock price equals a one-dollar change. When someone says a stock is down two points, its price has declined by two dollars. Points in a stock index are similar to points in a stock, but instead of referring to the actual stock price, they refer to an index's performance.| Liberated Stock Trader
Investors use the income statement to understand a company's key metrics, revenue, expenses, profit, and operating costs. It is one of the most important documents investors use to understand a company's financial performance.| Liberated Stock Trader
In technical analysis, Fibonacci retracement is used by traders to predict levels of support and resistance by drawing horizontal lines according to the Fibonacci sequence. But Does It Work?| Liberated Stock Trader
A dead cat bounce is a short-term asset price recovery after a significant volatile decline, followed by a continuation of the downtrend. Look for a short-lived rally that loses momentum quickly, often trapping bullish traders.| Liberated Stock Trader
Using stock leverage, which involves trading stocks with a margin account, leveraged ETFs, or stock options, can be a double-edged sword. It has the potential to magnify both your gains and losses.| Liberated Stock Trader
To read a balance sheet effectively, start by focusing on three main sections: assets, liabilities, and equity. Assets represent what the company owns, liabilities show what the company owes, and equity reflects its net worth.| Liberated Stock Trader
Financial leverage refers to using borrowed funds to increase the potential return on investment. It magnifies potential gains and losses, vital to a company's capital structure.| Liberated Stock Trader
To find undervalued stocks, use established financial ratios such as discounted cash flow, the margin of safety, PEG, price to book, or the price to Graham number. Each ratio provides a unique insight into a company to determine if it is undervalued.| Liberated Stock Trader
Liberated Stock Trader offers free stock investing courses covering value, growth, dividend investing, and technical chart analysis. Our courses are developed by IFTA member and certified financial technician Barry D. Moore.| Liberated Stock Trader
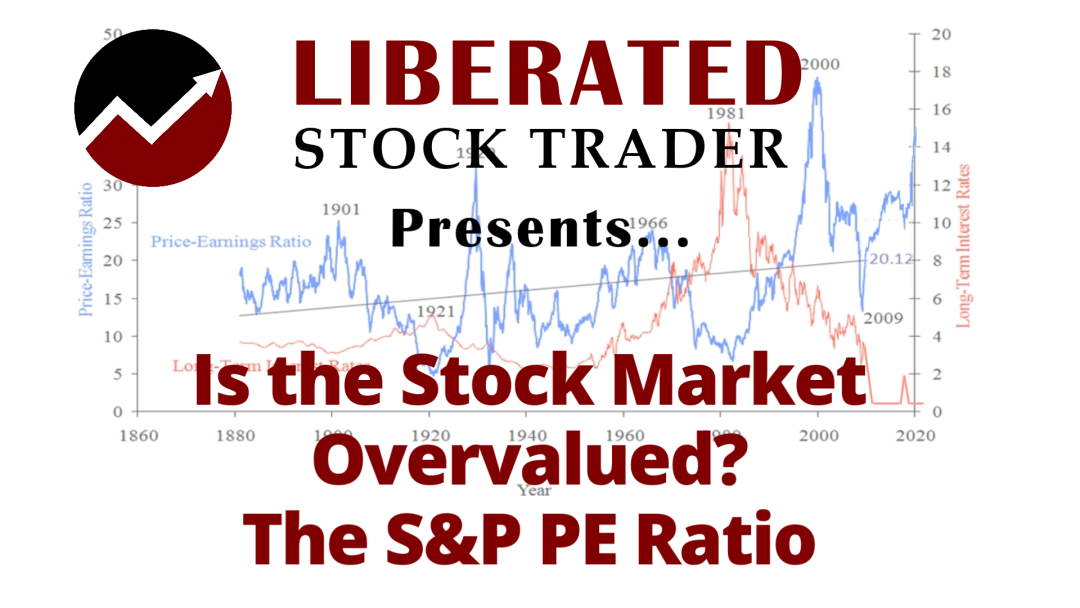
According to the Shiller PE Ratio, the US stock market is currently 19.2% overvalued compared to its 200-month moving average. Currently, the PE ratio of the S&P 500 is 31, and the 10-year average is 26.| Liberated Stock Trader
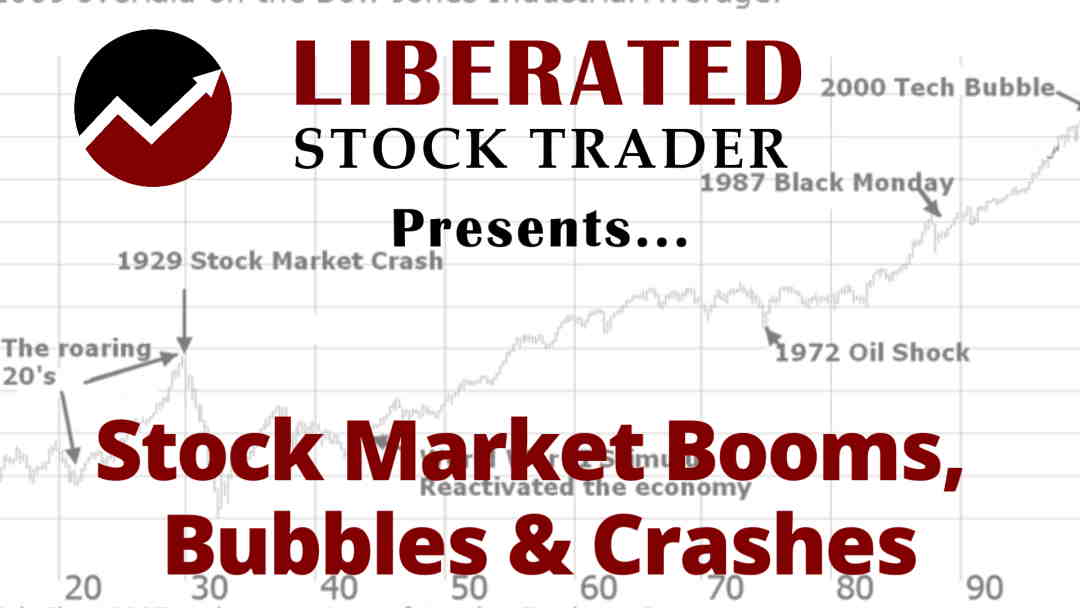
Our research shows that asset bubbles, easy access to cheap credit, weak regulation, and poor institutional risk management are the causes of crashes.| Liberated Stock Trader
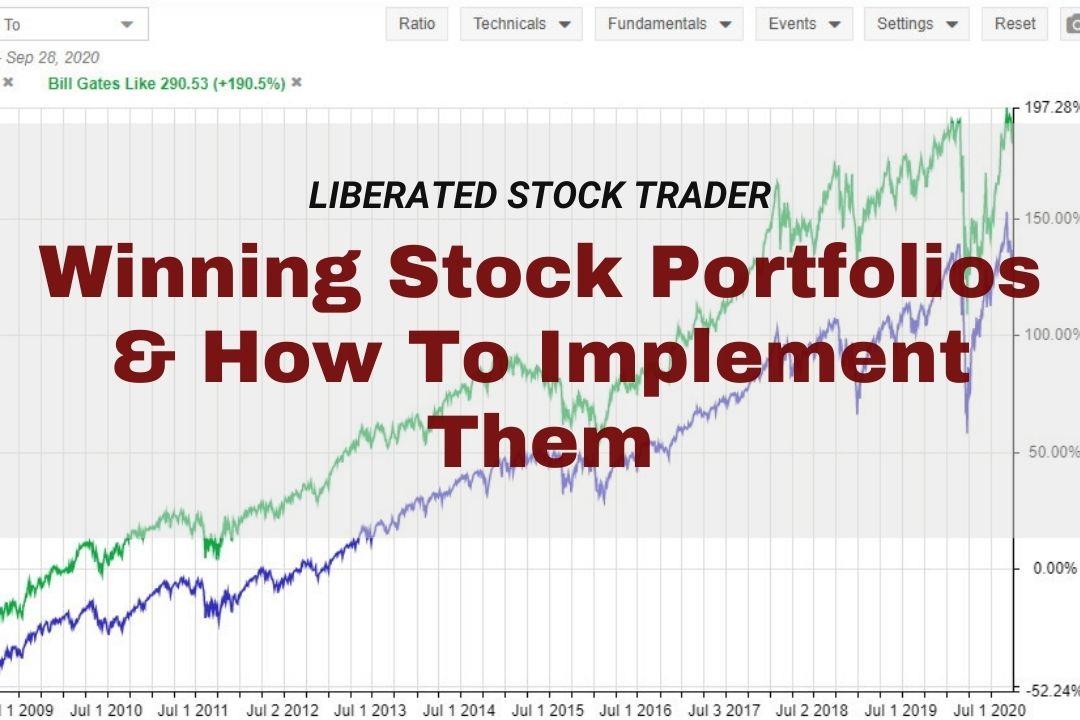
Our years of performance testing reveal the world's best-performing stock portfolios are Berkshire Hathaway, CANSLIM, GreenBlatt's Magic Formula, and the FAANG portfolio. We share examples and show you how to implement them.| Liberated Stock Trader
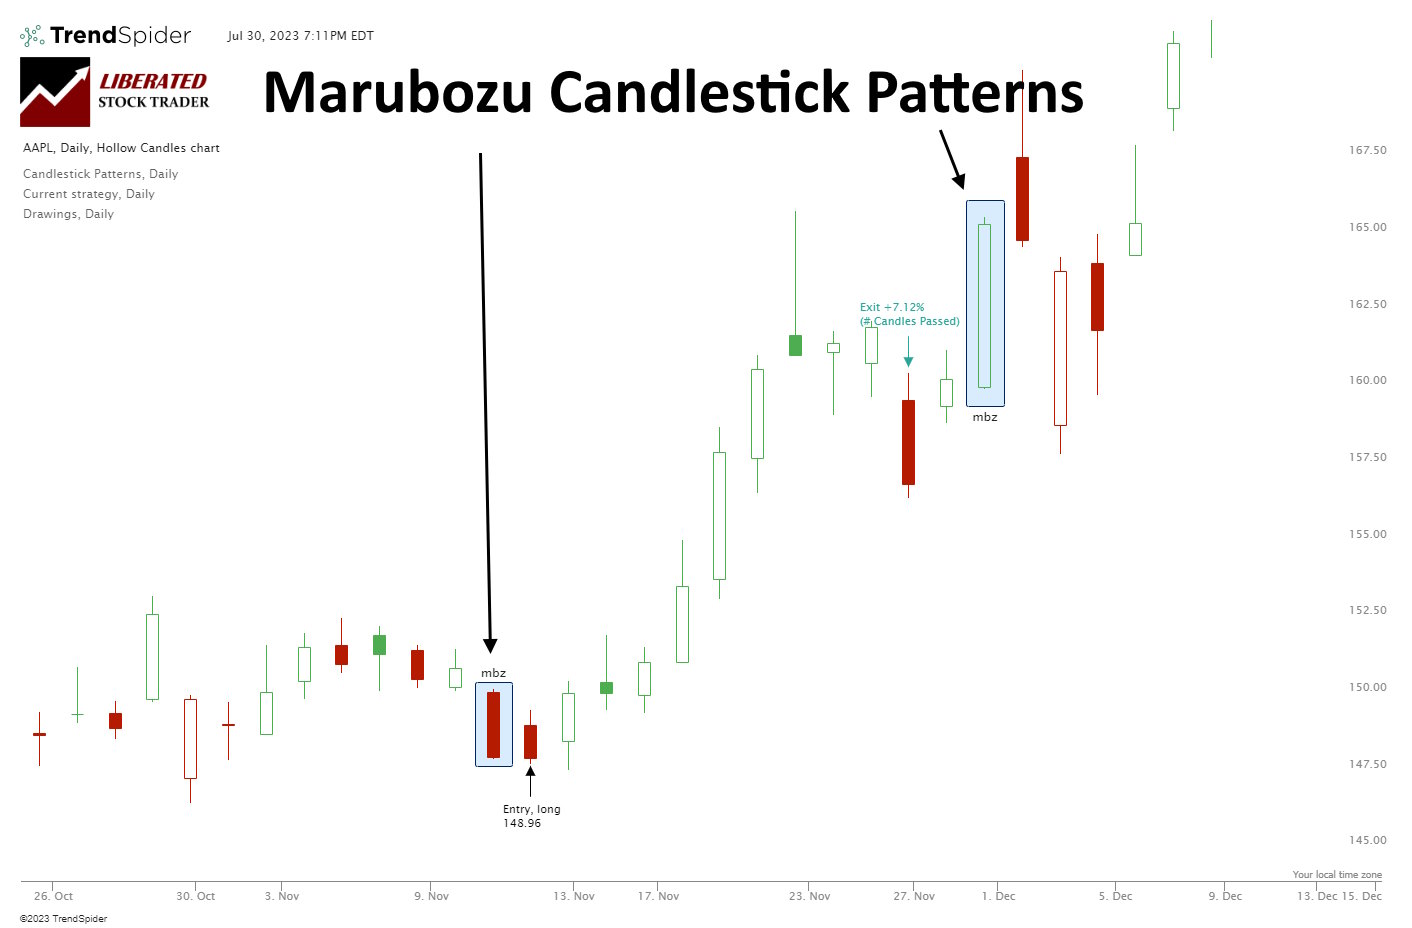
Our research shows Bearish Marubozu candles are among the most profitable patterns. Based on 568 years of data, it has a 56.1% success rate and an average win of 4.1%. Conversely, the Bullish Marubozu is one of the worst.| Liberated Stock Trader
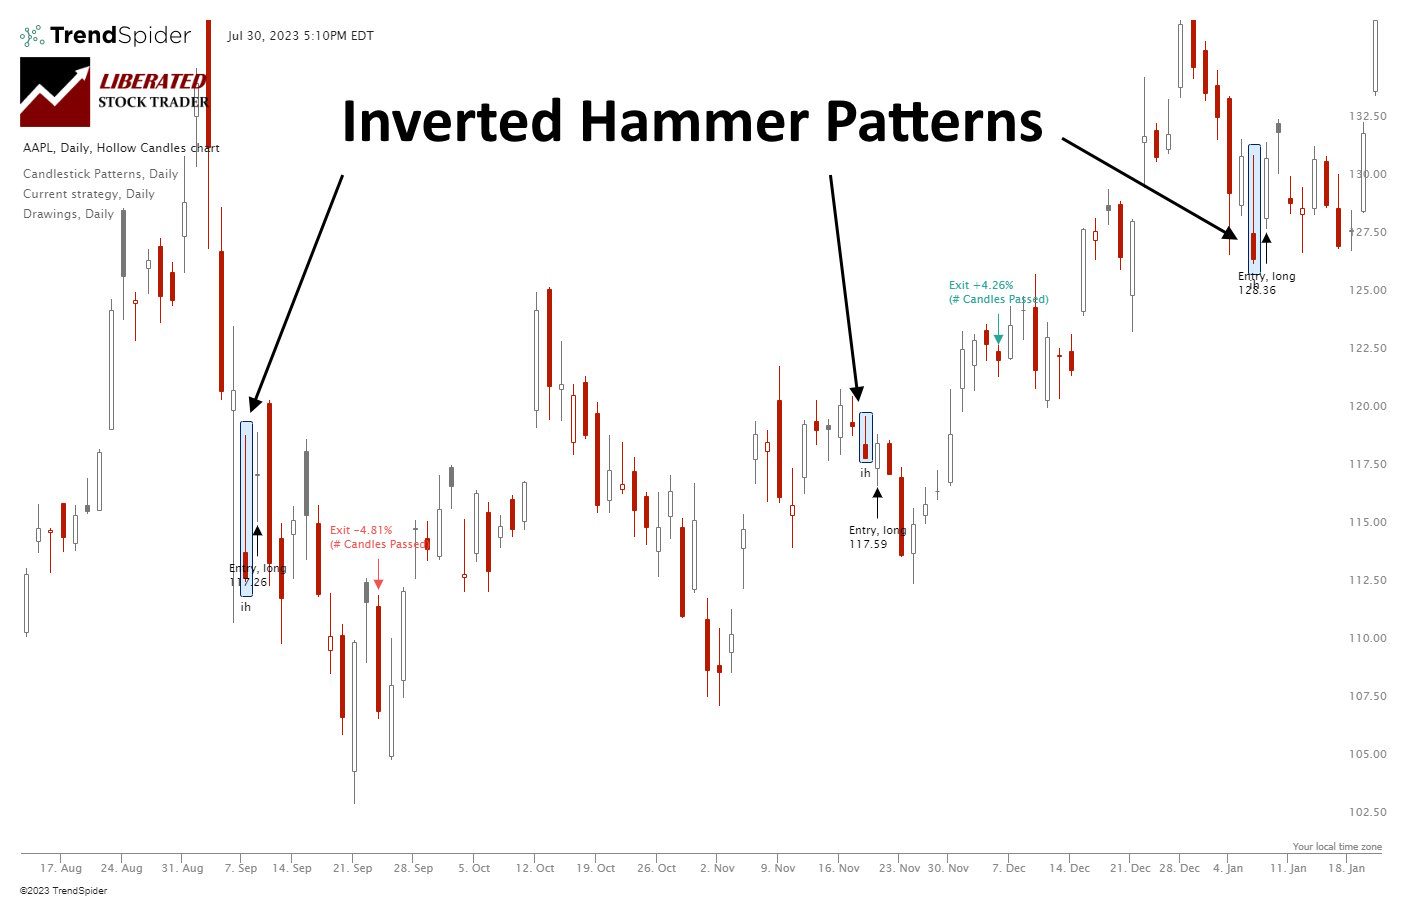
Our research shows the Inverted Hammer is the most accurate and profitable candlestick pattern. Used as a bullish signal, it has a 60% success rate and an average win of 4.2%, based on 588 years of data.| Liberated Stock Trader
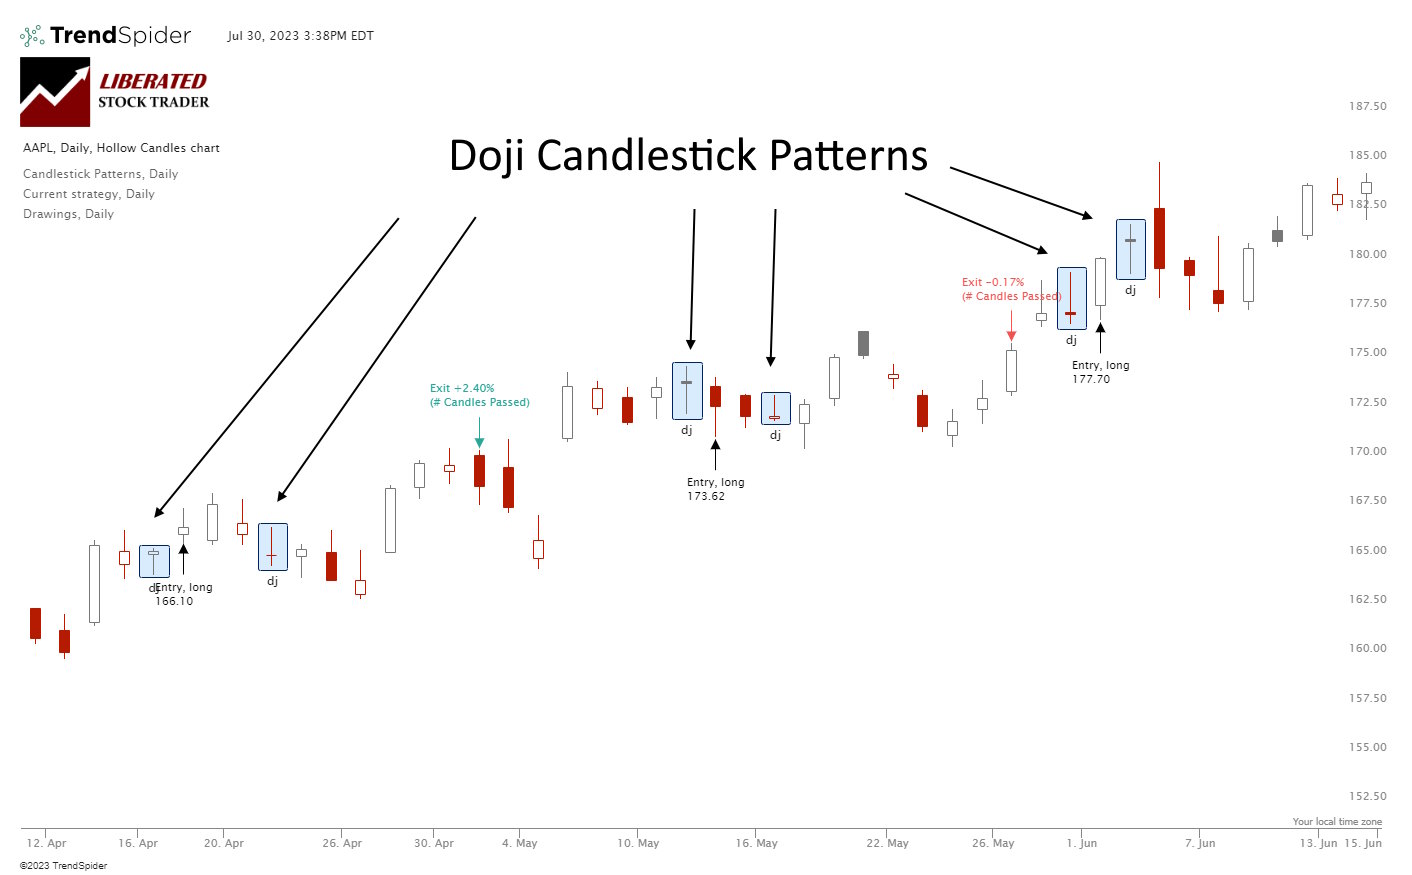
A Doji candlestick chart pattern indicates a battle between buyers and sellers, ending in equilibrium. The Doji marks a potential trend reversal. Is the Doji pattern profitable or accurate? Our evidence suggests its profitability is marginal.| Liberated Stock Trader
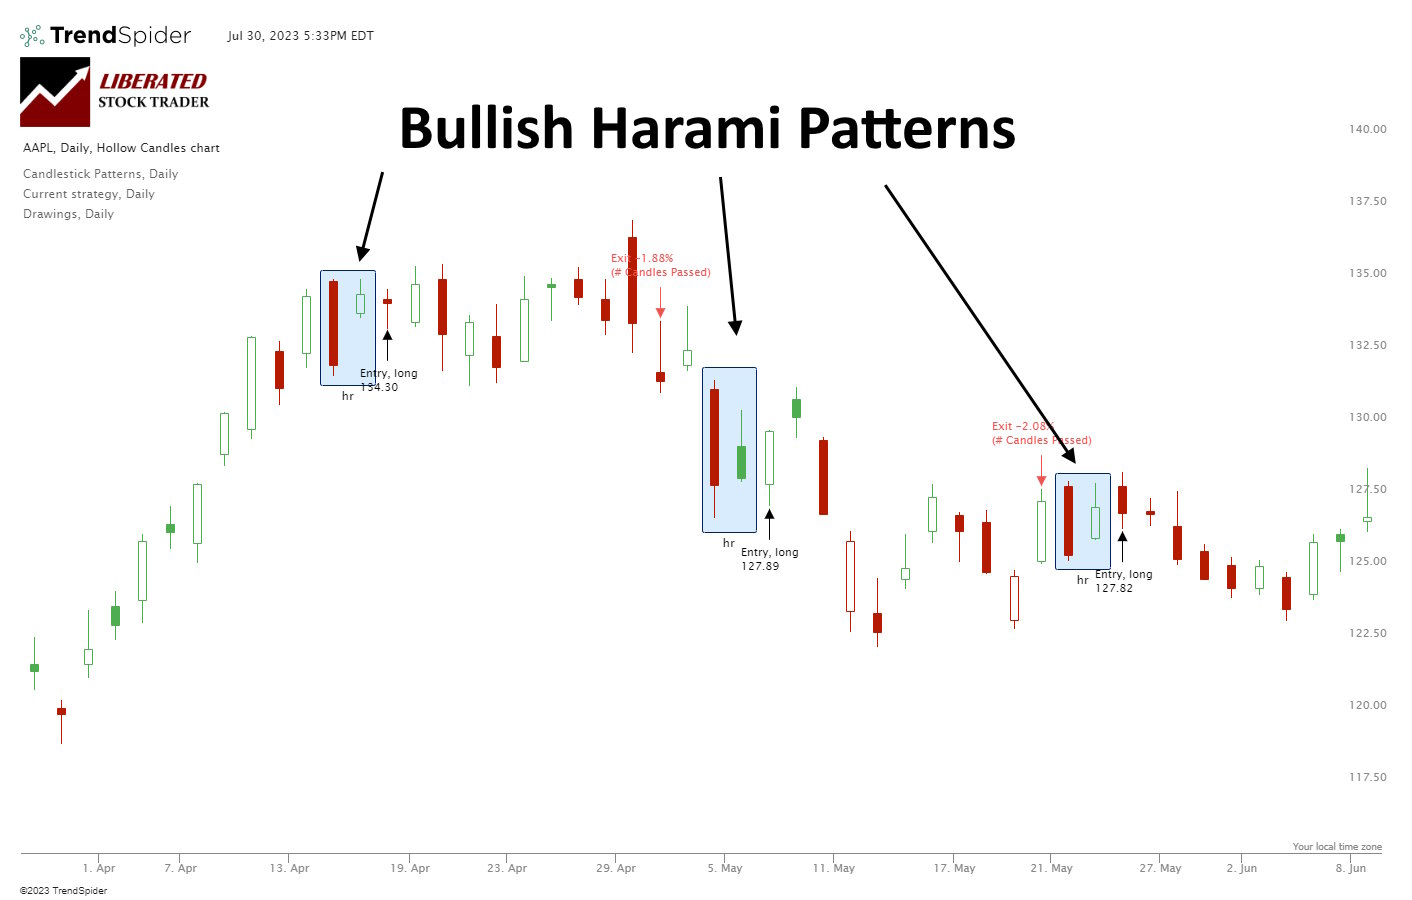
Our research shows Bullish Harami and Bullish Harami Cross are profitable patterns. Based on 1,112 years of data, the bullish Harami has an average profit per trade of 0.5% and the Harami Cross 0.58%.| Liberated Stock Trader
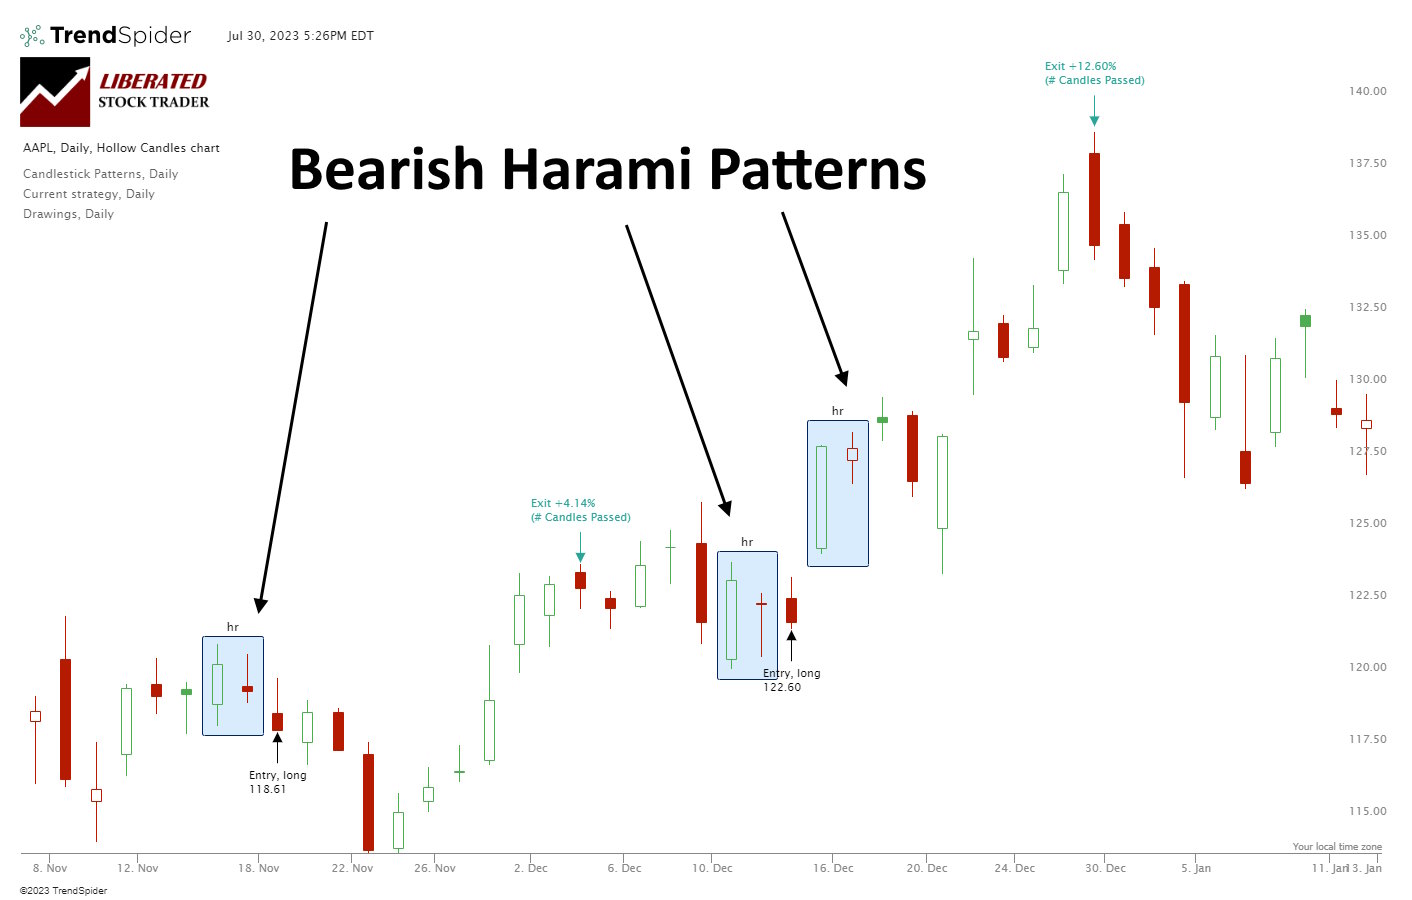
Our research shows Bearish Harami and Bearish Harami Cross are profitable patterns. Based on 1,136 years of data, the Bullish Harami has an average profit per trade of 0.48% and the Harami Cross 0.57%.| Liberated Stock Trader
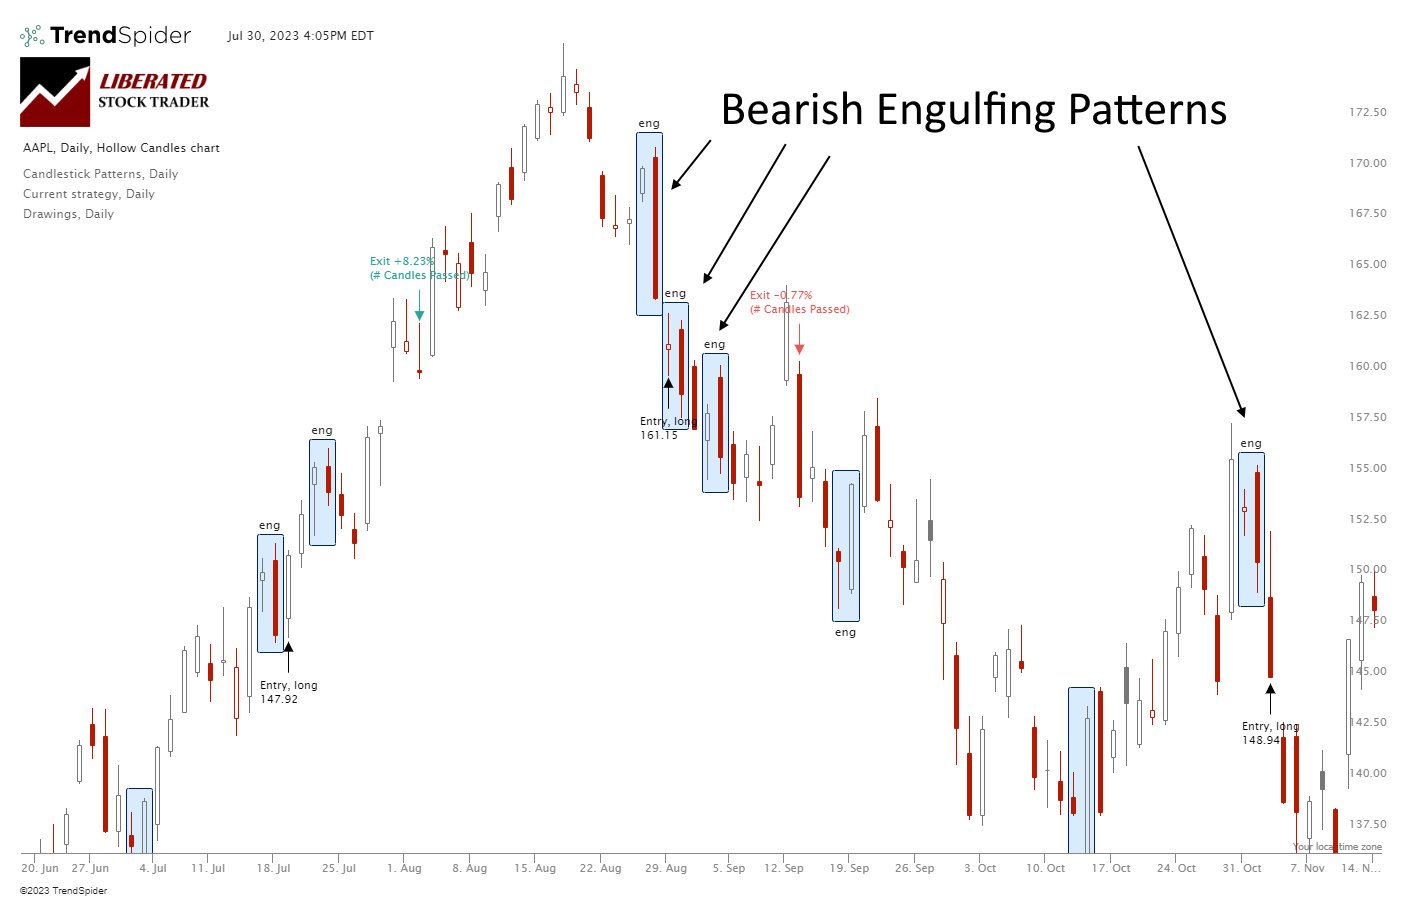
My research shows the Bearish Engulfing candle is an accurate and profitable pattern. Using 568 years of data, my testing revealed a 57% success rate and an average win of 3.7%.| Liberated Stock Trader
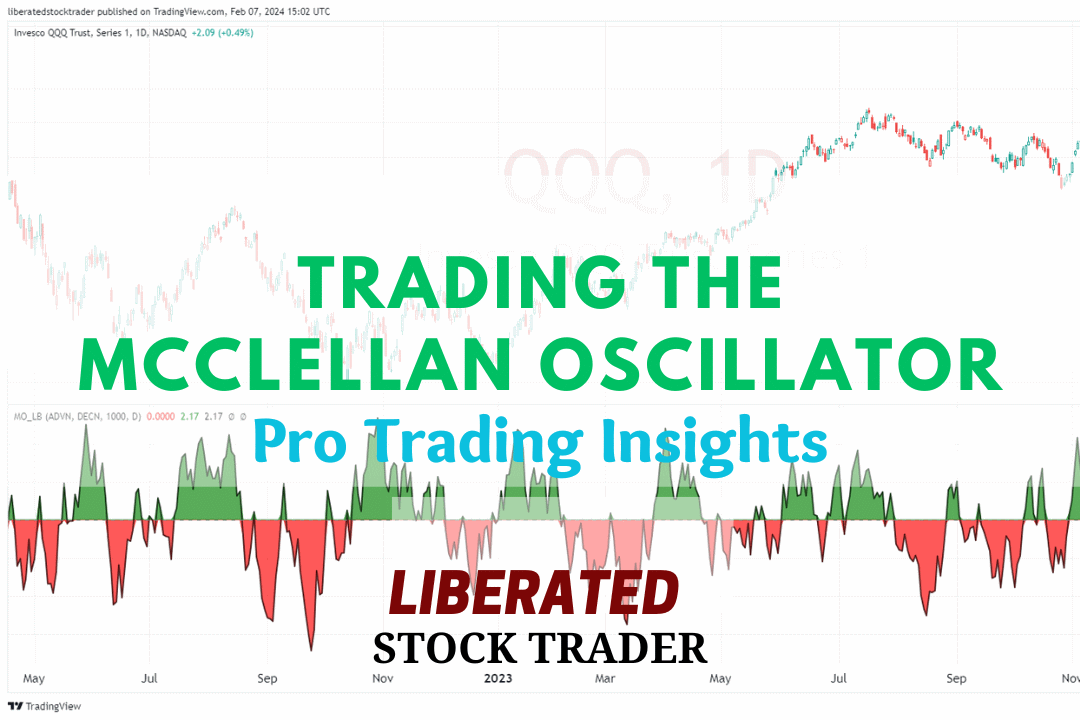
The McClellan Oscillator is a technical analysis tool designed to assess the market breadth of the New York Stock Exchange (NYSE). It is renowned for its effectiveness in revealing the underlying strength or weakness of the market by comparing the number of advancing to declining stocks.| Liberated Stock Trader
Stock volume measures the number of shares traded and indicates market strength. Rising markets with increasing volume are viewed as bullish, and falling prices on higher volume are bearish.| Liberated Stock Trader
Renko charts filter out unnecessary price fluctuations to provide a clear stock price trend that traders can use in their investing strategies. Unlike a traditional bar or candlestick chart, Renko charts are based on price changes rather than time.| Liberated Stock Trader
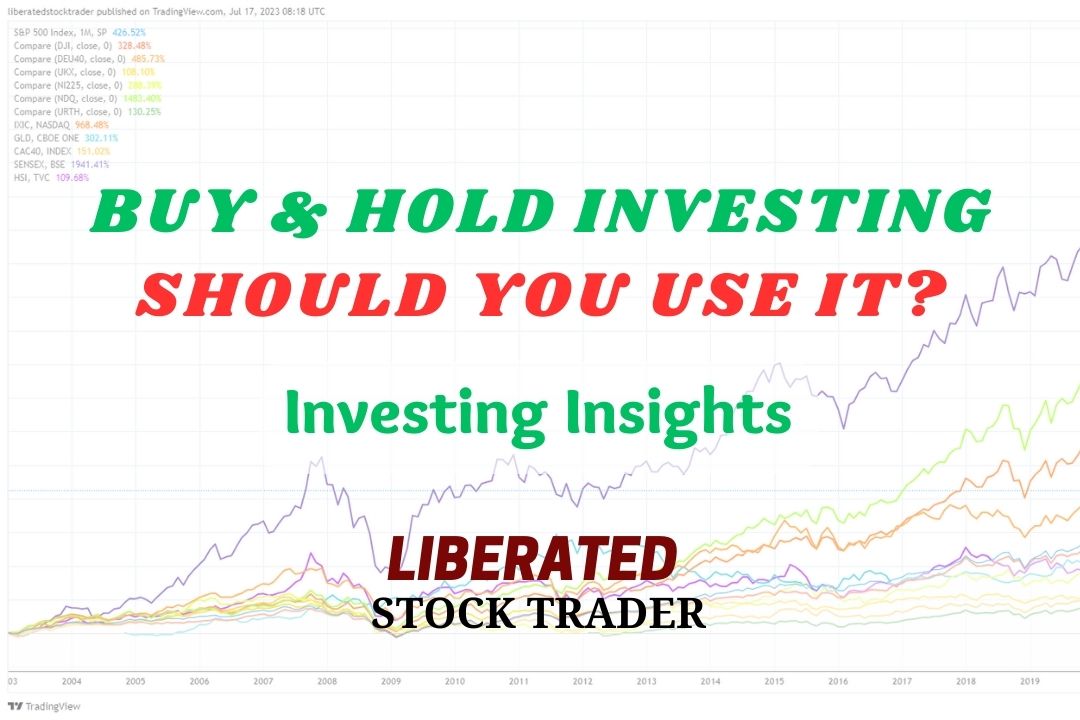
Our research shows that long-term buy-and-hold investing leads to significant profits. Over the past 30 years, annual stock market returns have averaged 10.7%, bonds and real estate yielded 4.8%, and gold returned 6.8%.| Liberated Stock Trader
I believe the best ways to learn stock trading include books, audiobooks, data-backed analytical research, and reputable investing courses taught by industry-certified instructors.| Liberated Stock Trader
Learn stock market investing with the complete online stock trading course by Barry D. Moore, a certified financial analyst from the International Federation of Technical Analysts (IFTA).| Liberated Stock Trader
To calculate the intrinsic value of a stock, estimate a company's future cash flow, discount it by the compounded inflation rate, and divide the result by the number of shares outstanding. The result is a stock's fair value.| Liberated Stock Trader
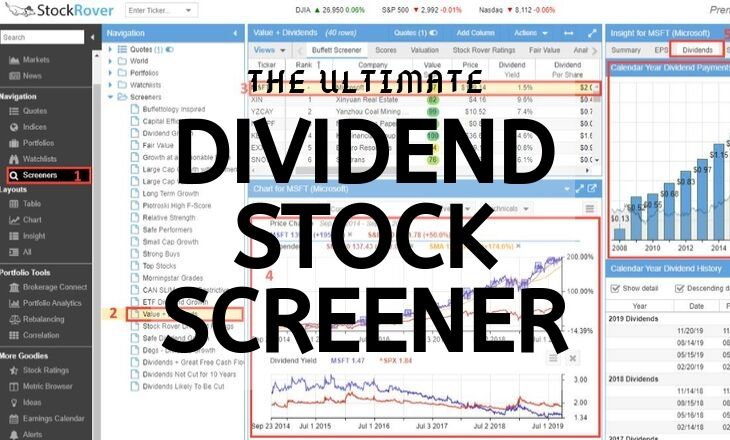
Our research shows you how to create the best dividend stock screener; you must decide on a high-yield, safe, or dividend growth strategy. Next, choose our tested criteria for your screener, like payout ratio, yield, and coverage.| Liberated Stock Trader
Cash flow is the lifeblood of a company, and the cash flow statement shows how much money was generated and spent during a given period, which makes it invaluable for investors looking to invest in a company.| Liberated Stock Trader
Our research shows that overconfidence and a lack of a robust trading plan are the biggest reasons traders lose when trading with margin or leverage.| Liberated Stock Trader
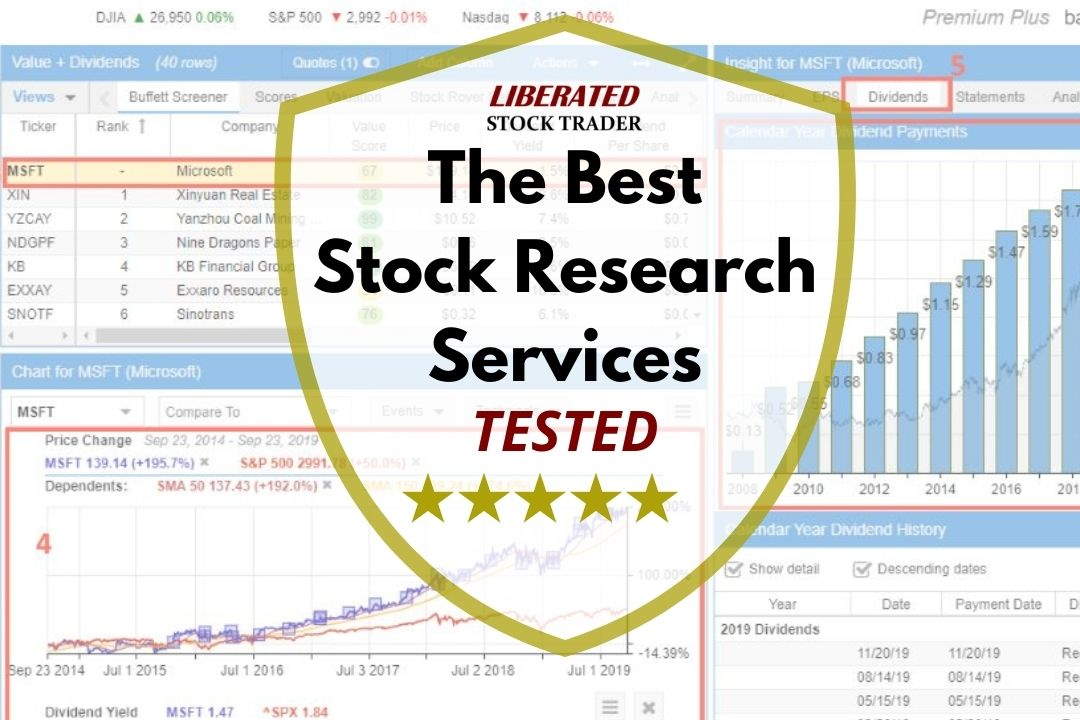
Our stock advisor testing shows the best stock picking services are Motley Fool Stock Advisor, Morningstar, AAII, and Zacks. Stock Rover is the best stock research tool alternative to stock picking services.| Liberated Stock Trader
Based on our 30-year research, adopting a buy-and-hold stocks strategy is annually 4% more profitable than actively trading stocks or investing in alternative assets such as corporate bonds, real estate, gold, or treasuries.| Liberated Stock Trader
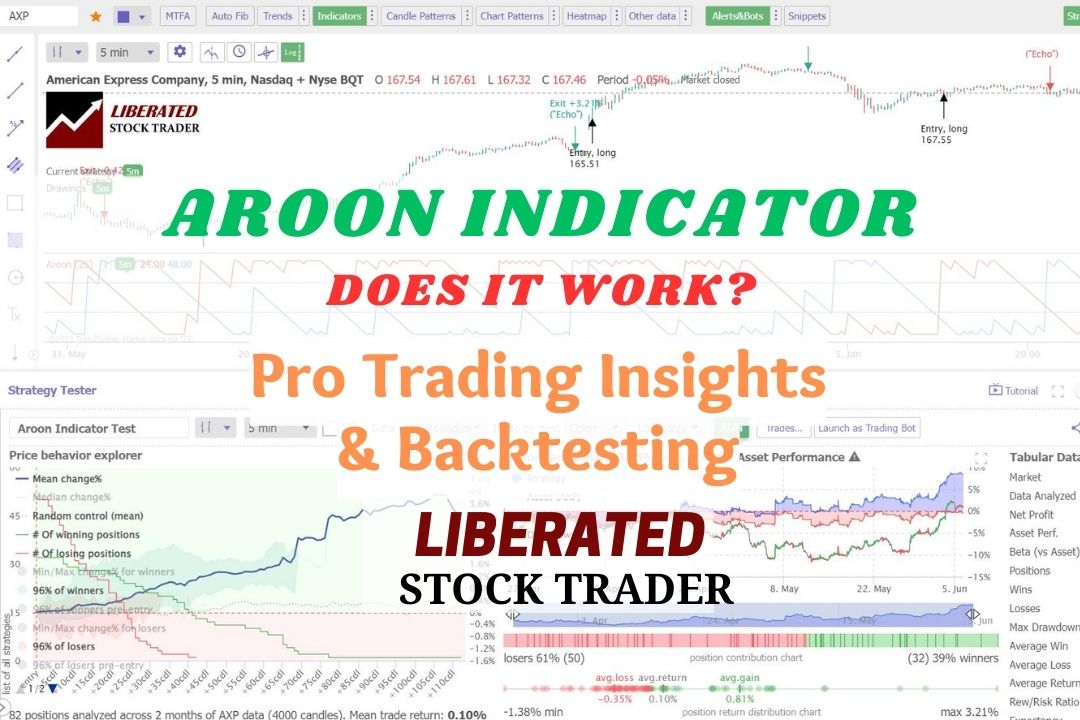
In technical analysis, the Aroon indicator identifies trend reversals and trend strength. This oscillating indicator has two parts: the "Aroon Up" line measures uptrend strength, and the "Aroon Down" line for downtrend strength.| Liberated Stock Trader
You can read candlestick charts using pattern recognition software to identify five reliable patterns, the Inverted Hammer, Bearish Marubozu, Gravestone Doji, Bearish Engulfing, and Bullish Harami Cross.| Liberated Stock Trader
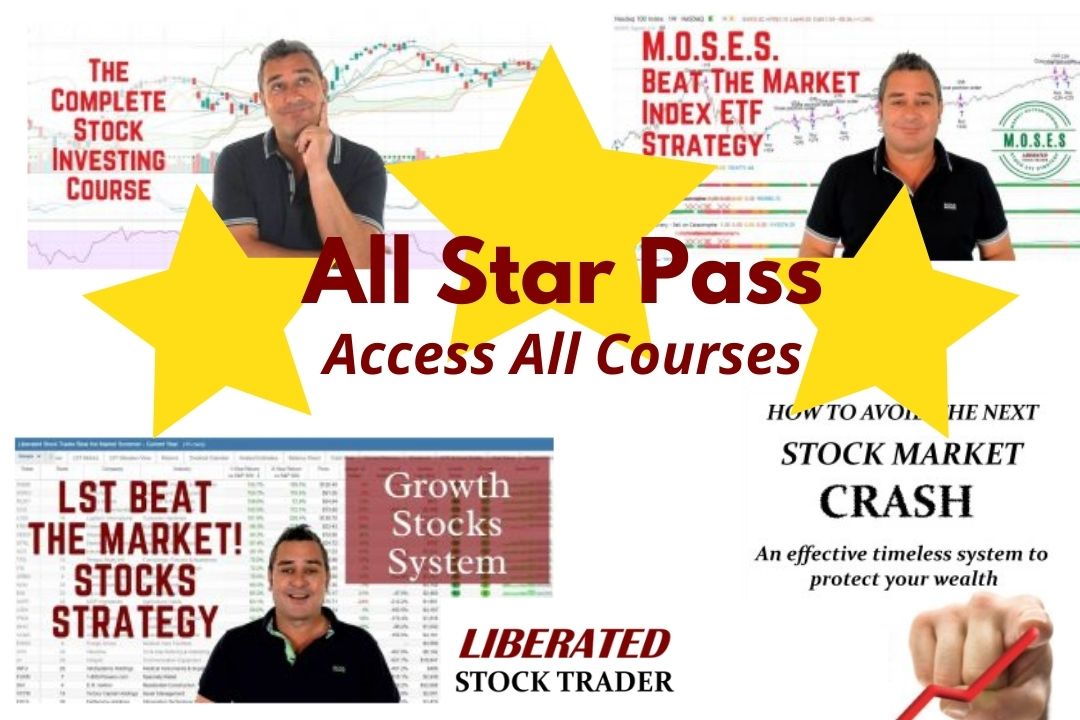
Our 4 Best Stock Investment Courses In One All-Star Pass. Start 2024 The Right Way with Full Lifetime Access To Our Pro Stock Investment Courses & Market-Beating Strategies.| Liberated Stock Trader
Day and swing trading uses technical chart analysis to trade short-term price moves, whereas growth and value investing use long-term fundamental financial analysis. The tools and strategies used for these types of trading are completely different.| Liberated Stock Trader
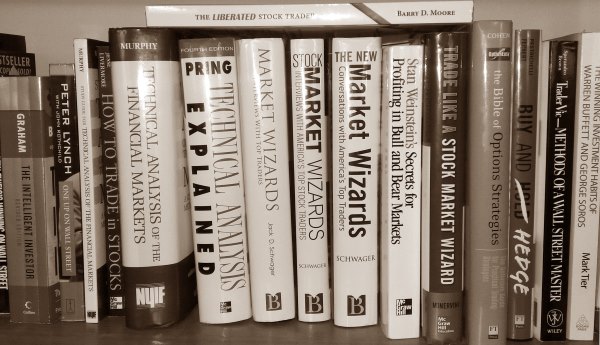
The best technical analysis books leading industry bodies recommend are Technical Analysis of the Financial Markets, Technical Analysis Explained, Cloud Charts, and Forecasting Financial Markets.| Liberated Stock Trader
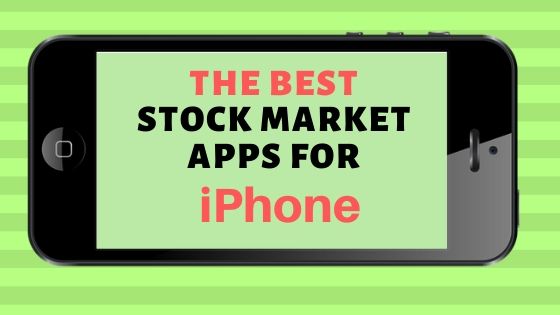
Our research shows the three best iPhone stock apps are TrendSpider for powerful AI-automated stock chart pattern recognition, TradingView for stock charts and social, and Firstrade for free stock trades.| Liberated Stock Trader
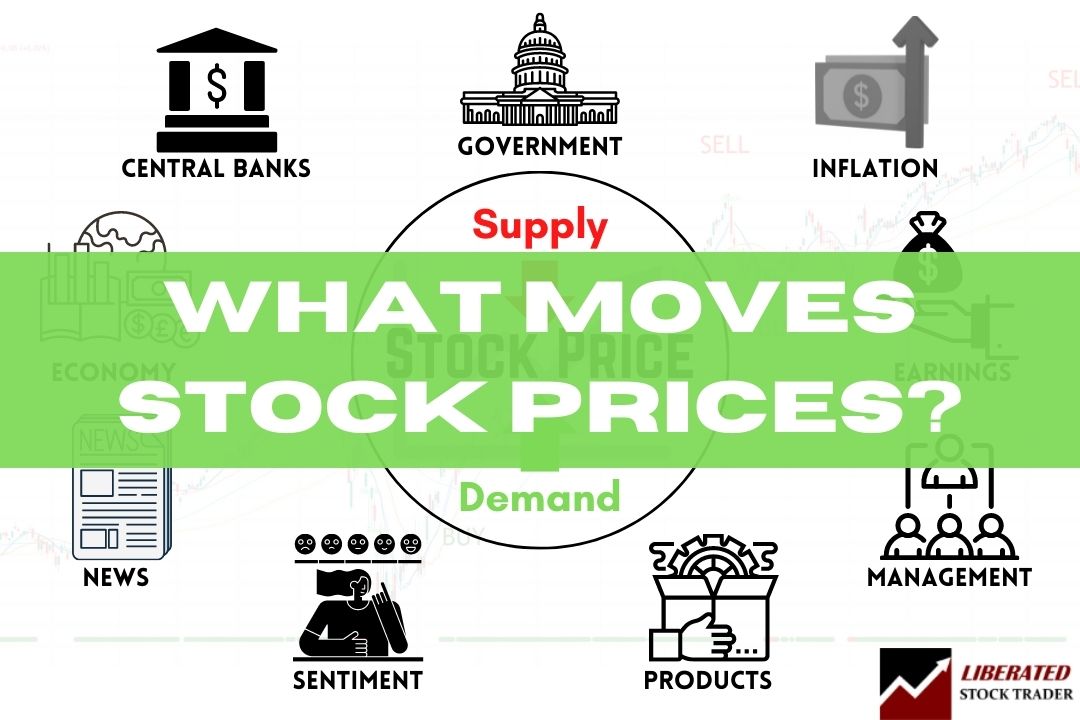
The prices of stocks are determined by the interactions of buyers and sellers in a free market. Stock prices constantly change as new information becomes available and investor expectations about the future change. Factors affecting stock prices are earnings reports, economic news, and government and central bank policy.| Liberated Stock Trader
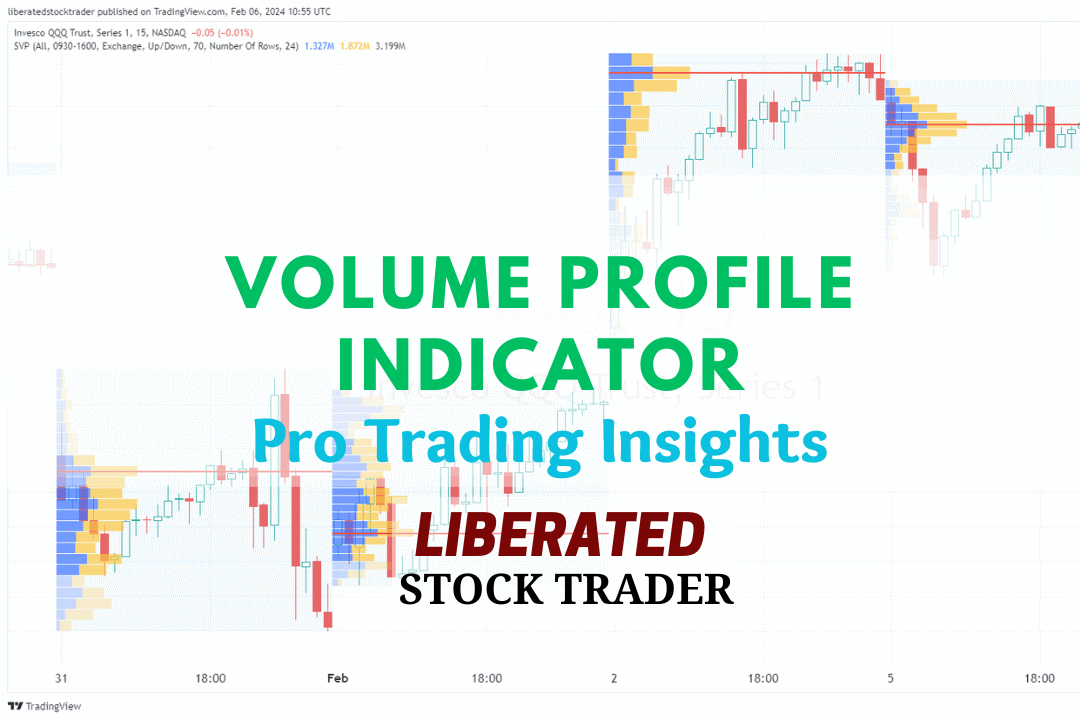
Volume profile technical analysis indicators provide a uniquely detailed overview of volume distribution across price levels, offering traders insights into market structure and supply and demand zones.| Liberated Stock Trader
The Hull Moving Average (HMA) is a highly responsive technical analysis indicator designed to reduce lag. Our research reveals it outperforms other moving averages.| Liberated Stock Trader