By allowing investors and analysts to measure the returns a company generates from its employed capital, ROCE serves as a magnifying glass over the business's operational effectiveness.| Liberated Stock Trader
Economic value added, or EVA is a sophisticated measure for assessing a company's financial performance and creating shareholder wealth by measuring the residual income after deducting the cost of capital.| Liberated Stock Trader
Chart indicators are tools traders use to attempt to predict the future direction of a stock's price. They are used to analyze historical data and trends, such as price, volume, and momentum, so traders can decide which stocks to buy or sell. Our research provides a unique analysis of the reliability, success rates, and how to trade the most important stock chart indicators.| Liberated Stock Trader
Total asset turnover is a financial metric used to assess a company's efficiency in using its assets to generate sales. It is a vital ratio for investors and analysts seeking to understand how well a company utilizes its asset base to produce revenue.| Liberated Stock Trader
The debt-to-capital ratio measures a company's financial stability and leverage by comparing its total debt to its capital base, including debt and equity. It provides insight into what proportion of a company's operations is financed by debt versus shareholders' equity.| Liberated Stock Trader
Operating Profit Margin, often represented as a ratio or percentage, reflects the proportion of revenue after accounting for the costs and expenses associated with a company's primary operations.| Liberated Stock Trader
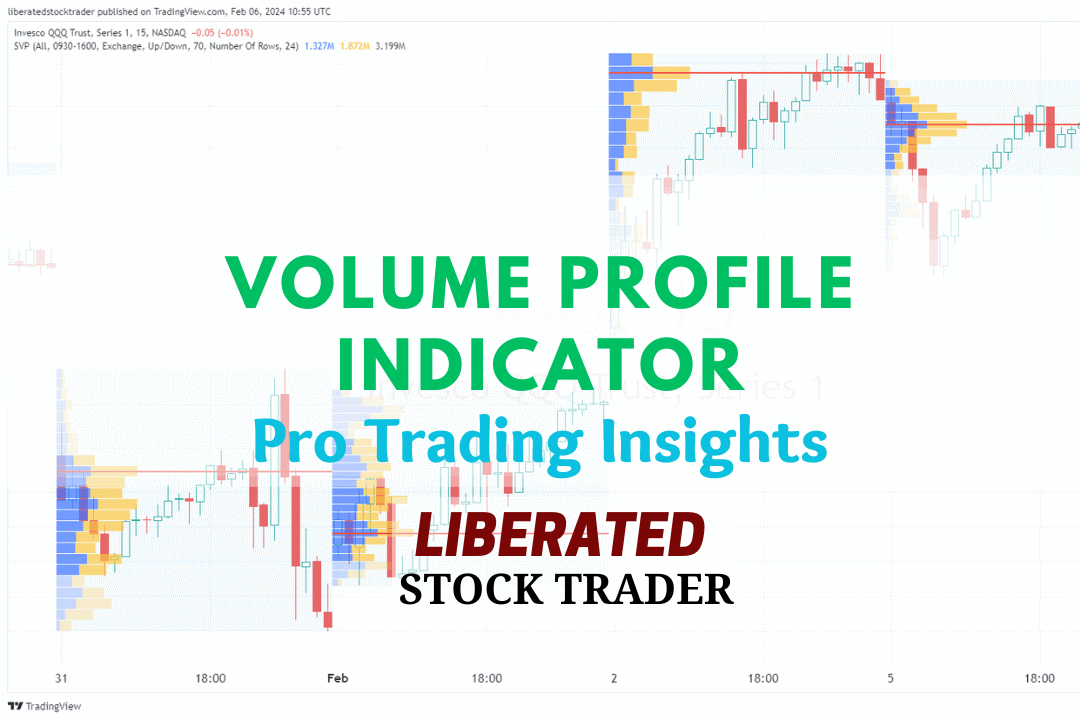
Volume profile technical analysis indicators provide a uniquely detailed overview of volume distribution across price levels, offering traders insights into market structure and supply and demand zones.| Liberated Stock Trader