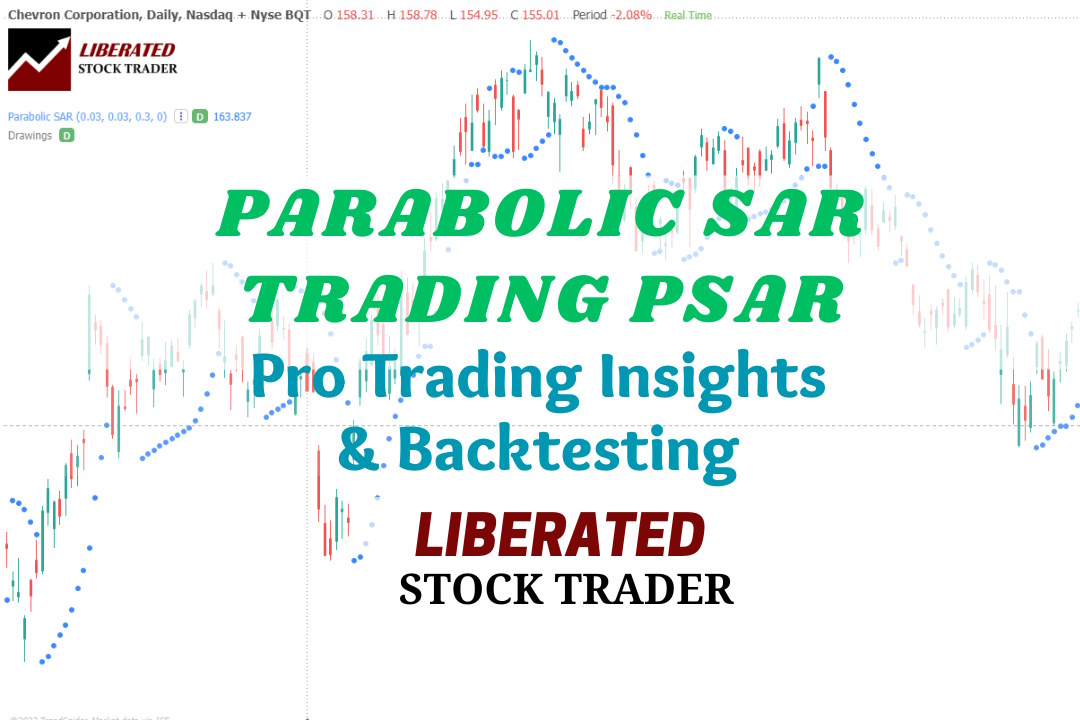
I backtested seven Parabolic SAR setups across 1-minute to daily charts for the DJ30 stocks over 12 years, resulting in over 2,880 years of test data. On standard charts, PSAR is not a profitable trading indicator. However, I did discover an incredibly profitable PSAR configuration.| Liberated Stock Trader
A buy signal is essentially an indicator or event that suggests it may be a good time to purchase a particular stock, whether based on technical data, chart patterns, or intrinsic value.| Liberated Stock Trader
My test trades yielded a 1.77 reward-to-risk ratio, with an average winning trade of 8.5%. Across a large sample, an ATR-based strategy yielded a small gain per trade, but it lost more often than it won and experienced significant drawdowns.| Liberated Stock Trader
Our ultimate guide to technical analysis, with its 14 videos and detailed examples covering charts, trends, indicators, patterns, and tools, will fast-track your knowledge.| Liberated Stock Trader
The mean reversion trading strategy suggests prices and returns eventually move back toward the mean or average. Reliable indicators like Stochastics, RSI, and Bollinger bands are based on mean reversion to identify overbought and oversold conditions.| Liberated Stock Trader
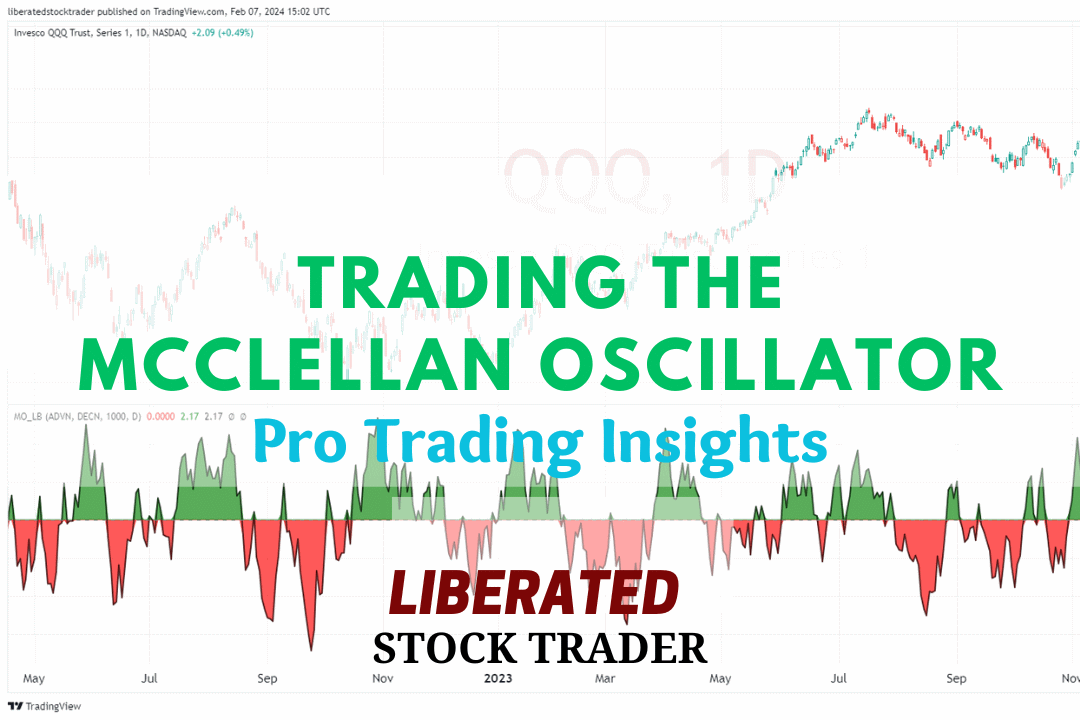
The McClellan Oscillator is a technical analysis tool designed to assess the market breadth of the New York Stock Exchange (NYSE). It is renowned for its effectiveness in revealing the underlying strength or weakness of the market by comparing the number of advancing to declining stocks.| Liberated Stock Trader
Renko charts filter out unnecessary price fluctuations to provide a clear stock price trend that traders can use in their investing strategies. Unlike a traditional bar or candlestick chart, Renko charts are based on price changes rather than time.| Liberated Stock Trader
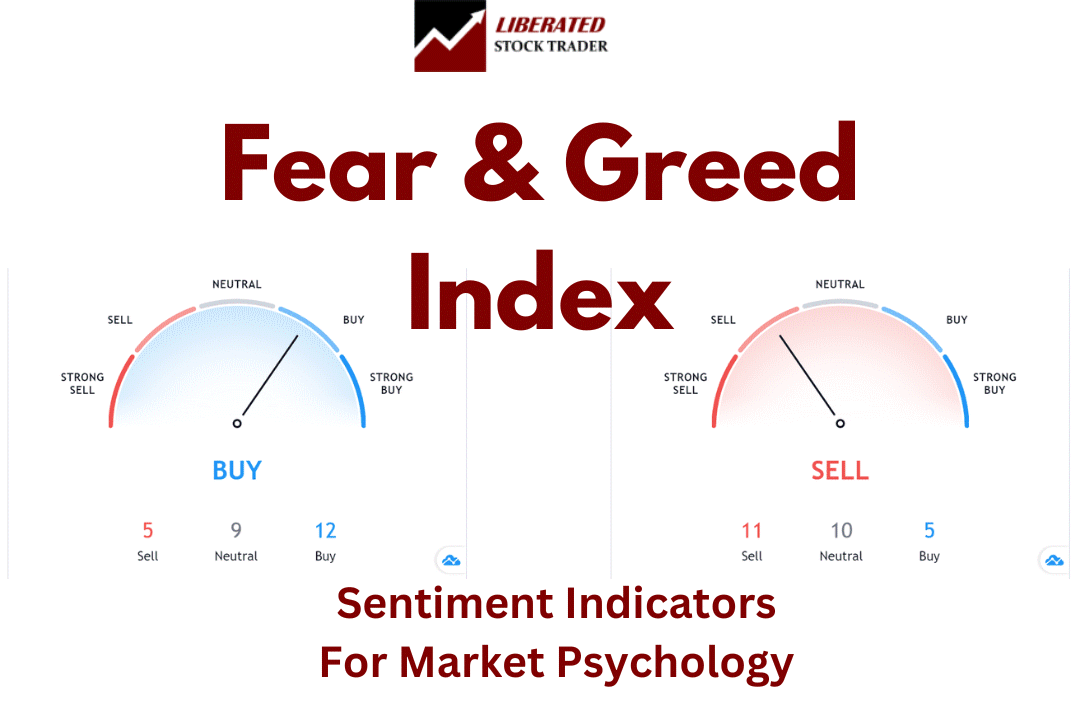
Our Fear and Greed Index goes beyond the basics, offering nine real-time and historical charts to help you stay ahead. With live data from the Federal Reserve, VIX CBOE, and 15 technical stock price signals, you'll have the tools to make smarter decisions today.| Liberated Stock Trader
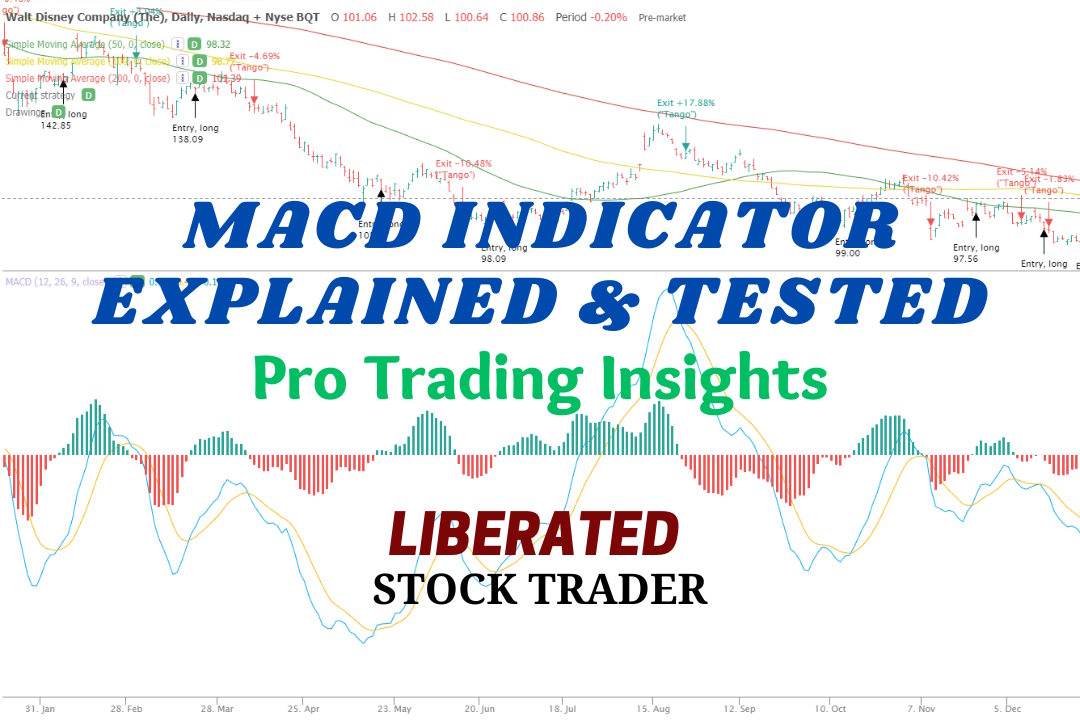
MACD is a trend-following momentum indicator used to identify price trends. We conducted 606,422 test trades to find the best settings and trading strategies.| Liberated Stock Trader
The simple moving average (SMA) technical analysis indicator helps identify stock price trends. It calculates an arithmetic average of prices, offering a smooth line that eliminates short-term price volatility.| Liberated Stock Trader
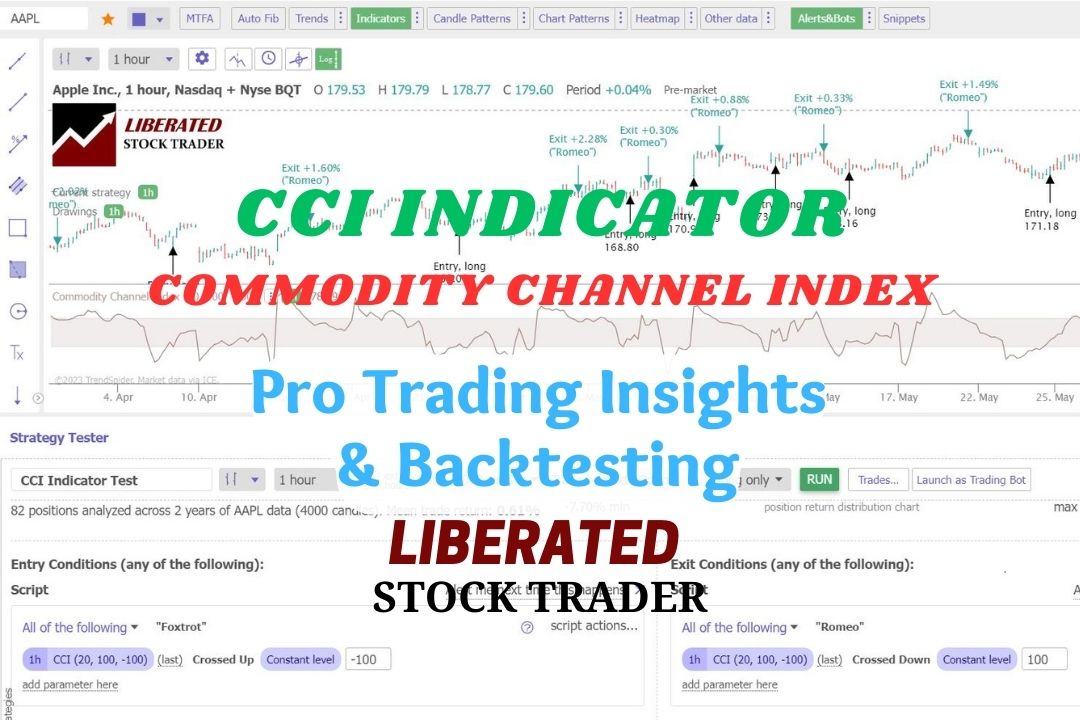
Based on 43,297 test trades, my research indicates that the CCI is a highly profitable momentum indicator, yielding a win rate of up to 85% when used with the correct settings.| Liberated Stock Trader
The best moving average settings are SMA or EMA 20 on a daily chart, which achieves a 23% win rate. At settings 50, 100, and 200, it is better to use the Hull moving average, which has win rates of 27%, 10%, and 17%, respectively.| Liberated Stock Trader