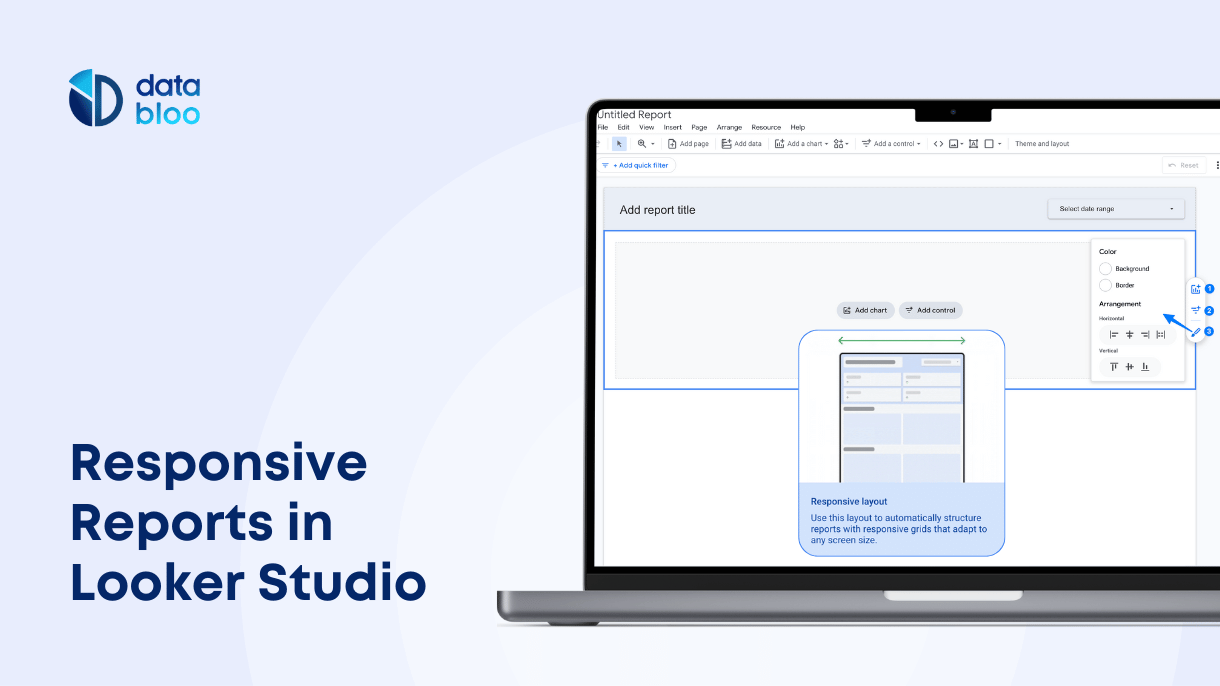
Learn how to create responsive reports in Looker Studio using mobile-friendly layouts and flexible sections to improve readability and performance across devices.| Data Bloo
Data Studio blog with tips and tricks to go your marketing reports to the next level. Check out our hacks and get up to speed with Google Data Studio today.| Data Bloo
Use Google Looker Studio charts to visualize your data and create top notch reports. Here are the most common preset charts and custom community visualizations.| Data Bloo
Learn how to use default and custom fonts, adjust themes, and apply dark mode or background images in Looker Studio to create professional and on-brand reports.| Data Bloo