
Detailed Gantt Chart Google Sheets Guide + 2 Free Templates
In this Gantt Chart Google Sheets tutorial, you'll learn to effectively manage teams and keep your projects on track or just use our Gantt chart template.| Spreadsheet Point
In this Gantt Chart Google Sheets tutorial, you'll learn to effectively manage teams and keep your projects on track or just use our Gantt chart template.| Spreadsheet Point
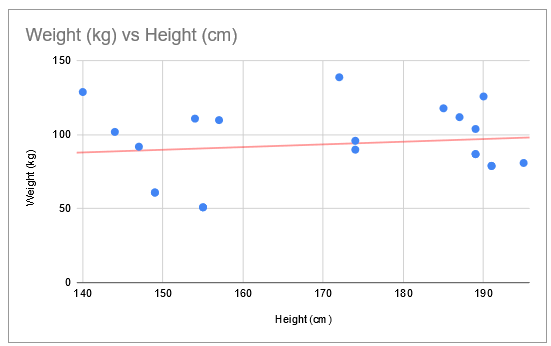
Find out how to make a scatter plot in Google Sheets here with this simple to follow step-by-step guide with screenshots.| Spreadsheet Point

Learn how to make a line graph in Google Sheets with a few clicks. This tutorial will also show you how to set up and customize the line chart easily| Spreadsheet Point

Learn how to make a bell curve in Google Sheets in a few simple steps with this quick and easy step-by-step guide.| Spreadsheet Point
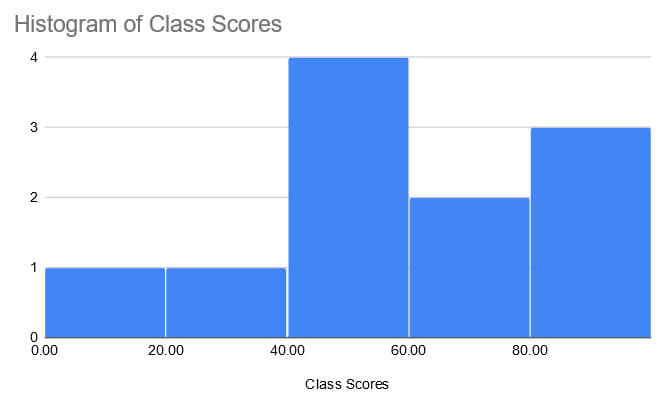
A Histogram will help you to visualize your data and make itmore digestible. This guide breaks down how to make a histogram in Google Sheets into an easy steps.| Spreadsheet Point

Spreadsheet programs can be pretty intimidating. But, Our list of Google Sheets tips will have you building sheets like a pro in no time.| Spreadsheet Point
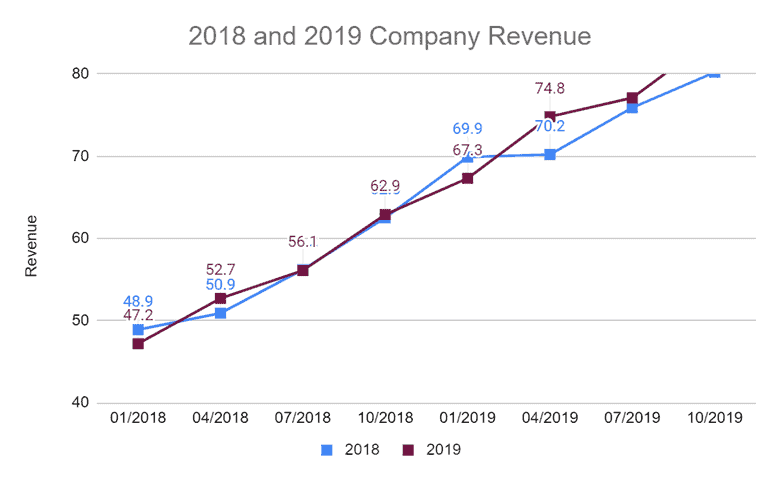
Wondering how to make a line graph in Google Sheets? This simple step-by-step tutorial will make it easy for you.| Productivity Spot

The correlation coefficient indicates how 2 variables are related. Learn how to use the CORREL function to perform correlation in Google Sheets.| Spreadsheet Point
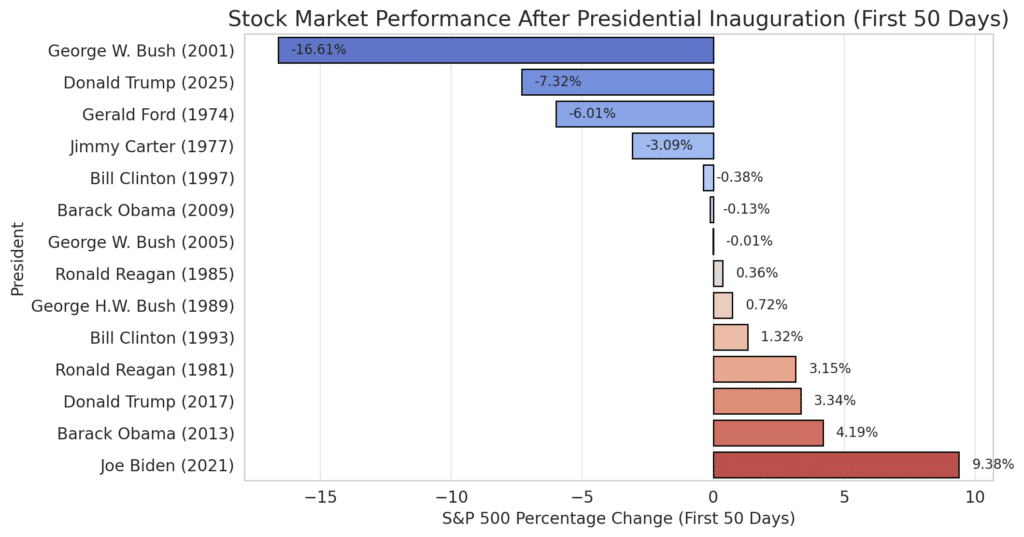
The response to Donald Trump’s second term has been one of the sharpest in recent history, one of the worst early-market performances for a modern U.S. president.| Spreadsheet Point

Follow this easy linear regression Google Sheets guide to learn how to perform regression calculations easily.| Spreadsheet Point
