Price action trading is a method of day trading that relies on technical analysis but ignores conventional fundamental indicators, focusing instead on the movement of prices.| Liberated Stock Trader
A buy signal is essentially an indicator or event that suggests it may be a good time to purchase a particular stock, whether based on technical data, chart patterns, or intrinsic value.| Liberated Stock Trader
Most AI trading tools do not use real AI machine learning and large language models. The majority of self-proclaimed AI trading tools are algorithmic and do not actually learn.| Liberated Stock Trader
As a Professional market analyst, I build effective trading strategies using techniques such as indicator divergences, multi-time frame analysis, indicator combinations, and rigorous backtesting.| Liberated Stock Trader
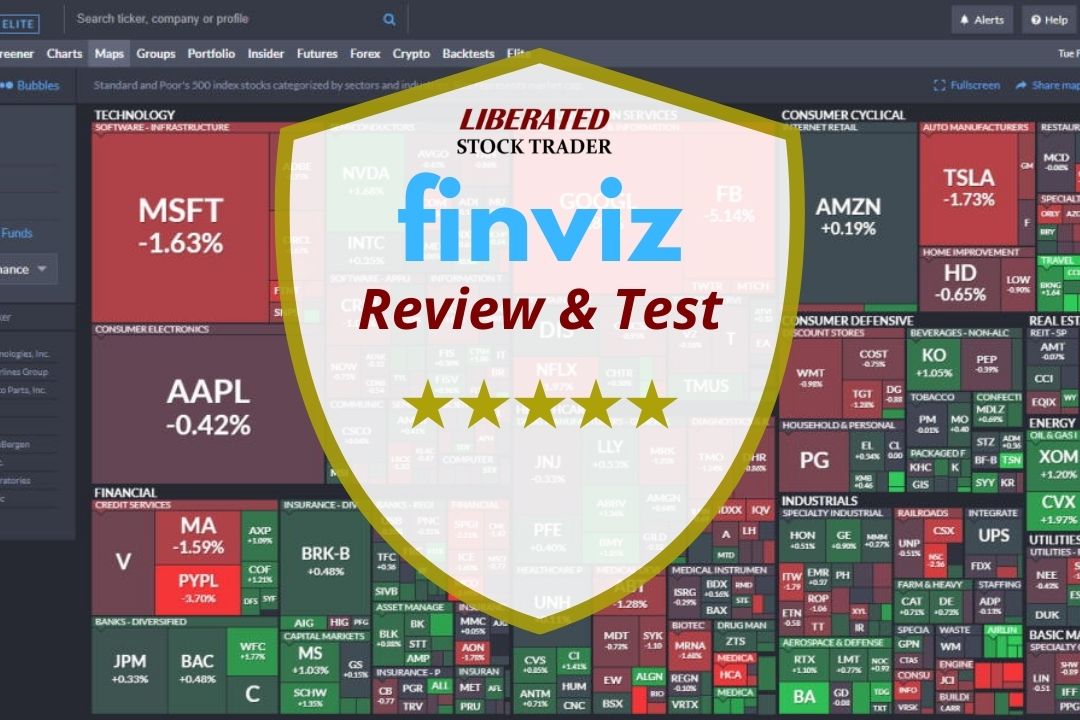
After hands-on testing, I found Finviz to be a powerful free stock screener, swift market heatmaps and impressive stock chart pattern recognition.| Liberated Stock Trader
My reliability testing of Bollinger Bands on the S&P 500, using 13,360 years of data, suggests it is an unprofitable indicator for traders. However, Bollinger Bands can be highly profitable, with the optimal settings.| Liberated Stock Trader
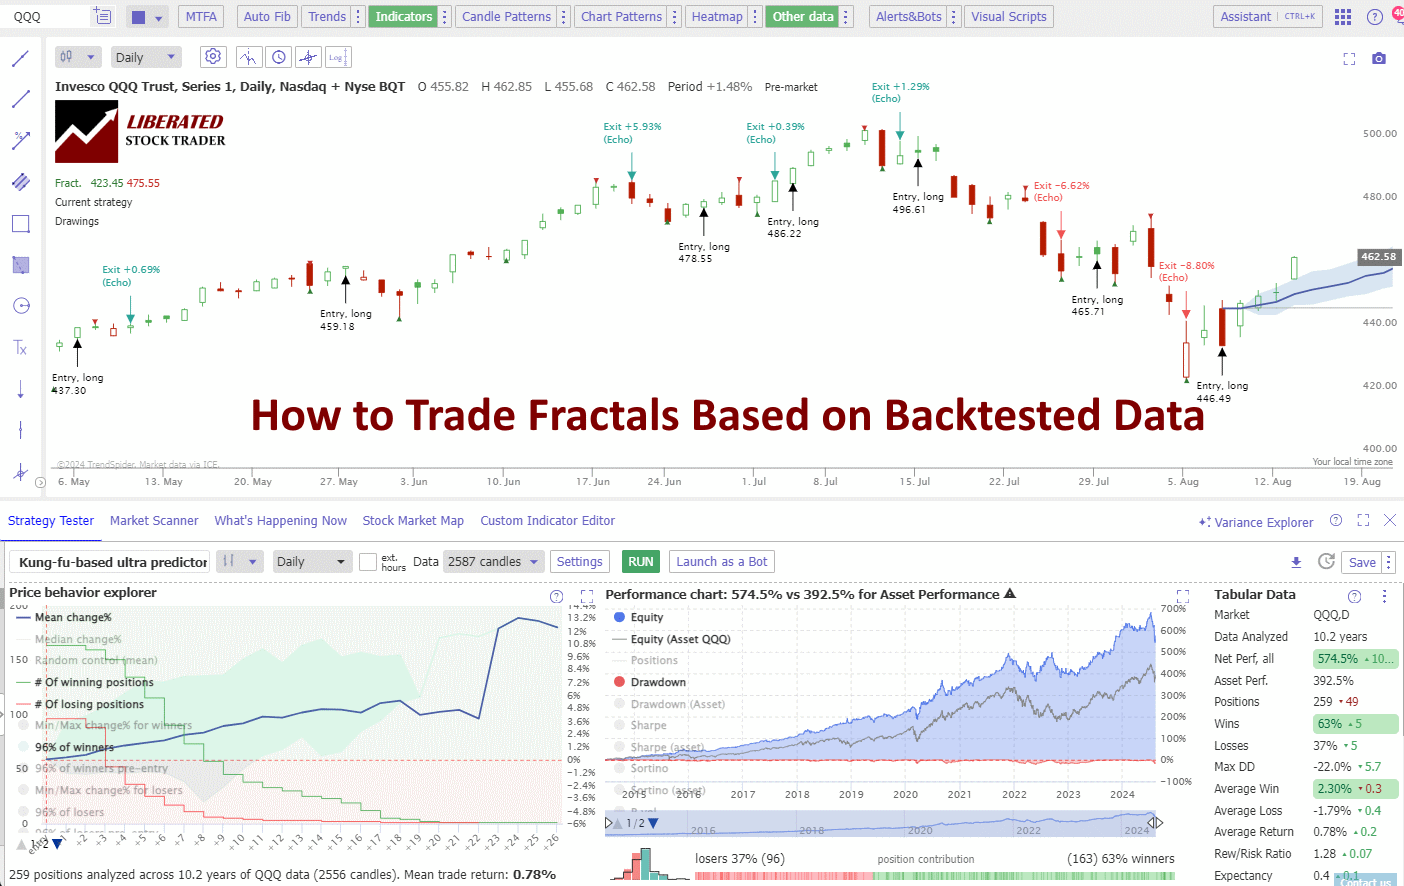
Based on 2,510 tested trades on 80 years of exchange data, I can confirm trading fractal patterns is profitable, with an average reward-to-risk ratio rate of 1.5 across all timescales.| Liberated Stock Trader
Using VWAP with a 14 setting on a daily Heikin Ashi chart is vastly superior to conventional OHLC charts. Using an OHLC chart, the strategy barely breaks even with a low-profit expectancy of 0.15. In contrast with a Heikin Ashi chart, the strategy is incredibly profitable, with a profit expectance of 0.83 and a reward-to-risk ratio of 3.03.| Liberated Stock Trader
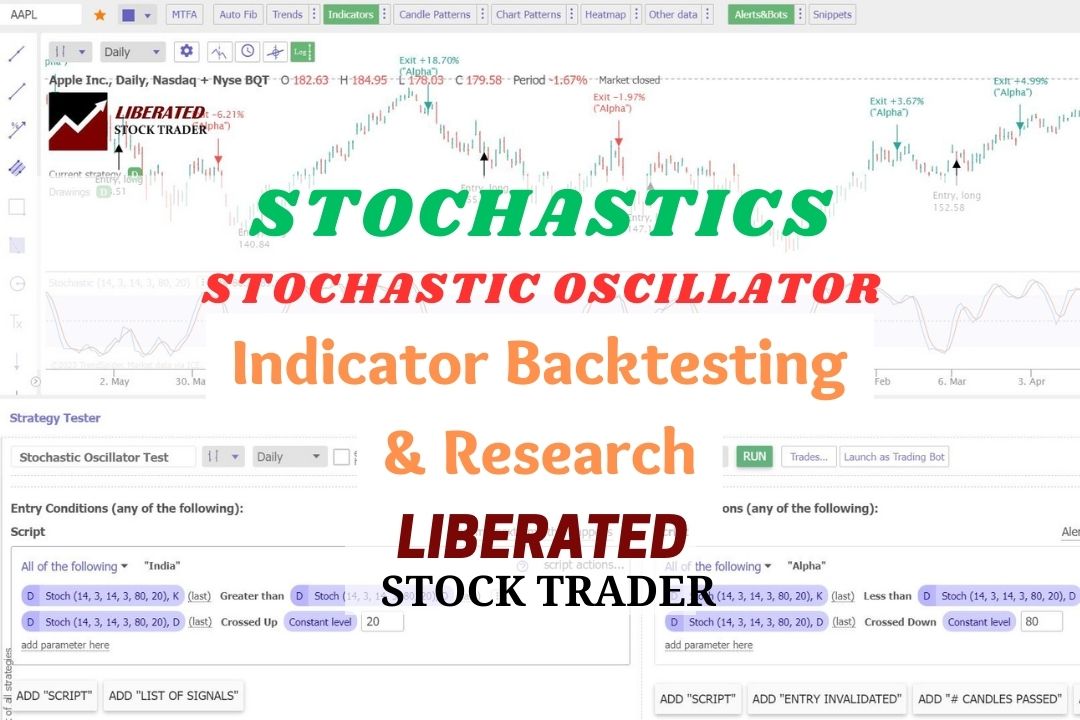
The Stochastic Oscillator momentum indicator compares an asset's closing price to a range of its previous prices. It oscillates between 0 and 100; below 20 indicates oversold, and above 80 suggests an overbought market.| Liberated Stock Trader
The best moving average settings are SMA or EMA 20 on a daily chart, which achieves a 23% win rate. At settings 50, 100, and 200, it is better to use the Hull moving average, which has win rates of 27%, 10%, and 17%, respectively.| Liberated Stock Trader