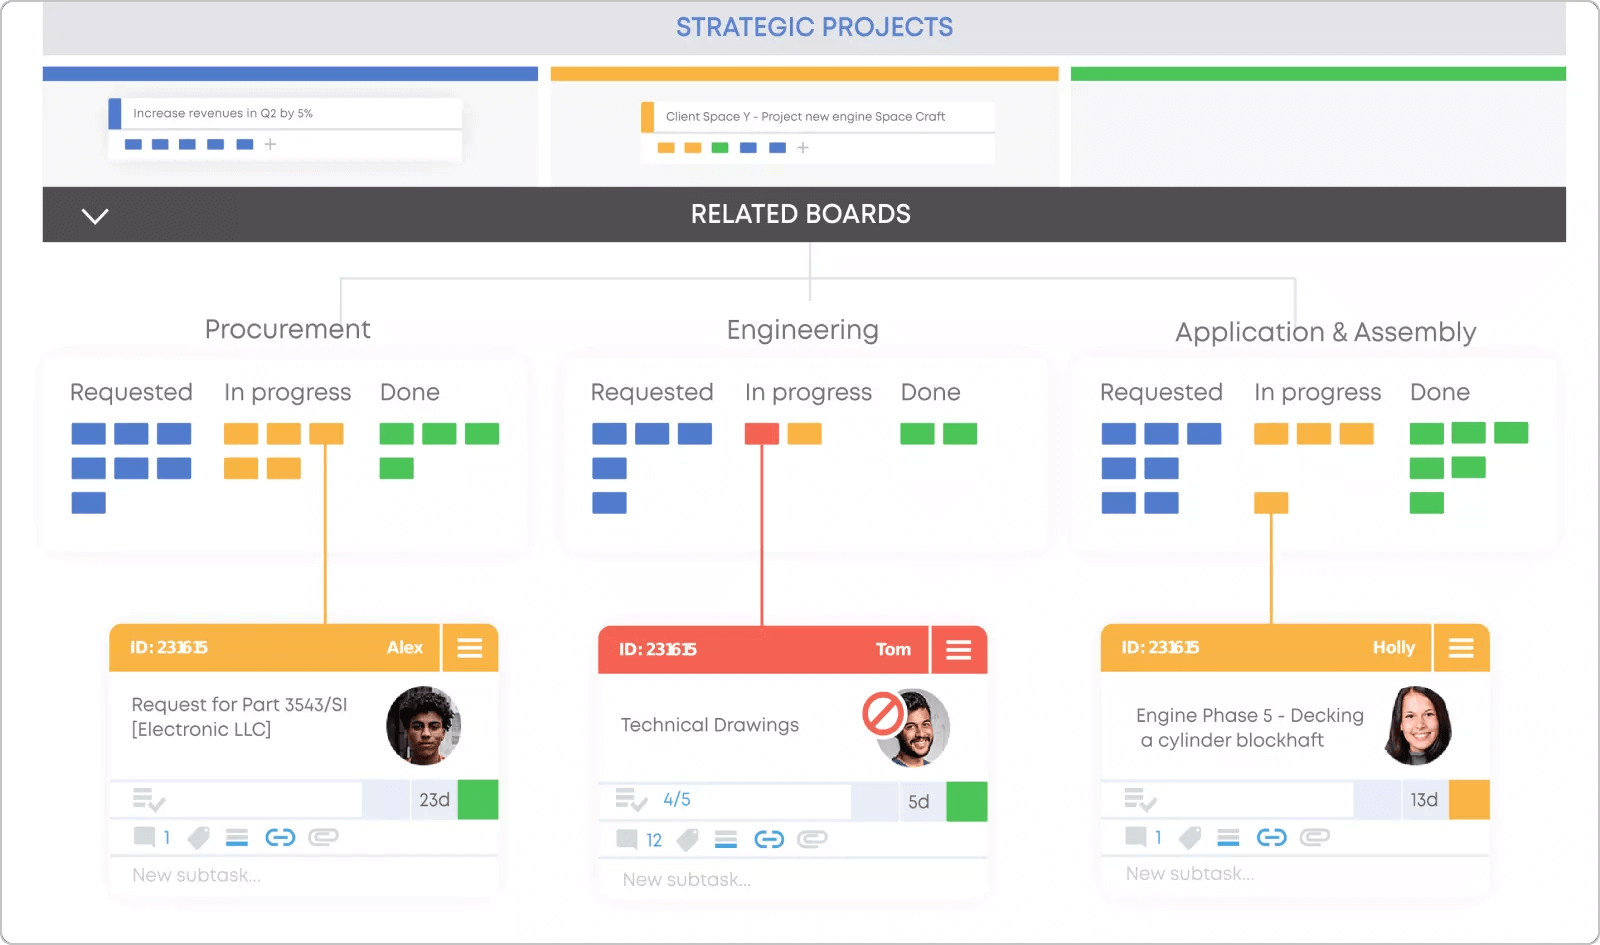
Agile portfolio management is a large-scale approach to organizing and executing a portfolio of projects, products, and initiatives. Discover how it is different than traditional portfolio management and how to implement it across your organization.| Kanban Software for Agile Project Management
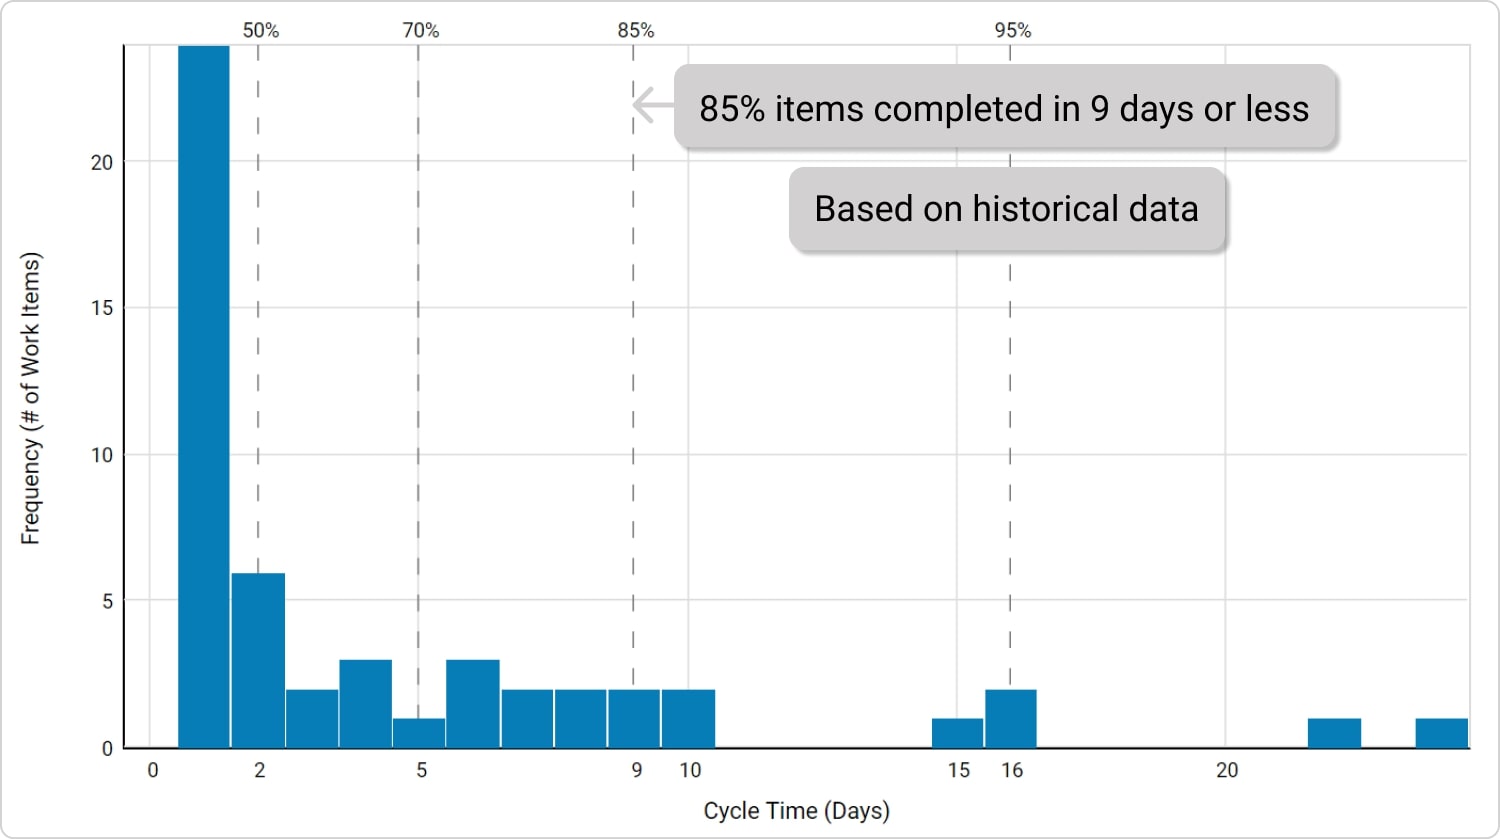
The Cycle Time Histogram provides you with actionable data that you can use to measure the predictability of your process. Learn more about how to use it and its benefits it in our guide.| Kanban Software for Agile Project Management
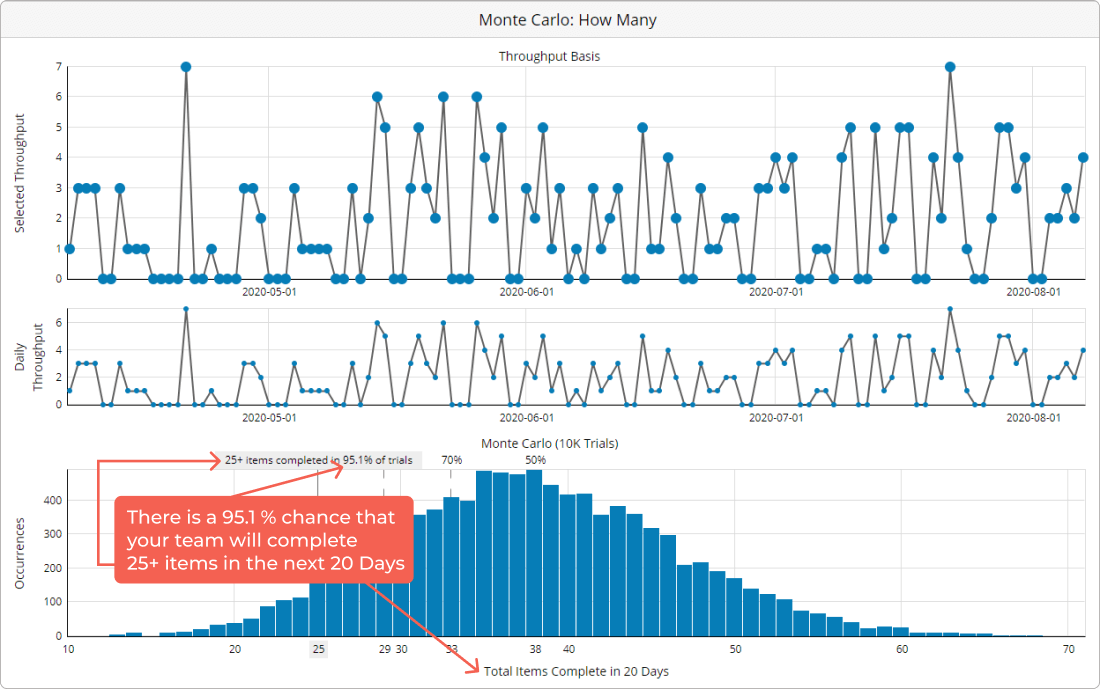
Monte Carlo simulations are invaluable for anticipating future throughput in Lean project management. Learn how they work and why you should use them.| Kanban Software for Agile Project Management
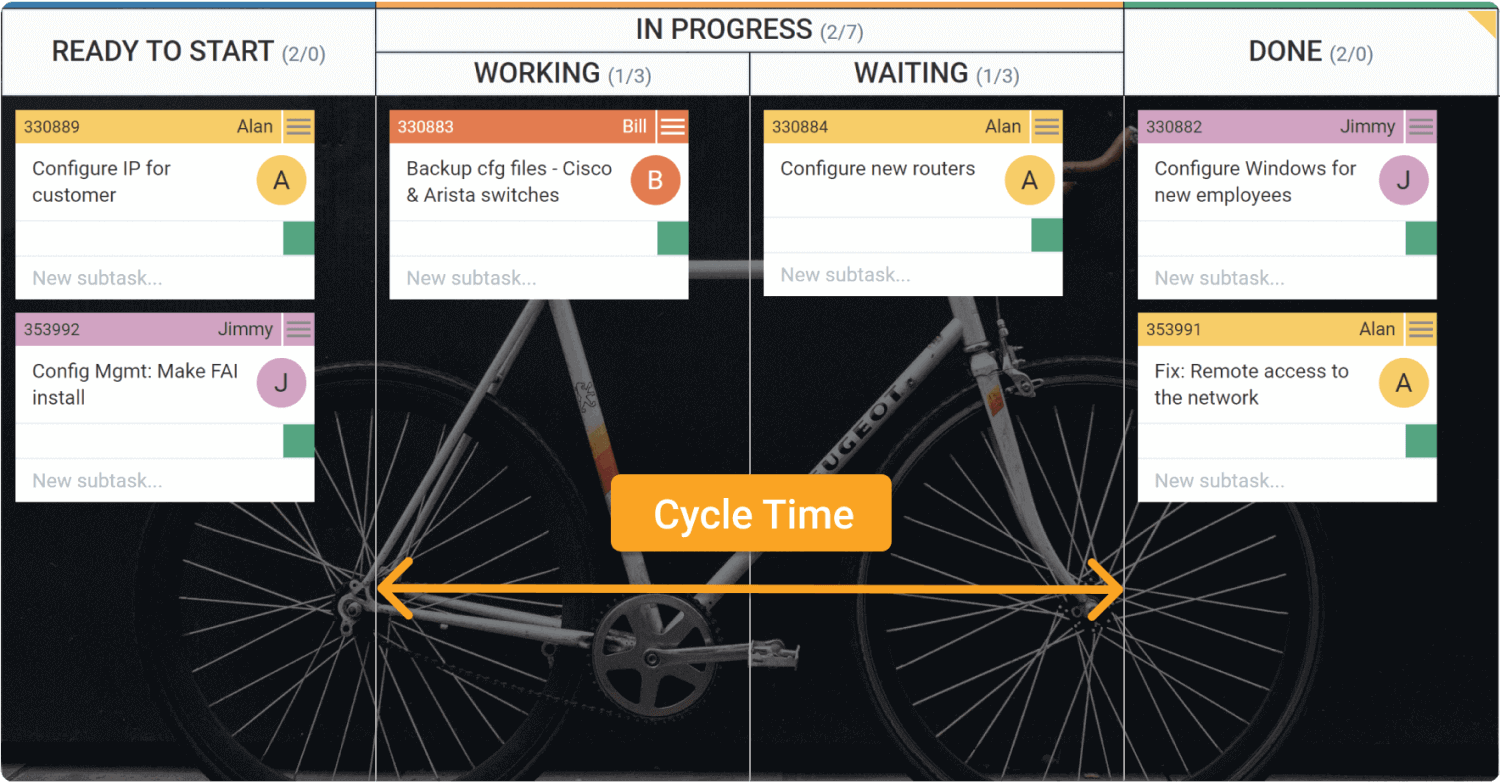
Cycle time is a vital metric that helps businesses enhance their productivity, identify process bottlenecks, and optimize delivery time. Get to know its definition, how to calculate it, how it differs from other essential flow metrics, and more.| Kanban Software for Agile Project Management
The scatter diagram is a two-dimensional graphical representation of a set of data widely used to show the correlation between two variables. Learn the basics and benefits that define the importance of a scatter diagram in our practical guide.| Kanban Software for Agile Project Management