

Learn how to make a line graph in Google Sheets with a few clicks. This tutorial will also show you how to set up and customize the line chart easily| Spreadsheet Point

Learn how to make a bar graph in Google Sheets. We cover every type of bar chart you can make and you can go through the entire guide in under 10 minutes!| Spreadsheet Point
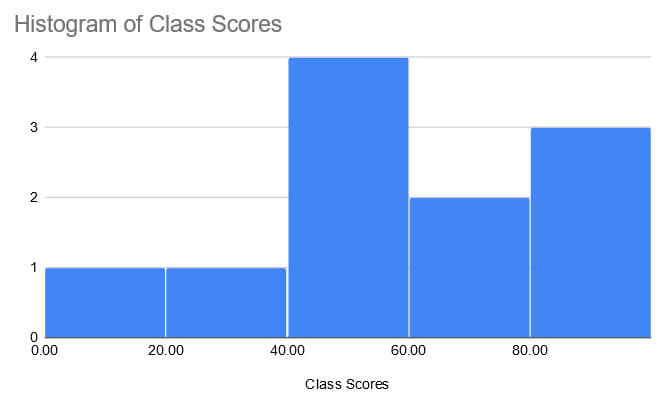
A Histogram will help you to visualize your data and make itmore digestible. This guide breaks down how to make a histogram in Google Sheets into an easy steps.| Spreadsheet Point
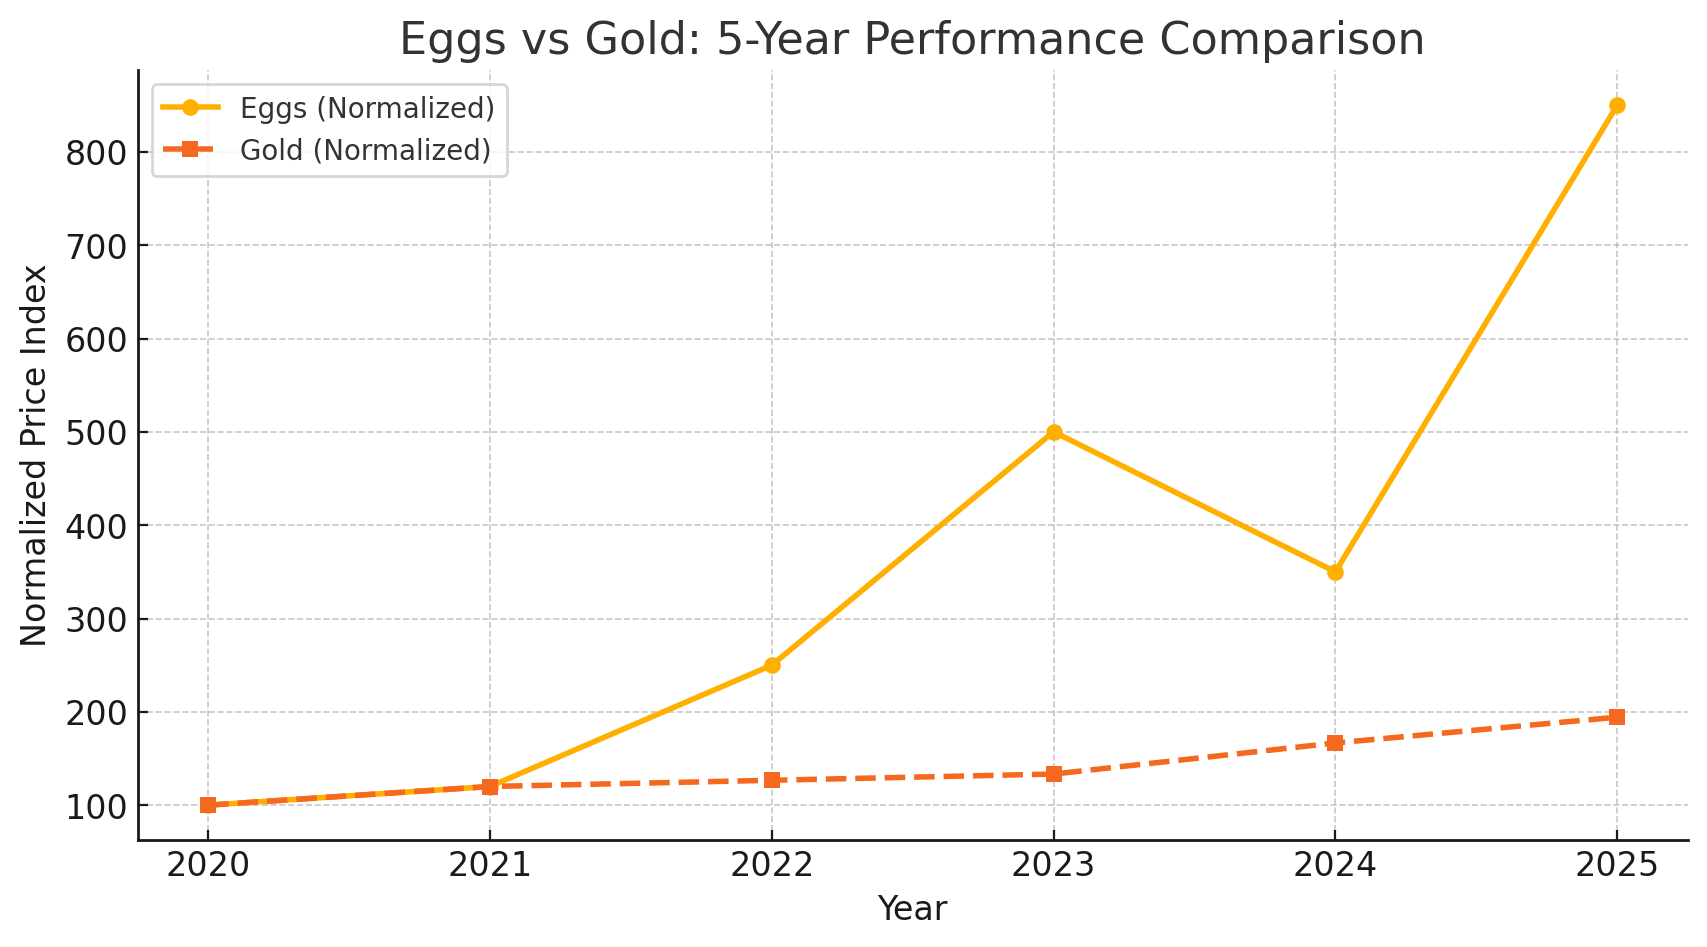
If you had invested in eggs instead of gold in 2020, your returns would have been nearly ten times higher. It sounds ridiculous, but the data doesn’t lie. A data scientist evaluated the data.| Spreadsheet Point