How to Make a Scatter Plot in Google Sheets: Easy 2024 Guide
Find out how to make a scatter plot in Google Sheets here with this simple to follow step-by-step guide with screenshots.| Spreadsheet Point
Find out how to make a scatter plot in Google Sheets here with this simple to follow step-by-step guide with screenshots.| Spreadsheet Point

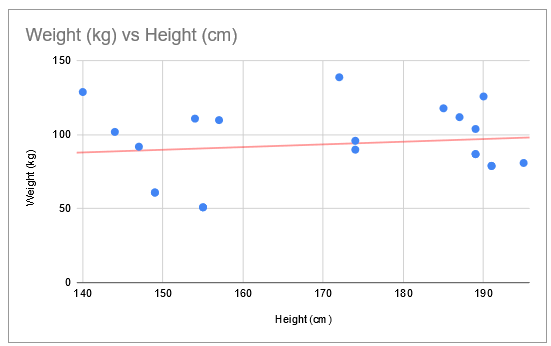
Scatter plots are hard to interpret without a trend line. Find out how to add a line of best fit in Google Sheets to make your data more readable.| Spreadsheet Point

The Google Sheets FORECAST function is a tool that lets you analyze past or current trends to predict future values. Read this tutorial to learn more about this function.| Spreadsheet Point
