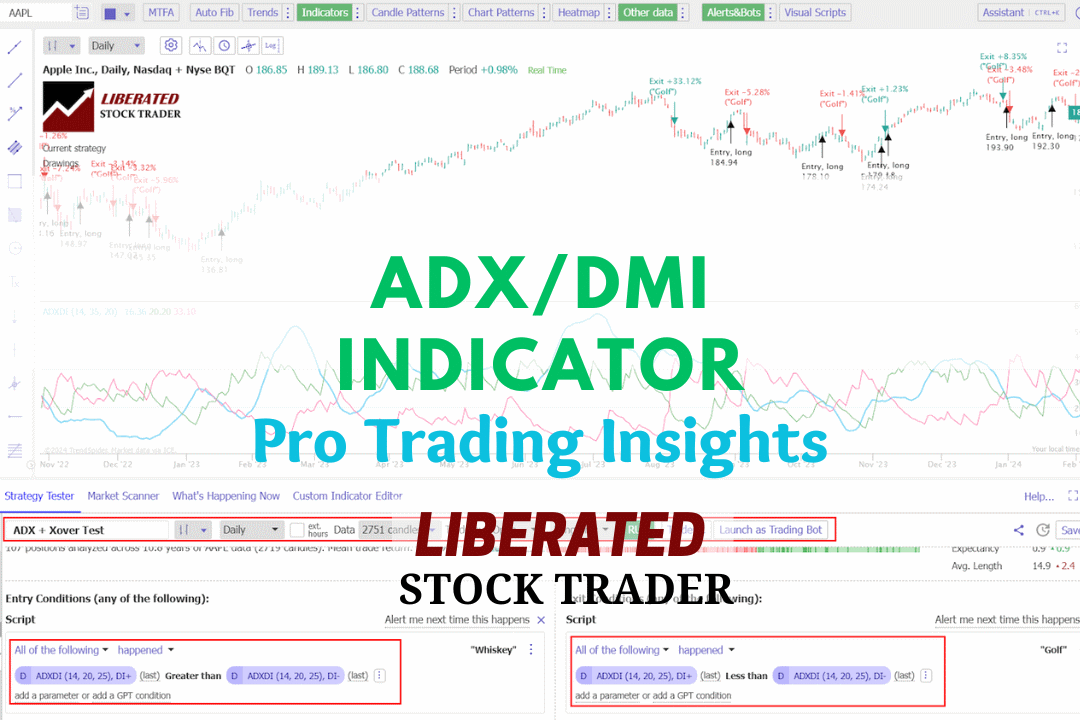
My testing, based on 9,764 trades over 25 years, demonstrates that the DMI indicator is both profitable and reliable, outperforming the S&P 500 index. Here's how to trade it based on the data.| Liberated Stock Trader
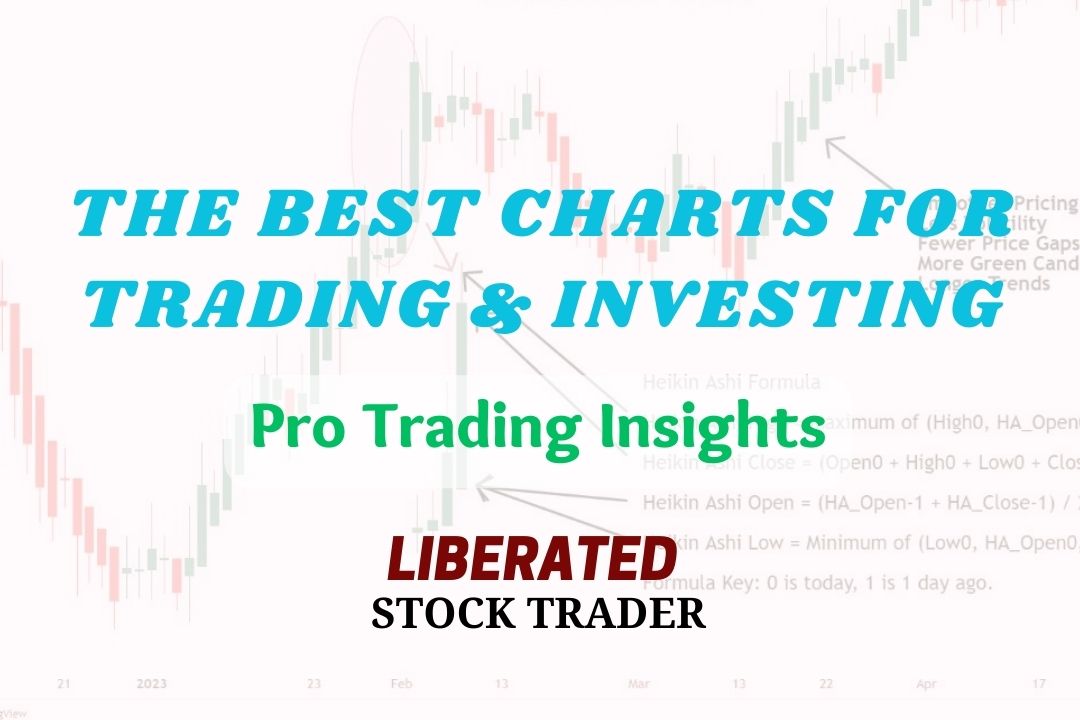
My research indicates that the most effective chart types for traders are Heikin-Ashi, Candlestick, OHLC, Raindrop, and Renko charts. These charts provide the optimal balance of price and trend reversal information to help investors develop effective trading strategies.| Liberated Stock Trader
My testing shows the best TradingView indicators for advanced analysis are Volume Profile HD, VWAP, Supertrend, ATR, Relative Volatility, and RSI. TradingView's candlestick and chart pattern recognition algorithms are game changers for improving trading outcomes.| Liberated Stock Trader
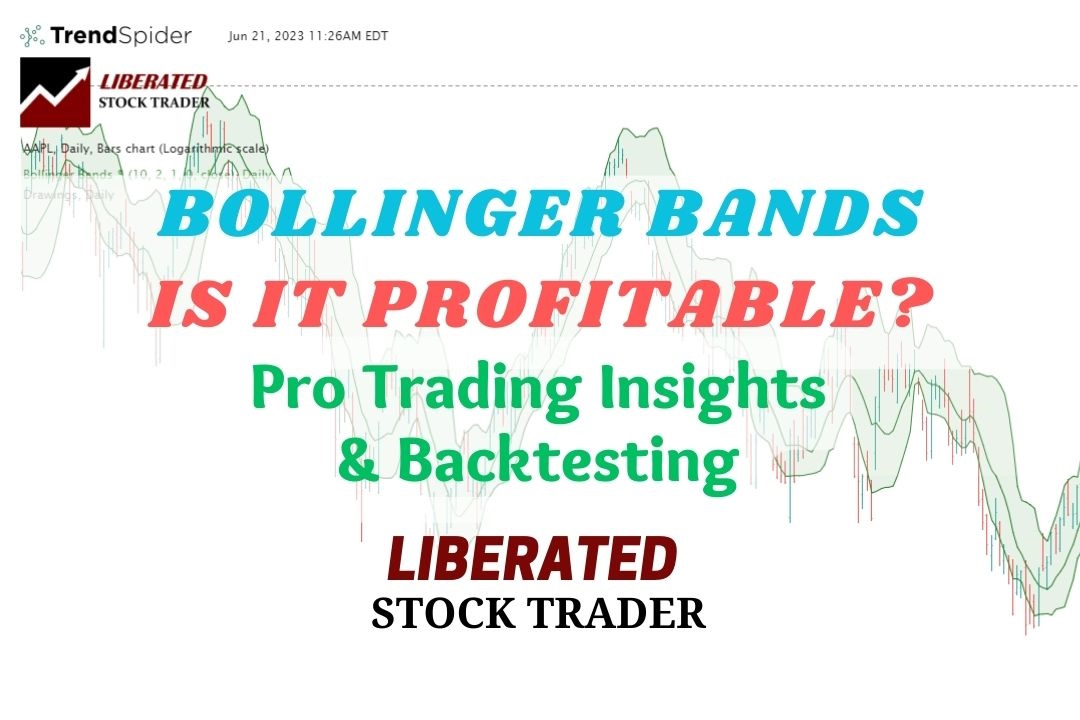
My reliability testing of Bollinger Bands on the S&P 500, using 13,360 years of data, suggests it is an unprofitable indicator for traders. However, Bollinger Bands can be highly profitable, with the optimal settings.| Liberated Stock Trader
Using VWAP with a 14 setting on a daily Heikin Ashi chart is vastly superior to conventional OHLC charts. Using an OHLC chart, the strategy barely breaks even with a low-profit expectancy of 0.15. In contrast with a Heikin Ashi chart, the strategy is incredibly profitable, with a profit expectance of 0.83 and a reward-to-risk ratio of 3.03.| Liberated Stock Trader
The best moving average settings are SMA or EMA 20 on a daily chart, which achieves a 23% win rate. At settings 50, 100, and 200, it is better to use the Hull moving average, which has win rates of 27%, 10%, and 17%, respectively.| Liberated Stock Trader