
How to Make a Pareto Chart in Google Sheets [Step-by-Step]
This tutorial shows you how to create a Pareto chart in Google Sheets with a simple step-by-step example.| Spreadsheet Point
This tutorial shows you how to create a Pareto chart in Google Sheets with a simple step-by-step example.| Spreadsheet Point

To make a pie chart in Google Sheets, go to the "insert" menu and choose charts. This guide includes screenshots, video, and other pie-guidance.| Spreadsheet Point

Let’s take a look at the Google Sheets FREQUENCY function, how it works, when you’d use it, and when you might want to use something else.| Spreadsheet Point
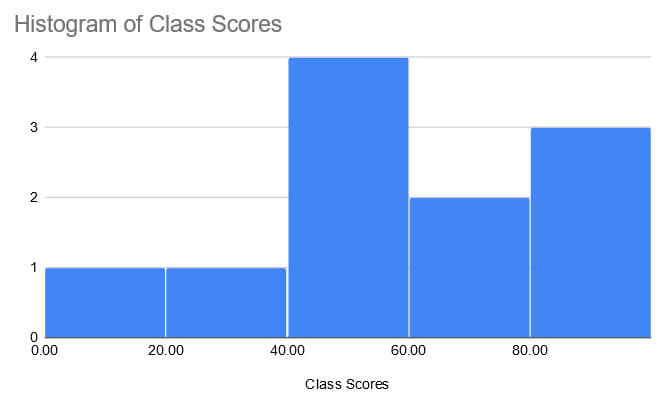
A Histogram will help you to visualize your data and make itmore digestible. This guide breaks down how to make a histogram in Google Sheets into an easy steps.| Spreadsheet Point

This full standard deviation Google Sheets guide covers everything you need to know about the built in functions that find standard deviation.| Spreadsheet Point

Scatter plots are hard to interpret without a trend line. Find out how to add a line of best fit in Google Sheets to make your data more readable.| Spreadsheet Point
