
How to Make a Dot Plot in Google Sheets [Step-by-Step]
Although it does not feature a dot plot maker, here's a workaround on how to make a dot plot in Google Sheets easily and quickly.| Spreadsheet Point
Although it does not feature a dot plot maker, here's a workaround on how to make a dot plot in Google Sheets easily and quickly.| Spreadsheet Point

While Google Sheets are great if you want to use it as a data analysis tool with charts/graphs, many times you would have a need to download these charts are| Spreadsheet Point

Here's a complete guide for building, editing, and customizing Google Sheets Charts for all your needs.| Spreadsheet Point

In this Gantt Chart Google Sheets tutorial, you'll learn to effectively manage teams and keep your projects on track or just use our Gantt chart template.| Spreadsheet Point

How exactly do you tell whether a Wes Anderson film is successful? Let's look at the data.| Spreadsheet Point
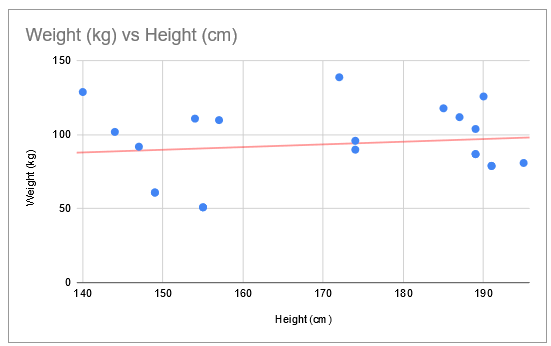
Find out how to make a scatter plot in Google Sheets here with this simple to follow step-by-step guide with screenshots.| Spreadsheet Point

Learn how to make a line graph in Google Sheets with a few clicks. This tutorial will also show you how to set up and customize the line chart easily| Spreadsheet Point
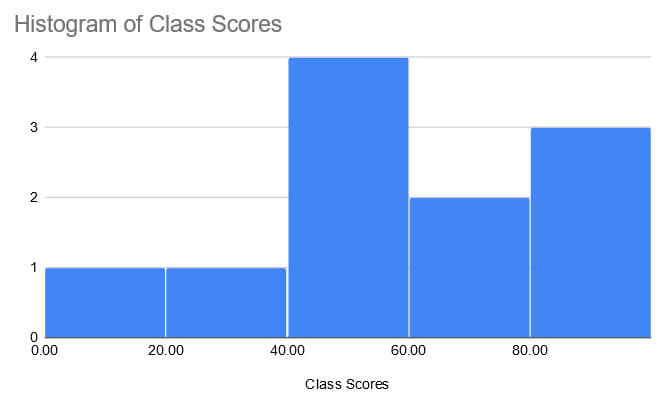
A Histogram will help you to visualize your data and make itmore digestible. This guide breaks down how to make a histogram in Google Sheets into an easy steps.| Spreadsheet Point

In this tutorial, learn how to quickly add error bars in Google Sheets. You can easily ass these to columns charts, line charts, or area charts| Spreadsheet Point

Scatter plots are hard to interpret without a trend line. Find out how to add a line of best fit in Google Sheets to make your data more readable.| Spreadsheet Point
