
Mastering Prometheus Relabeling: A Comprehensive Guide | Last9
A comprehensive guide to relabeling strategies in Prometheus| Last9
Documentation for VictoriaMetrics, VictoriaLogs, Operator, Managed VictoriaMetrics and vmanomaly| docs.victoriametrics.com
The horizontally scalable, highly available, multi-tenant, long term storage solution for Prometheus and OpenTelemetry Metrics.| Cortex
Access and understand performance metrics for nodes in a database cluster.| docs.digitalocean.com
Access and understand performance metrics for nodes in a database cluster.| docs.digitalocean.com
Access and understand performance metrics for nodes in a database cluster.| docs.digitalocean.com
Access and understand performance metrics for nodes in a database cluster.| docs.digitalocean.com
A comprehensive guide to relabeling strategies in Prometheus| Last9

An open-source monitoring system with a dimensional data model, flexible query language, efficient time series database and modern alerting approach.| prometheus.io

Explore Prometheus Remote Write: scale your monitoring effortlessly. Learn how it works, its benefits, and top tips for cloud-native setups.| last9.io
An open-source monitoring system with a dimensional data model, flexible query language, efficient time series database and modern alerting approach.| prometheus.io
Status: Mixed Overview Status: Stable The OpenTelemetry data model for metrics consists of a protocol specification and semantic conventions for delivery of pre-aggregated metric timeseries data. The data model is designed for importing data from existing systems and exporting data into existing systems, as well as to support internal OpenTelemetry use-cases for generating Metrics from streams of Spans or Logs. Popular existing metrics data formats can be unambiguously translated into the Ope...| OpenTelemetry
An open-source monitoring system with a dimensional data model, flexible query language, efficient time series database and modern alerting approach.| prometheus.io
An open-source monitoring system with a dimensional data model, flexible query language, efficient time series database and modern alerting approach.| prometheus.io
An open-source monitoring system with a dimensional data model, flexible query language, efficient time series database and modern alerting approach.| prometheus.io
Cortex can be configured using a YAML file - specified using the -config.file flag - or CLI flags. In case you combine both, CLI flags take precedence over the YAML config file. The current configuration of any Cortex component can be seen by visiting the /config HTTP path. Passwords are filtered out of this endpoint. Reference To specify which configuration file to load, pass the -config.file flag at the command line.| Cortex
With contributions from Rynn Mancuso (Honeycomb) and Reese Lee (New Relic). On Thursday, May 25th, 2023, the OpenTelemetry (OTel) End User Working Group hosted its third End User Q&A session of 2023. We had a bit of a gap due to KubeCon Europe, but now we’re back! This series is a monthly casual discussion with a team using OpenTelemetry in production. The goal is to learn more about their environment, their successes, and the challenges that they face, and to share it with the community, s...| OpenTelemetry
An open-source monitoring system with a dimensional data model, flexible query language, efficient time series database and modern alerting approach.| prometheus.io

controller-runtime exposes a metrics server by default on port 8080 for any controller Manager. Metrics are registered for the client, workqueue, and on a per-controller basis. Controllers initialize metrics when started, and write to the registry at various points throughout operation, such as when processing items off the workqueue and after completed reconciliation loops. If you are using a framework like Kubebuilder, it will generate manifests for the necessary objects, such as a ServiceM...| danielmangum.com
)
- tl;dr - My cluster-wide prometheus scraping config was picking up port 25 as a good place to send GET /metrics requests, and broke my surprisingly fragile email setup (Haraka -> Maddy), simply by inundating it with invalid HTTP requests to a port meant for SMTP. My mailer setup makes use of two pretty good F/OSS tools that I rarely have problems with: Haraka Maddy They work great, and I don’t spend much time thinking about them – I often set up a new maddy instance with separate backups...| vadosware.io
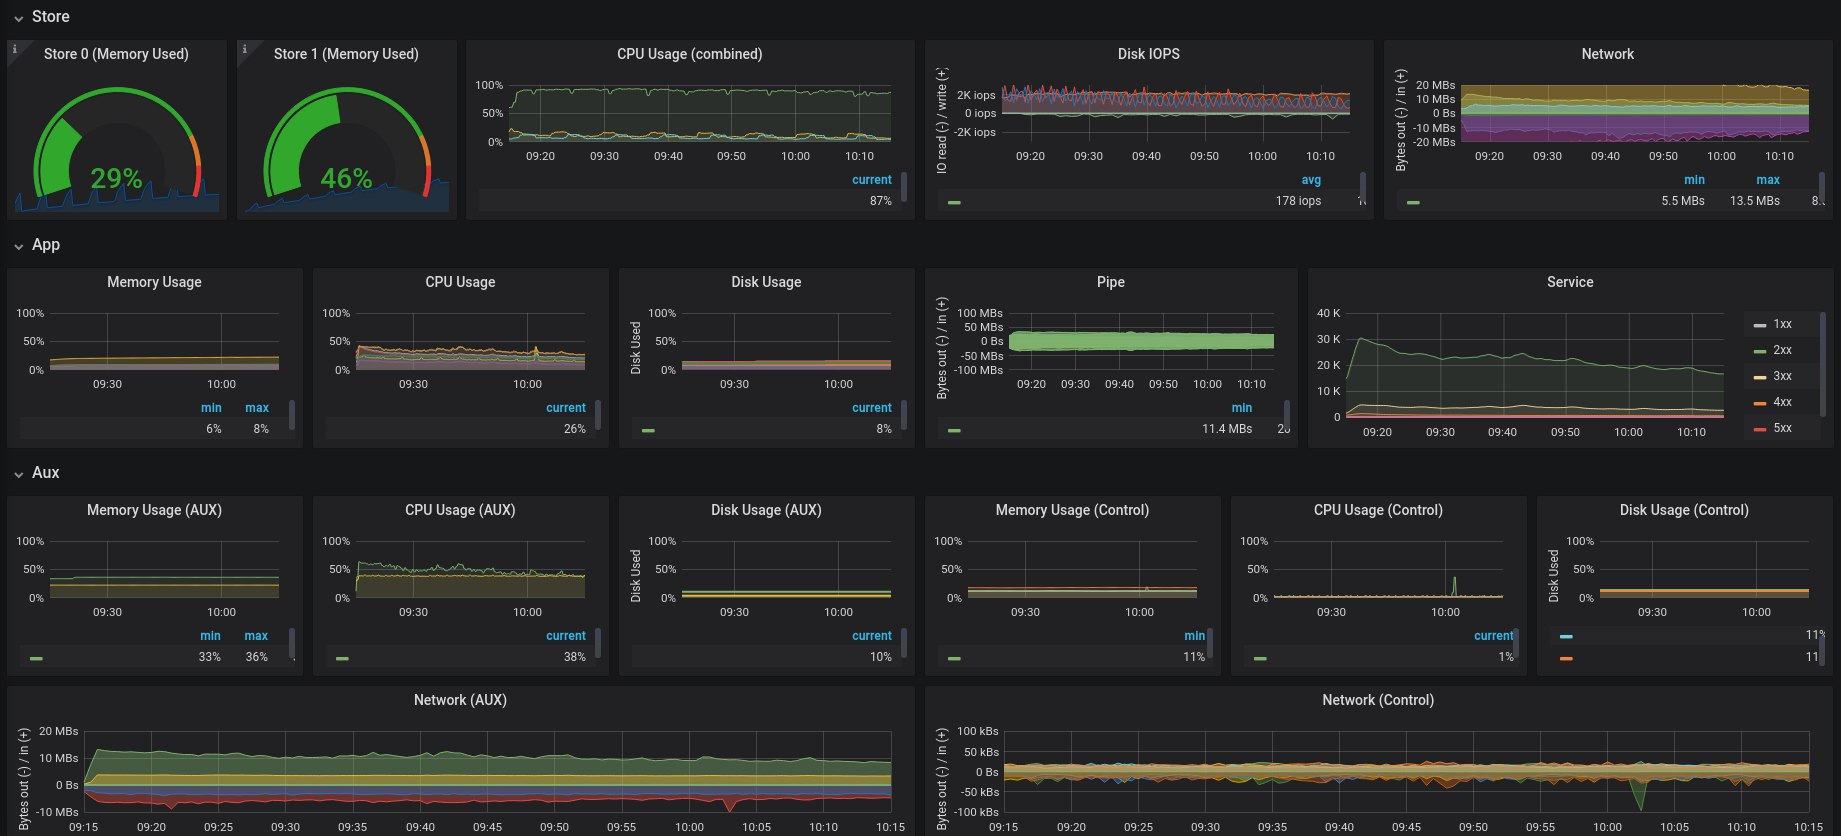
How we developed a hybrid multi-DC and cloud monitoring stack with Prometheus, Grafana, and Victoria metrics for monitoring system, app and service, and also business metrics.| zerodha.tech