July 2025 – Economist Writing Every Day
10 posts published by James Bailey, Jeremy Horpedahl, Scott Buchanan, mdmakowsky, Joy Buchanan, and Zachary Bartsch during July 2025| Economist Writing Every Day
10 posts published by James Bailey, Jeremy Horpedahl, Scott Buchanan, mdmakowsky, Joy Buchanan, and Zachary Bartsch during July 2025| Economist Writing Every Day
According to the Current Population Survey 2023 ASEC Supplement, there are some 133.1M married adults age 15+ in the U.S., not counting 4.6M who are separated.| Census.gov
In election years, the Current Population Survey collects data on reported voting and registration, and later reports stats by turnout, age, race and origin.| Census.gov
Presents text and figures that describe statistical findings on an education-related topic.| nces.ed.gov

The pay gap between men and women has barely closed in the past two decades, even as women today are more likely than men to have graduated from college, suggesting other factors are at play.| Pew Research Center
Source: 2020 Survey of Income and Program Participation.| Census.gov
The 2021 American Community Survey estimated there were 55,892,014 people aged 65 and over in the U.S. out of a total population of 331,893,745, or 16.8%.| Census.gov

Today, the U.S. Census Bureau released findings from the Educational Attainment in the United States: 2019 table package.| Census.gov
View characteristics about the population 65 and older for each state in 2021, including median age, veteran status, labor force participation, and more.| Census.gov
The U.S. Census Bureau today announced that real median household income increased by 4.0% between 2022 and 2023.| Census.gov
The Household Pulse Survey is designed to deploy quickly and efficiently to measure how emergent social and economic issues are impacting U.S. households.| Census.gov

In recent years, Black educational attainment has been much closer to the national average: 88% have a high school diploma. Gaps remain in college attainment.| Census.gov

The unauthorized immigrant population in the U.S. grew to 11 million in 2022, but remained below the peak of 12.2 million in 2007.| Pew Research Center
Beginning in July 2021, the U.S. Census Bureau included questions regarding sexual orientation and gender identity (SOGI) on it's Household Pulse Survey (HPS).| Census.gov
This graphic show the Hispanic or Latino Population as percent of county total population.| Census.gov
A new report released by the U.S. Census Bureau shows the average one-way commute in the United States increased to a new high of 27.6 minutes in 2019.| Census.gov
The Small Area Income and Poverty Estimates (SAIPE) program provides more current estimates for the administration and allocation of federal programs and funds.| Census.gov

Barely 10 years past the end of the Great Recession in 2009, the U.S. economy is doing well on several fronts. The labor market is on a job-creating| Pew Research Center

In 2022, 19% of American workers were in jobs that are the most exposed to artificial intelligence, in which the most important activities may be either replaced or assisted by AI. Women, Asian, college-educated and higher-paid workers have more exposure to AI, but workers in the most exposed industries are more likely to say AI will help more than hurt them personally.| Pew Research Center
The U.S. Census Bureau announced today that real median household income in 2022 fell in comparison to 2021.| Census.gov

Most U.S. young adults are at least mostly financially independent and happy with their parents' involvement in their lives. Parent-child relationships are mostly strong.| Pew Research Center
These Households tables are on Families and Living Arrangements.| Census.gov
This paper examines the impact of the expanded Child Tax Credit on child poverty.| Census.gov

Among married couples in the U.S., women’s financial contributions have grown steadily over the last half century. Even when earnings are similar, husbands spend more time on paid work and leisure, while wives devote more time to caregiving and housework.| Pew Research Center
Tabulations of all surnames occurring 100 or more times in the 2010 Census returns. No specific individual information is provided.| Census.gov
Provides data concerning families, household composition, educational attainment, health insurance coverage, income sources, poverty, geographic mobility.| Census.gov
The Current Population Survey (CPS) is one of the oldest, largest, and most well-recognized surveys in the United States.| Census.gov

New U.S. Census Bureau data product shows changes in reasons for moving and types of moves between 2021 and 2022.| Census.gov
The Current Population Survey (CPS) estimates there were 9.8M one-parent households (7.3M mother only and 2.5M father only) in 2023, compared to 1.5M in 1950.| Census.gov
Tabulations of establishment openings/closings, firm startups/shutdowns, and job creation/destruction, with unique information on firm age and firm size.| Census.gov
In 2022, about 132.3 million or 49.3% of Americans age 15 and over were unmarried, according to the Current Population Survey.| Census.gov

The tensions introduced by the prominence of a still partially medieval institution in modern society can only be resolved in two possible ways: the creation of institutions of education and knowledge production on a more modern model; or a partial neo-feudalization of the modalities, if not the class structure, of modern society, a process already underway...| American Affairs Journal
Statistics on revenue, expenditure, debt, and assets (cash and security holdings) for governments.| Census.gov
Nationally, public school spending per student experienced the largest fiscal year-to-year increase since 2008, up 6.3% to $14,347.| Census.gov
View high-propensity business applications and their quarter-to-quarter changes.| Census.gov

The American Community Survey releases new data every year, in the form of estimates, in a variety of tables, tools, and analytical reports.| Census.gov
Median age at first marriage since 1890, as well as marital status by sex.| Census.gov
We measure poverty two ways every year. The official poverty measure is based on cash resources. The supplemental poverty measure includes noncash benefits.| Census.gov
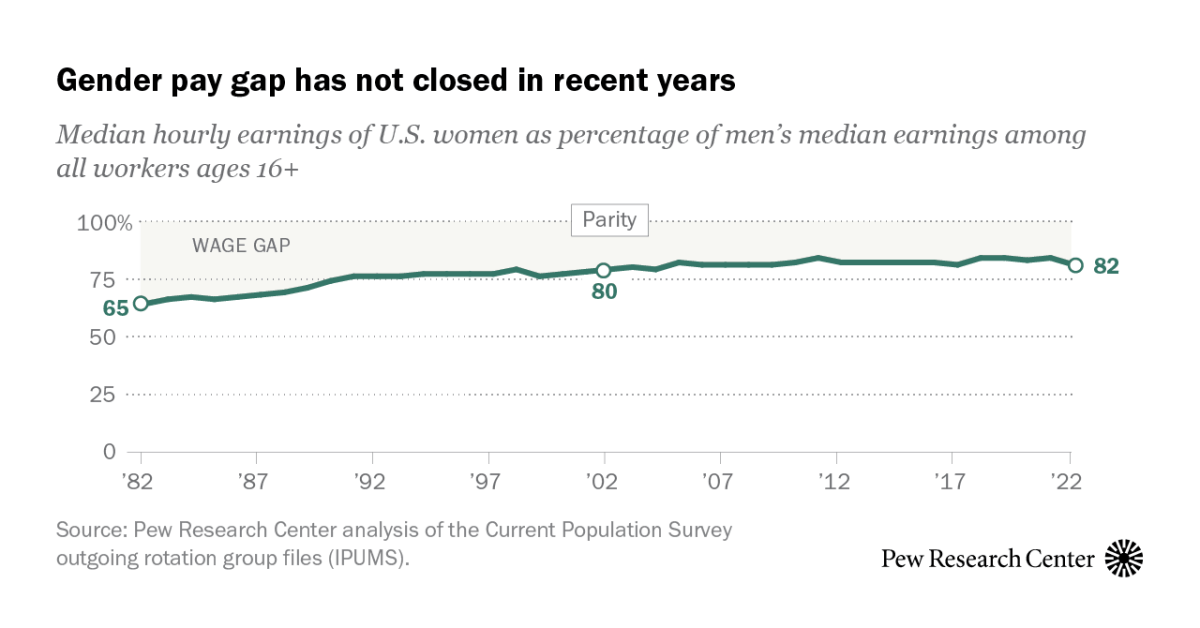
In 2022, women earned an average of 82% of what men earned, according to a new analysis of median hourly earnings of full- and part-time workers.| Pew Research Center
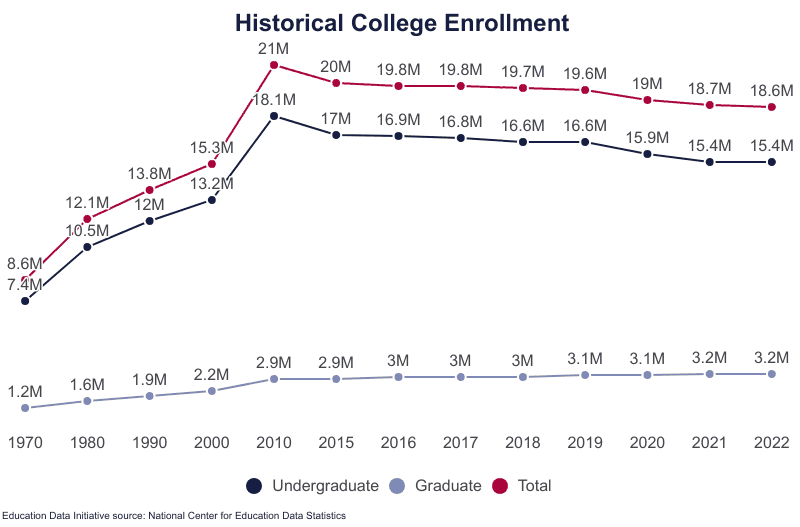
College enrollment statistics for U.S. postsecondary institutions broken down by state, race, ethnicity, gender, age and degree.| Education Data Initiative

In 2021, child poverty rates measured by Supplemental Poverty Measure were the lowest since 2009 for all race and Hispanic origin categories examined.| Census.gov
