
Google unveils AI updates for Workspace collaboration suite – Computerworld
The company announced a variety of AI-based upgrades to Workspace, its suite of collaboration tools and applications for business users.| Computerworld
The company announced a variety of AI-based upgrades to Workspace, its suite of collaboration tools and applications for business users.| Computerworld
Create a table chart using the Google charts API that’s included in wpDataTables Table WordPress plugin.| wpDataTables - Tables and Charts WordPress Plugin
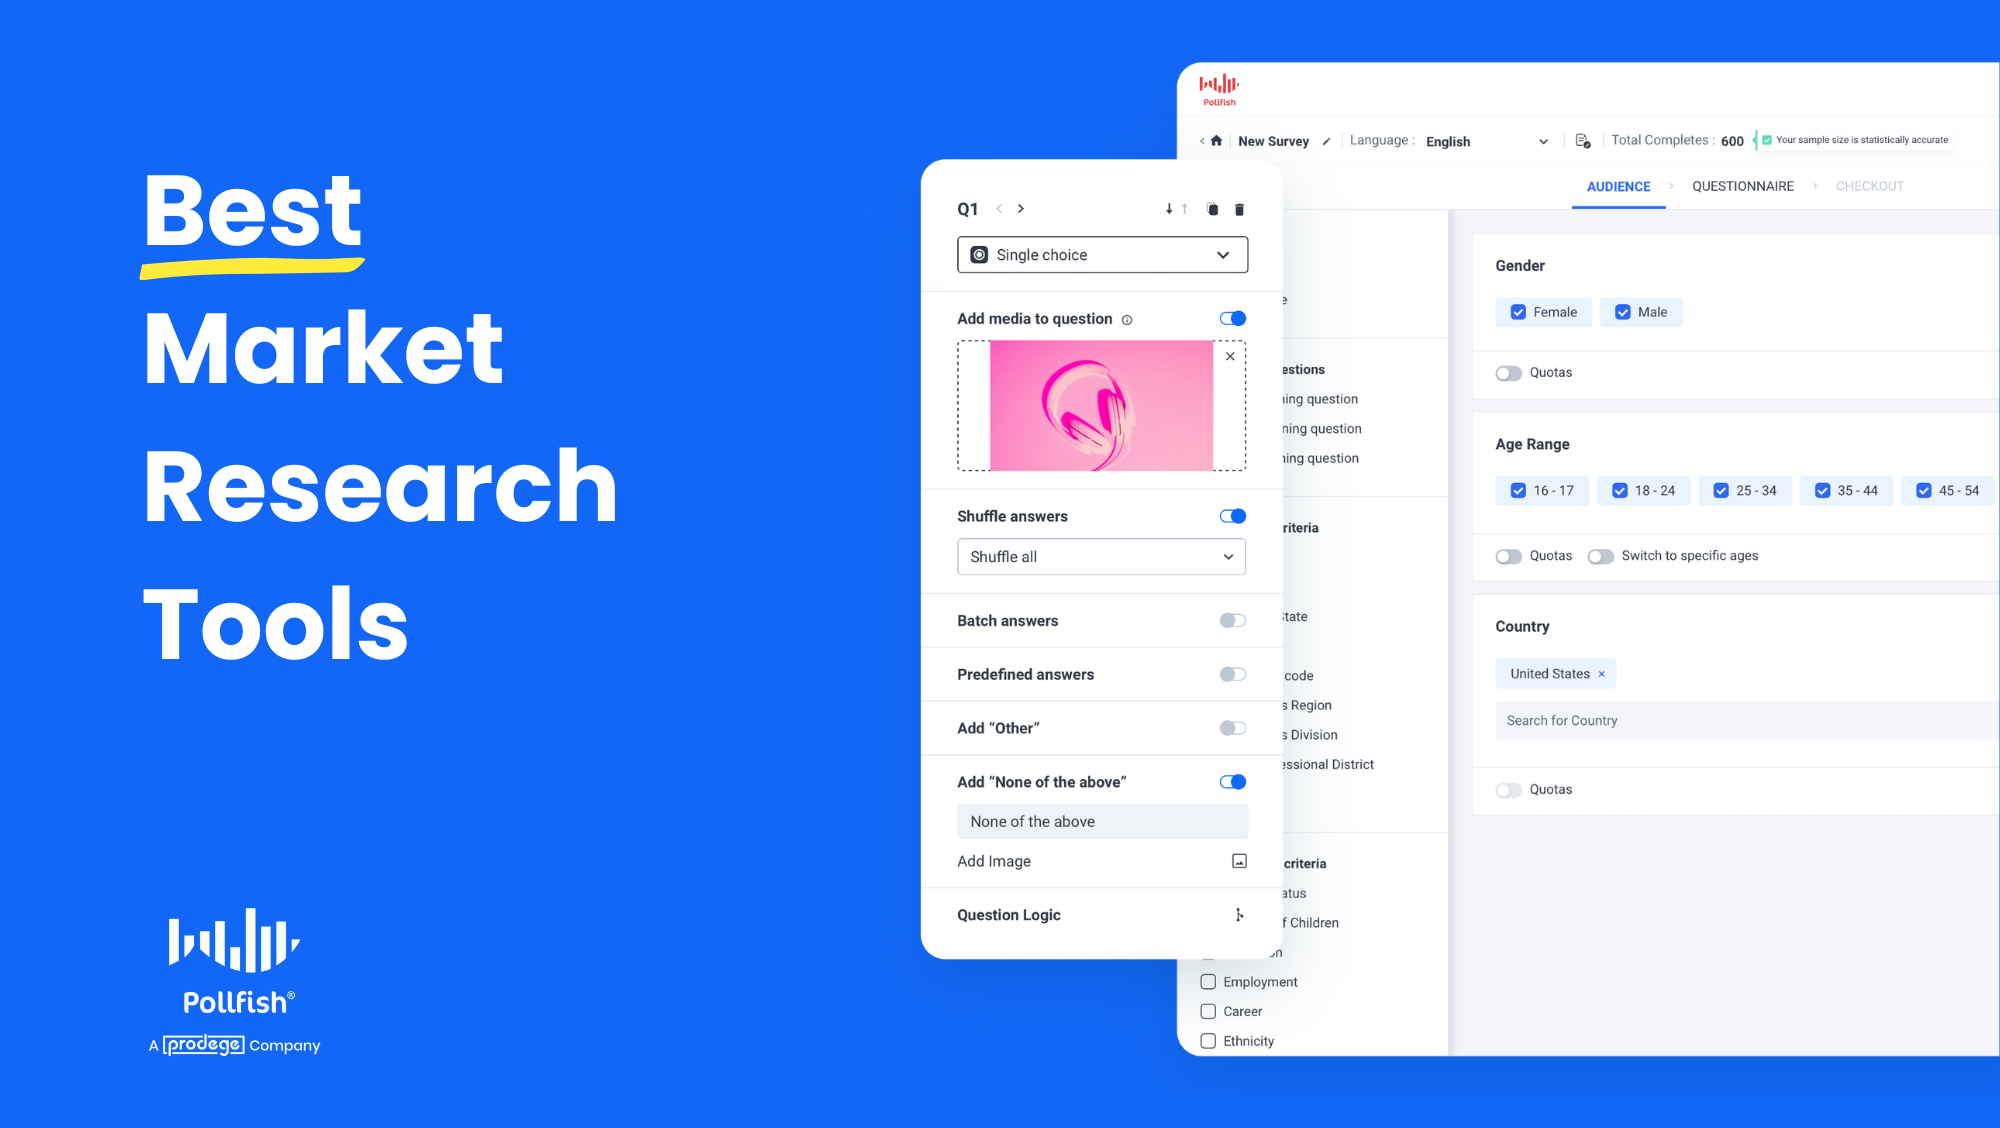
In this guide, we cover the 14 best market research tools and software, categorized from surveys and focus groups to broad data aggregators and more.| Pollfish Resources

Are you seeking to learn more about the importance of data visualization in data science and trying to get beyond what ChatGPT is saying? Explained by advanced analytics consultants who spend their time in Big Data Technology and have a rich history in Data Mining for enterprise companies? You’re in luck—we are a legit consultancy […]| DEV3LOPCOM, LLC

Zoey loves browsing the Internet. They enjoy getting lost in the interconnected web full of information, unraveling pieces of knowledge that are bookmark worthy. But they don’t enjoy skimming through large bodies of text. They prefer pictures. A lot of them. They go through their crush’s photos on Facebook before they even consider reading their […]| 24 Accessibility
This example shows how to pull data from a Socrata Dataset (in this case, the City of Chicago crime records) with the Google “Calendar Chart” visualization. As a bonus, we will then embed that chart into a Socrata Perspectives page.| dev.socrata.com
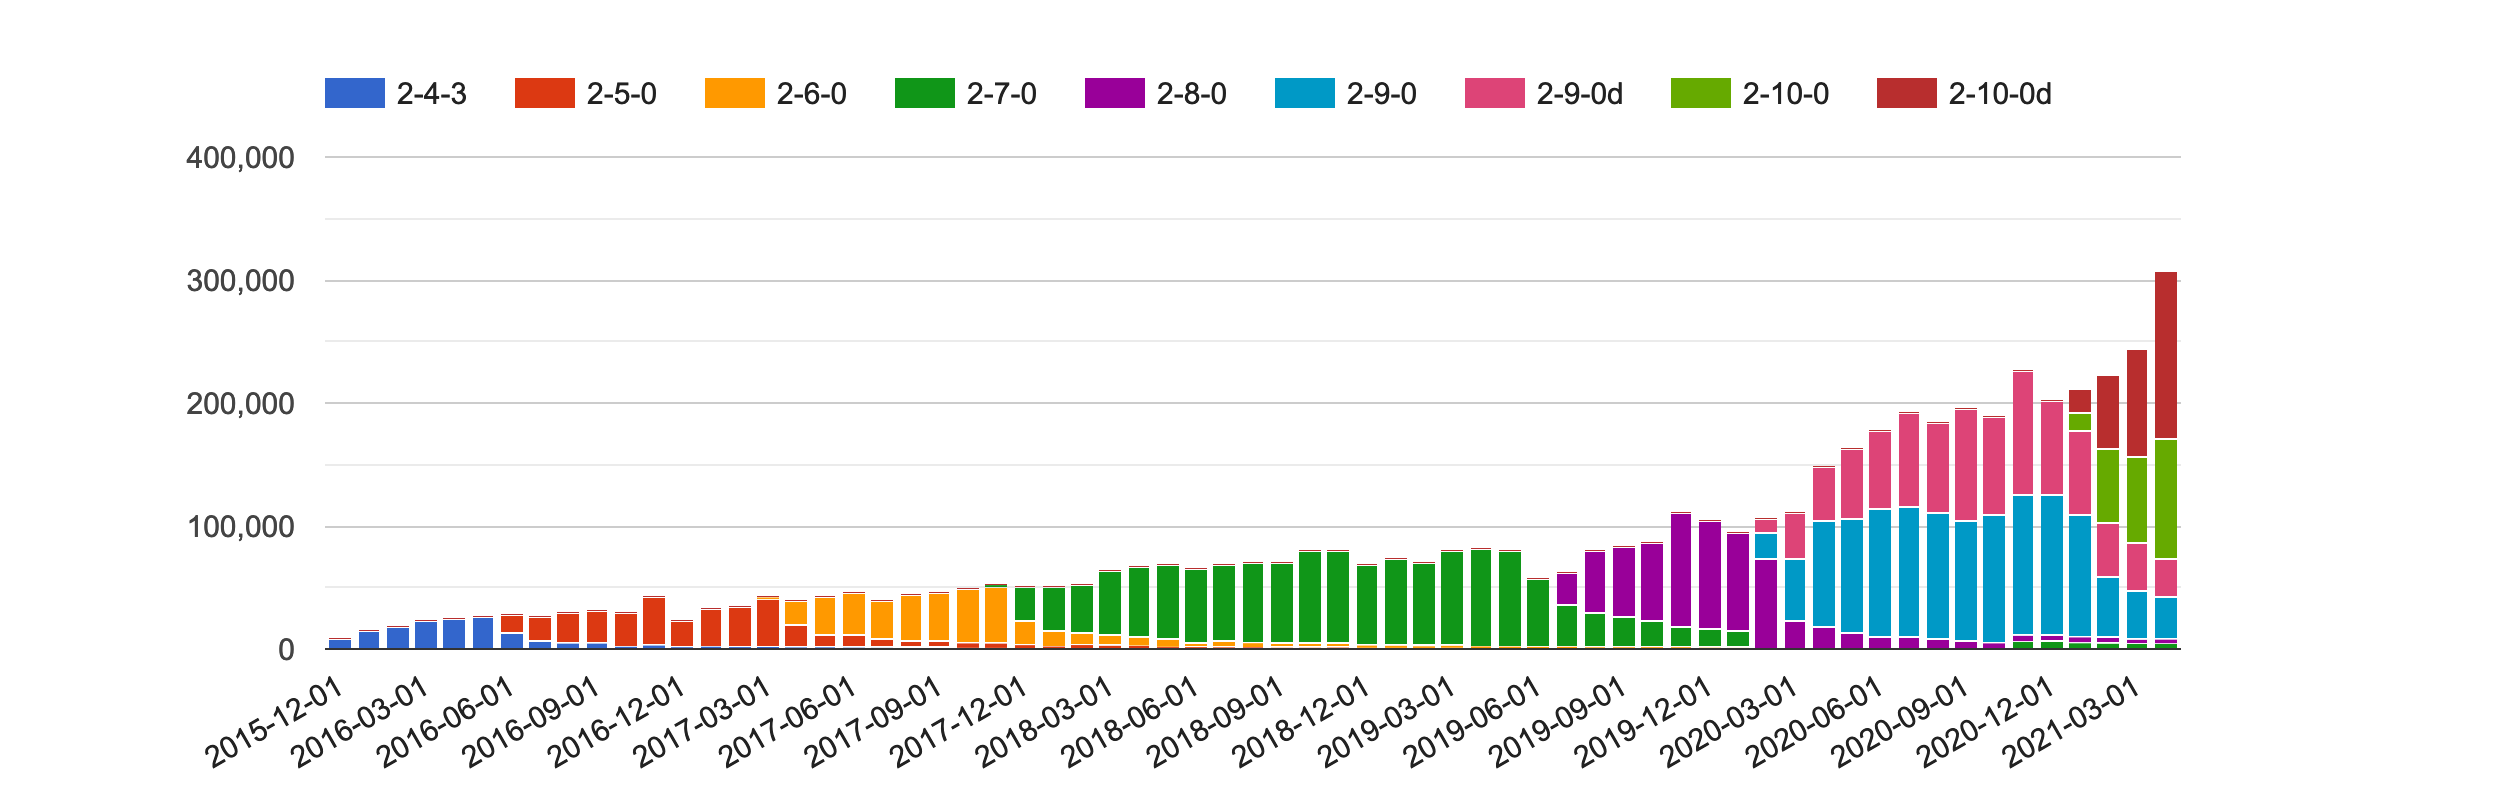
How we collect and publish statistics for ZAP| ZAP
