Top 9 Kubernetes Monitoring Tools for Cluster Management
Discover the best Kubernetes monitoring tools to track performance, troubleshoot issues, and ensure high availability. Comparison of all top tools.| CyberPanel
Discover the best Kubernetes monitoring tools to track performance, troubleshoot issues, and ensure high availability. Comparison of all top tools.| CyberPanel
At Grafana Labs, Hackathons are a core part of our culture — but these events, and the projects that emerge from them, also heavily influence our roadmap.| Grafana Labs

Grafana Tempo is the logical consequence of what Prometheus and OpenMetrics started: making metrics, logs, and traces seamless at truly cloud native scale.| Grafana Labs
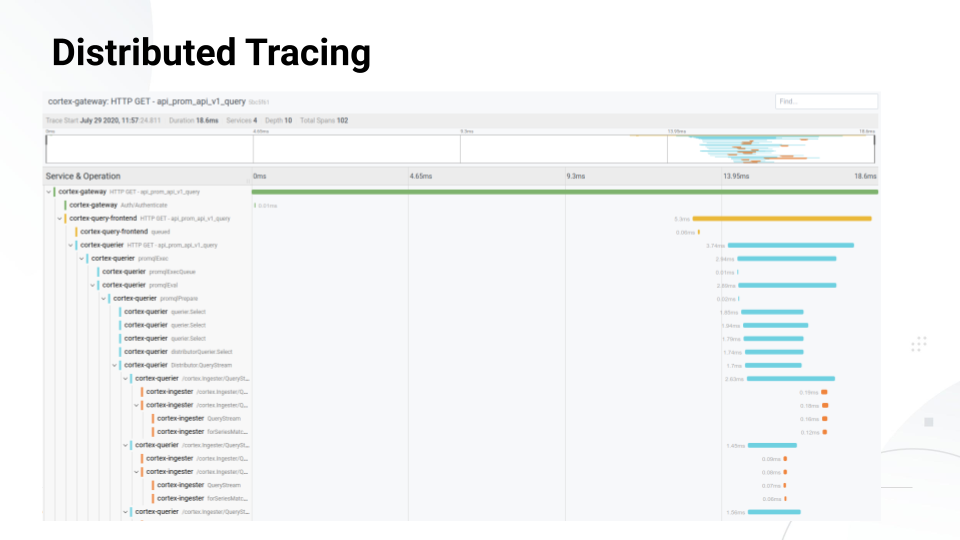
All the basics you need to know about distributed tracing, Tempo, and Jaeger.| Grafana Labs
How we handle 92 million compilations a year without everything catching fire| xania.org
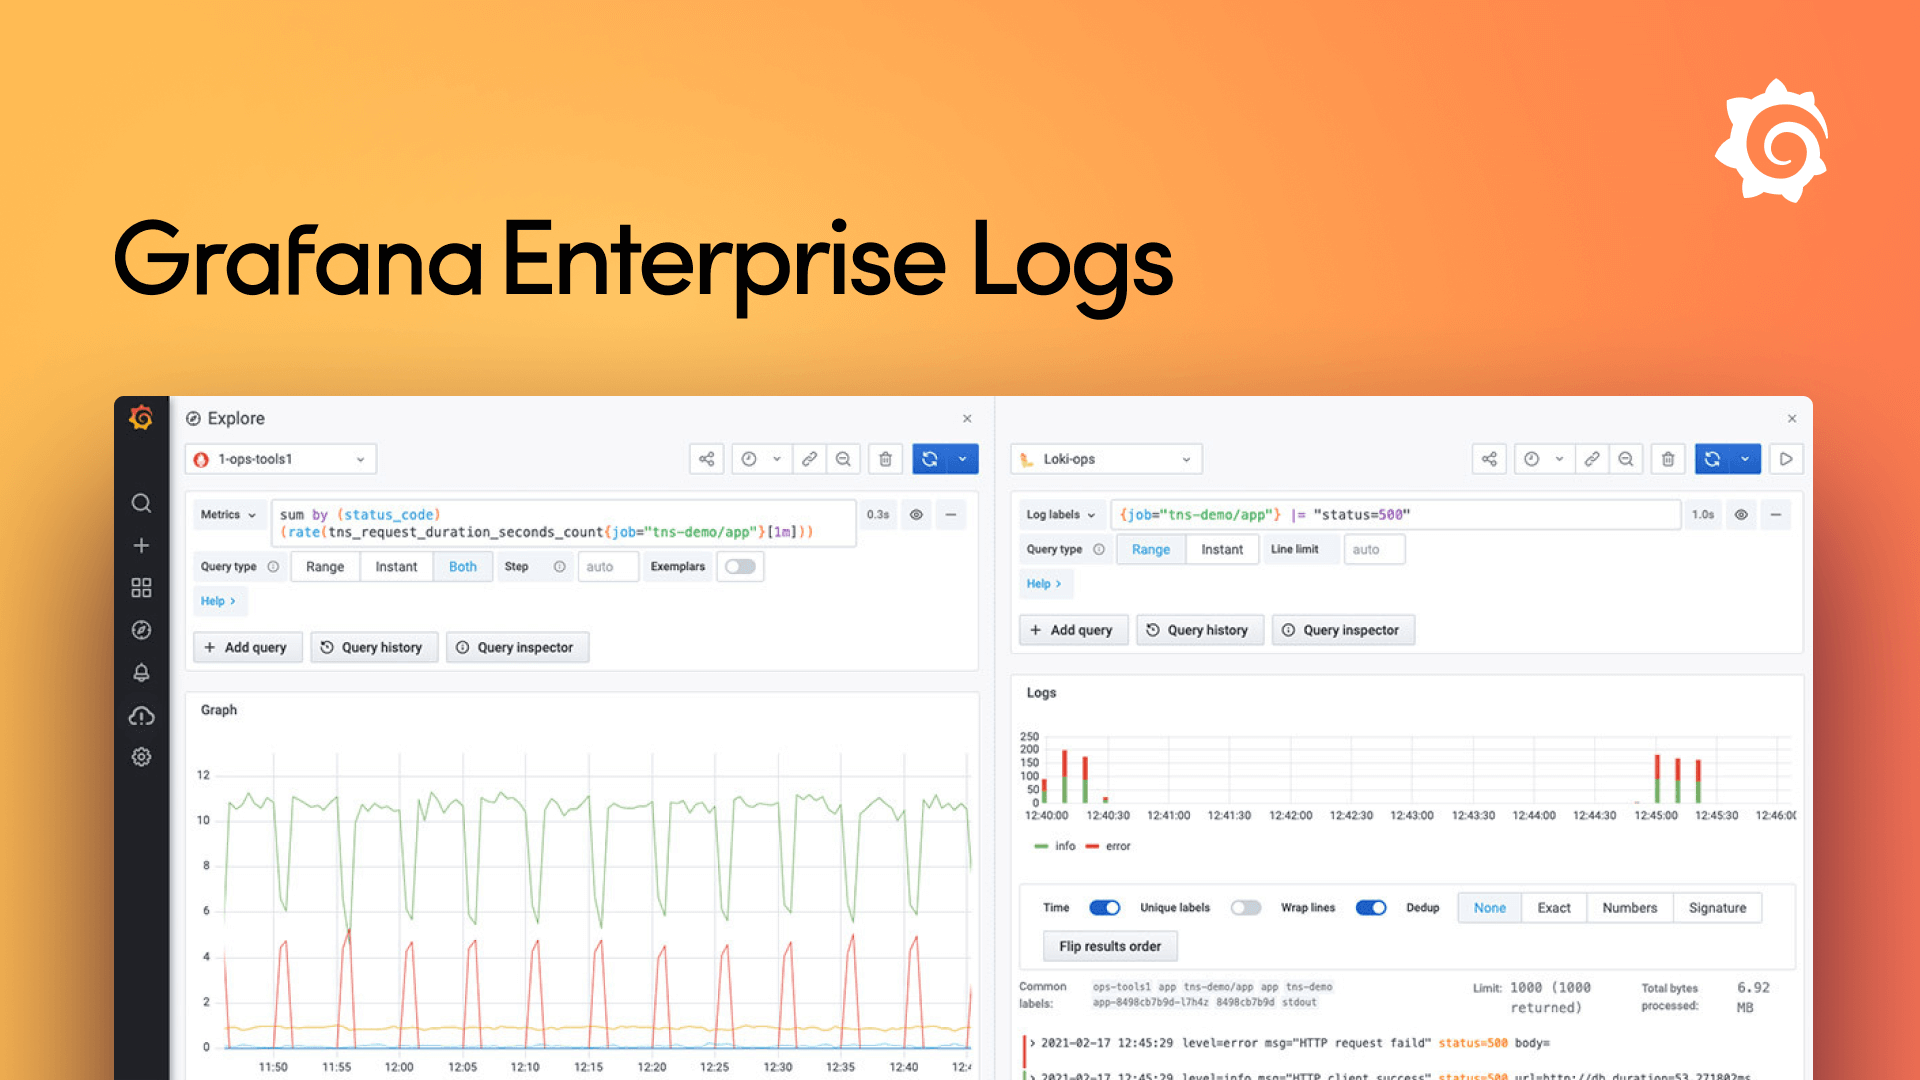
Grafana Enterprise Logs offers a unique approach to log indexing, storage and administration control that runs securely at scale and is supported by Grafana.| Grafana Labs
With the addition of GET, Grafana Labs’ self-managed stack now brings together the pillars of observability — metrics, logs, and traces — for enterprise scale.| Grafana Labs
I have written a fair amount about Prometheus,| utcc.utoronto.ca
Almost every week I accidentally get into this logging argument. Here’s the problem: people tend to log different things and call it a best-practice. And I a...| sobolevn.me
I’ve been a heavy user of ElasticSearch for coming up 7 years now. During that time I’ve used it for a few main usecases: A Search Engine, An APM Solution (after NewRelic started being stupidly expensive), a backend for Jaeger, and as a log storage system. In all of those usecases I’ve really pushed ElasticSearch to its limits, with hundreds of terrabytes of data across dozens of machines and tens of thousands of shards and in all that time I’ve found that it really only works well fo...| blog.colindou.ch
Logging (i.e. exporting text data from your application) is one of the very first things that any budding programmer learns to do. Who among us hasn’t started learning a programming language with a: 10 PRINT "Hello World!" 20 END That’s a log! Not a good log, but a log nonetheless. And that is why the importance of logging in a systems observability is so often overlooked - everyone can log, it’s hard to log well.| blog.colindou.ch
How to leverage existing PostgreSQL configuration to find slow queries in your application.| alex.pearwin.com
Advanced usage of Traefik on Nomad via Consul, with sane defaults, graceful updates, Consul/Vault as configuration sources, Promtail and OpenTelemetry sidecars| atodorov.me
How to collect logs from Nomad tasks and how to run Grafana Labs' Loki to aggregate them| atodorov.me
