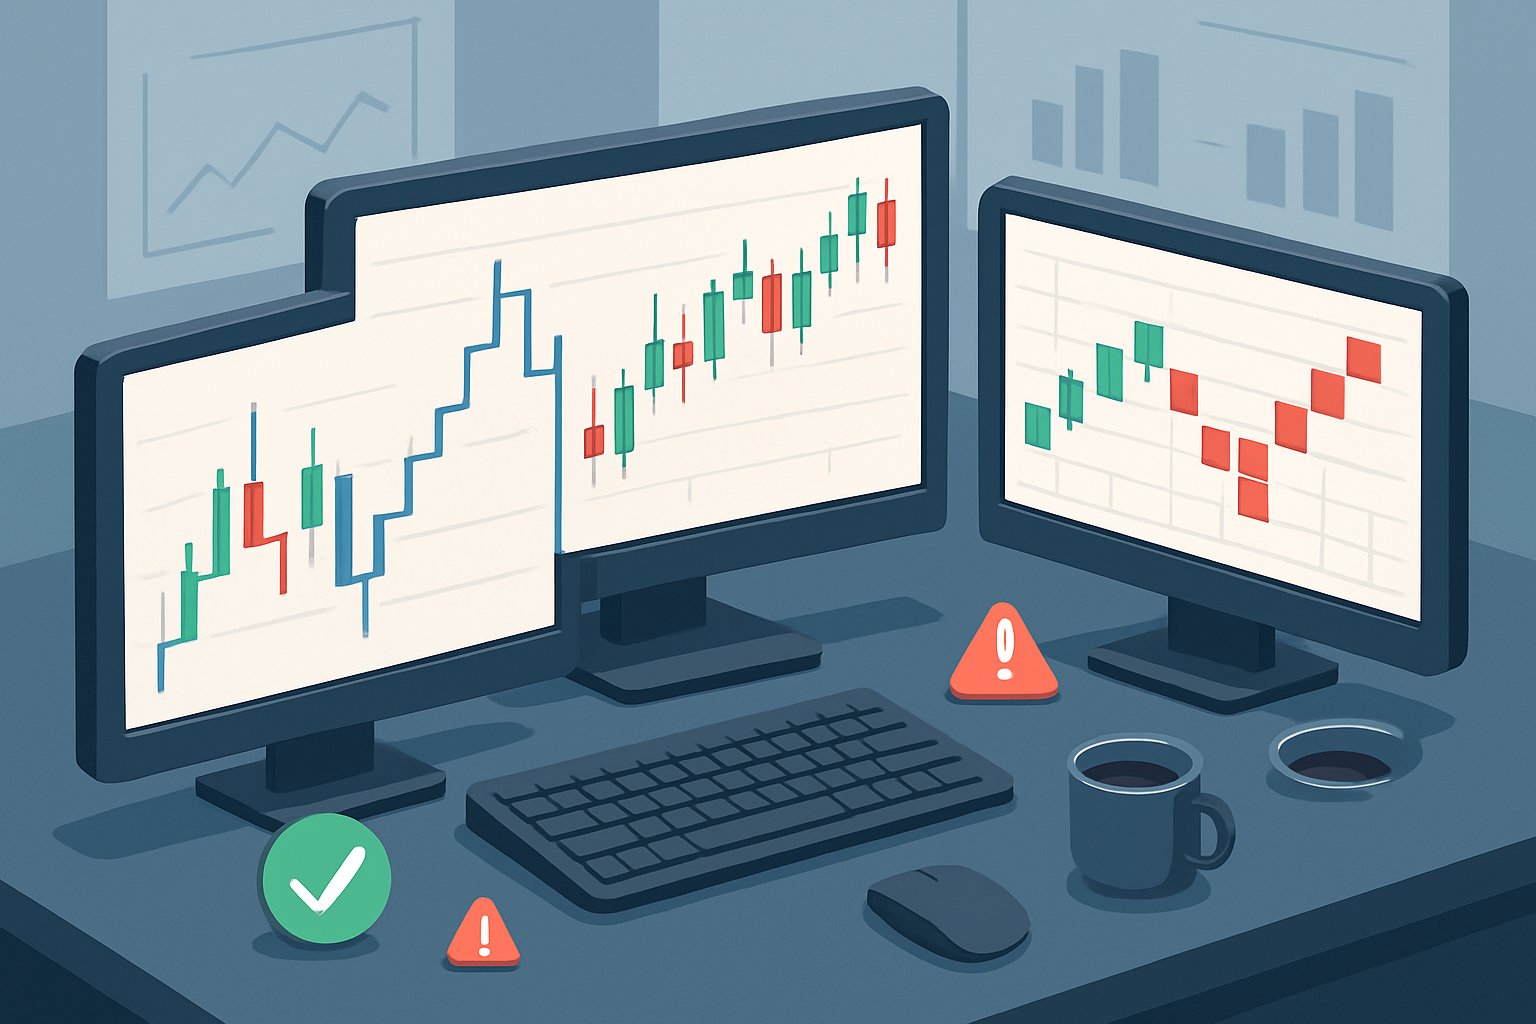
Price action trading is a method of day trading that relies on technical analysis but ignores conventional fundamental indicators, focusing instead on the movement of prices.| Liberated Stock Trader
The average true range (ATR) is a nondirectional momentum indicator that measures price volatility. Our 1,205 test trades showed a solid 1.77 reward-to-risk ratio with an average 8.5% winning trade.| Liberated Stock Trader
Kagi charts provide traders with a unique perspective on price action, filtering out much of the noise and highlighting genuine trends. Getting a handle on how to use Kagi charts, dialing in the right settings, and understanding how they compare to other chart types can really sharpen your technical analysis and trading decisions.| Liberated Stock Trader
My testing shows the best TradingView indicators for advanced analysis are Volume Profile HD, VWAP, Supertrend, ATR, Relative Volatility, and RSI. TradingView's candlestick and chart pattern recognition algorithms are game changers for improving trading outcomes.| Liberated Stock Trader
We explain the 101 most important stock market terms and decipher financial jargon with simple definitions and practical examples.| Liberated Stock Trader
Our ultimate guide to technical analysis, with its 14 videos and detailed examples covering charts, trends, indicators, patterns, and tools, will fast-track your knowledge.| Liberated Stock Trader
The mean reversion trading strategy suggests prices and returns eventually move back toward the mean or average. Reliable indicators like Stochastics, RSI, and Bollinger bands are based on mean reversion to identify overbought and oversold conditions.| Liberated Stock Trader
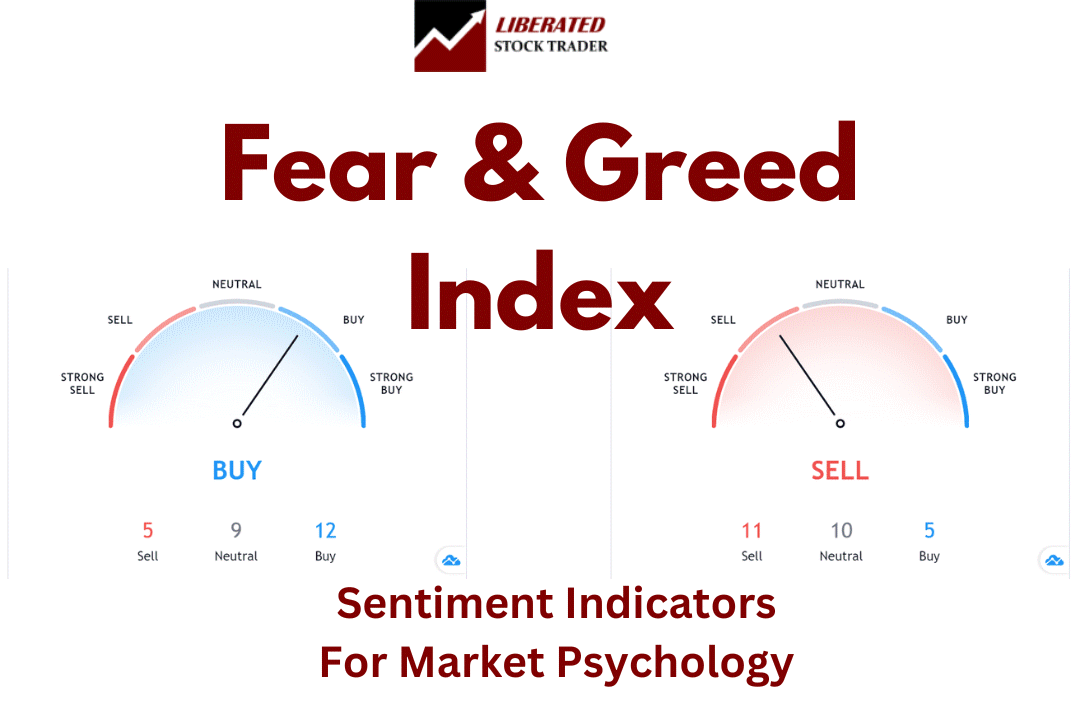
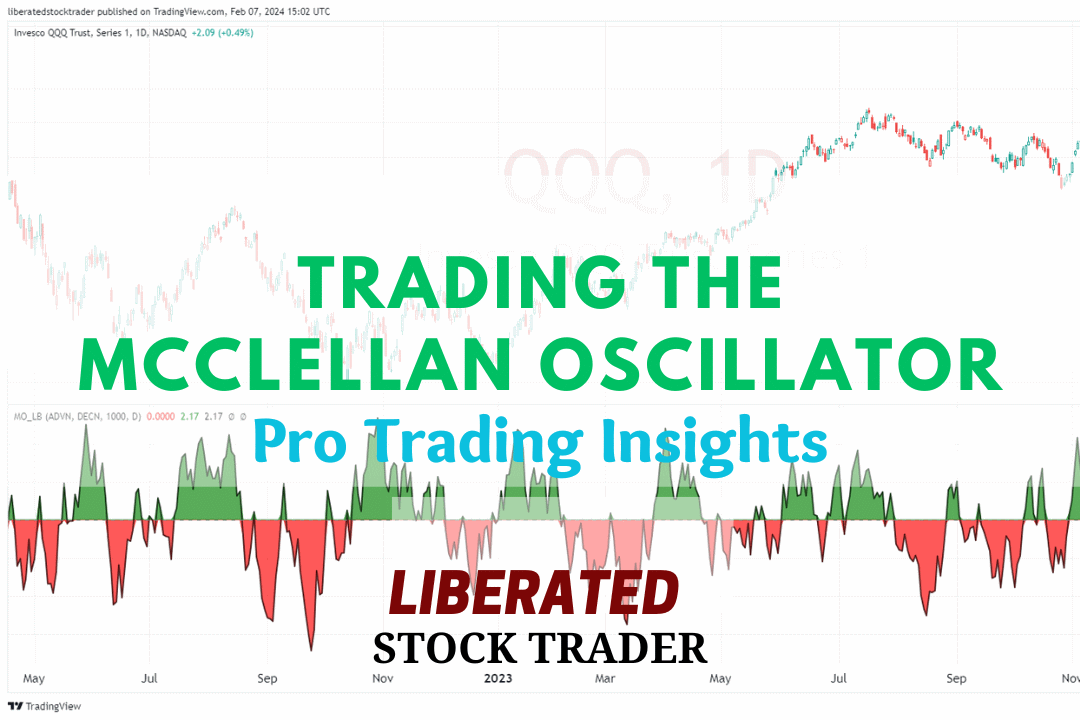
The McClellan Oscillator is a technical analysis tool designed to assess the market breadth of the New York Stock Exchange (NYSE). It is renowned for its effectiveness in revealing the underlying strength or weakness of the market by comparing the number of advancing to declining stocks.| Liberated Stock Trader
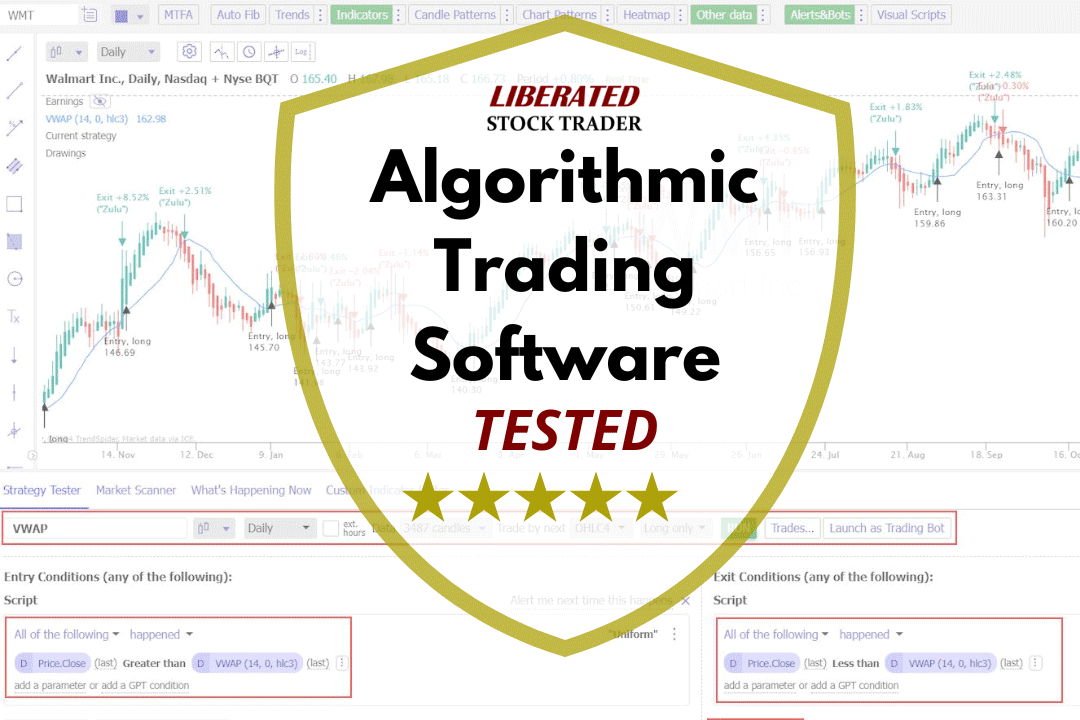
My testing shows that TrendSpider, Trade Ideas, TradingView, and Tickeron are the most effective software for creating, testing, and executing trading algorithms.| Liberated Stock Trader
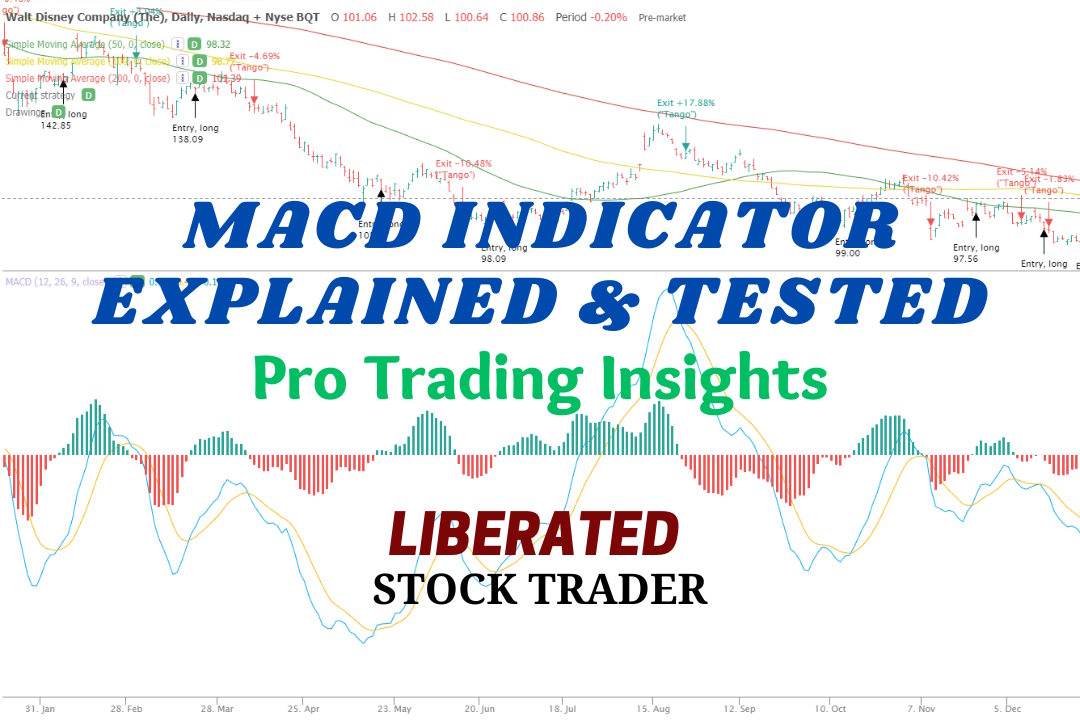
MACD is a trend-following momentum indicator used to identify price trends. We conducted 606,422 test trades to find the best settings and trading strategies.| Liberated Stock Trader
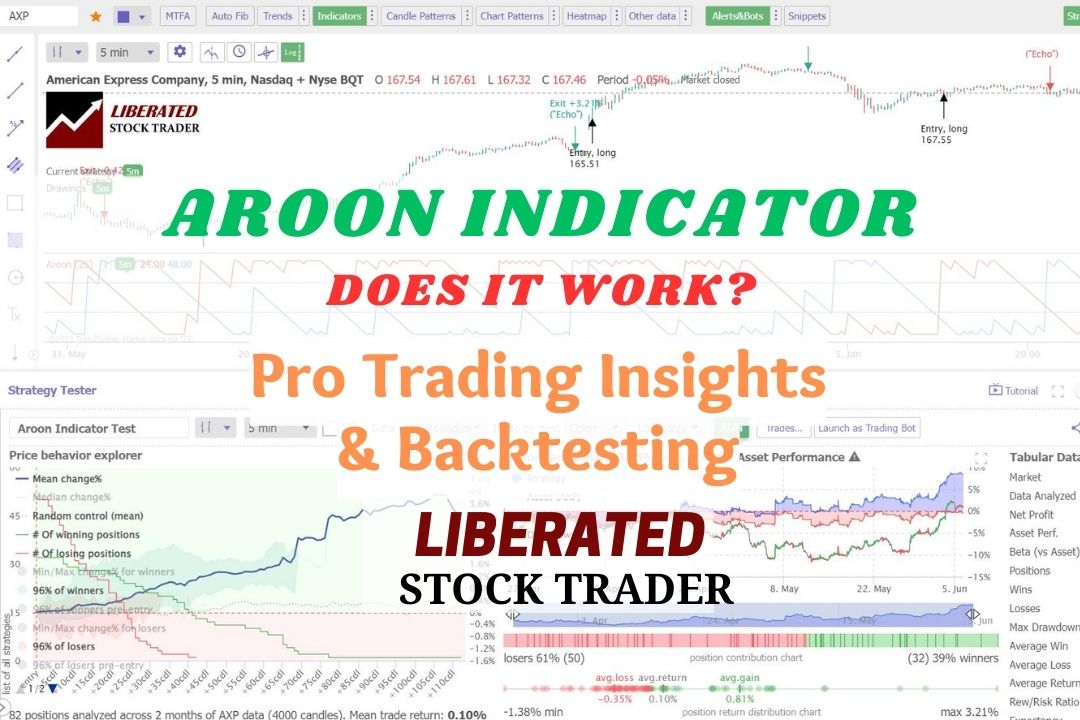
In technical analysis, the Aroon indicator identifies trend reversals and trend strength. This oscillating indicator has two parts: the "Aroon Up" line measures uptrend strength, and the "Aroon Down" line for downtrend strength.| Liberated Stock Trader
To create an algo trading system, you must choose a strategy, select a trading platform, choose the asset type, select the indicators and patterns, backtest, and refine the strategy.| Liberated Stock Trader
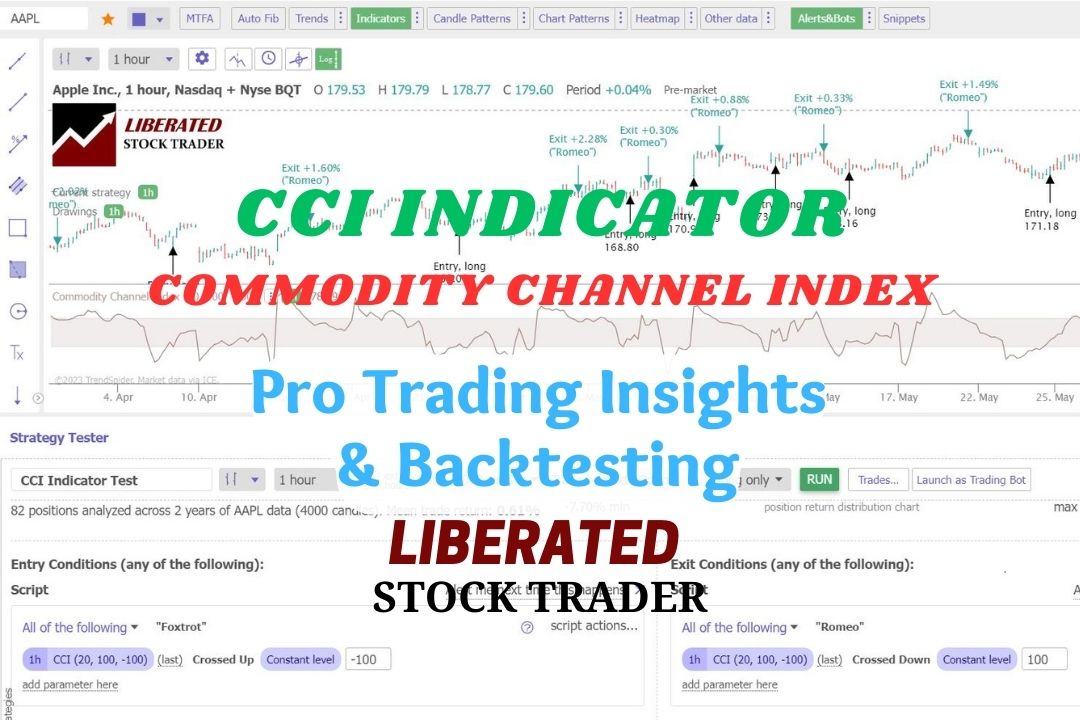
Our test data shows that using the CCI indicator with a 50 setting on the S&P 500 index stocks over 20 years was incredibly profitable, returning a 1,108% profit compared to the market, which returned 555%.| Liberated Stock Trader
Our research on 10,400 years of exchange data shows the best day trading indicators are the Price Rate of Change, VWAP, Weighted Moving Average, Hull Moving Average, Simple Moving Average, and RSI.| Liberated Stock Trader