Grafana Enterprise | Self-managed Prometheus service
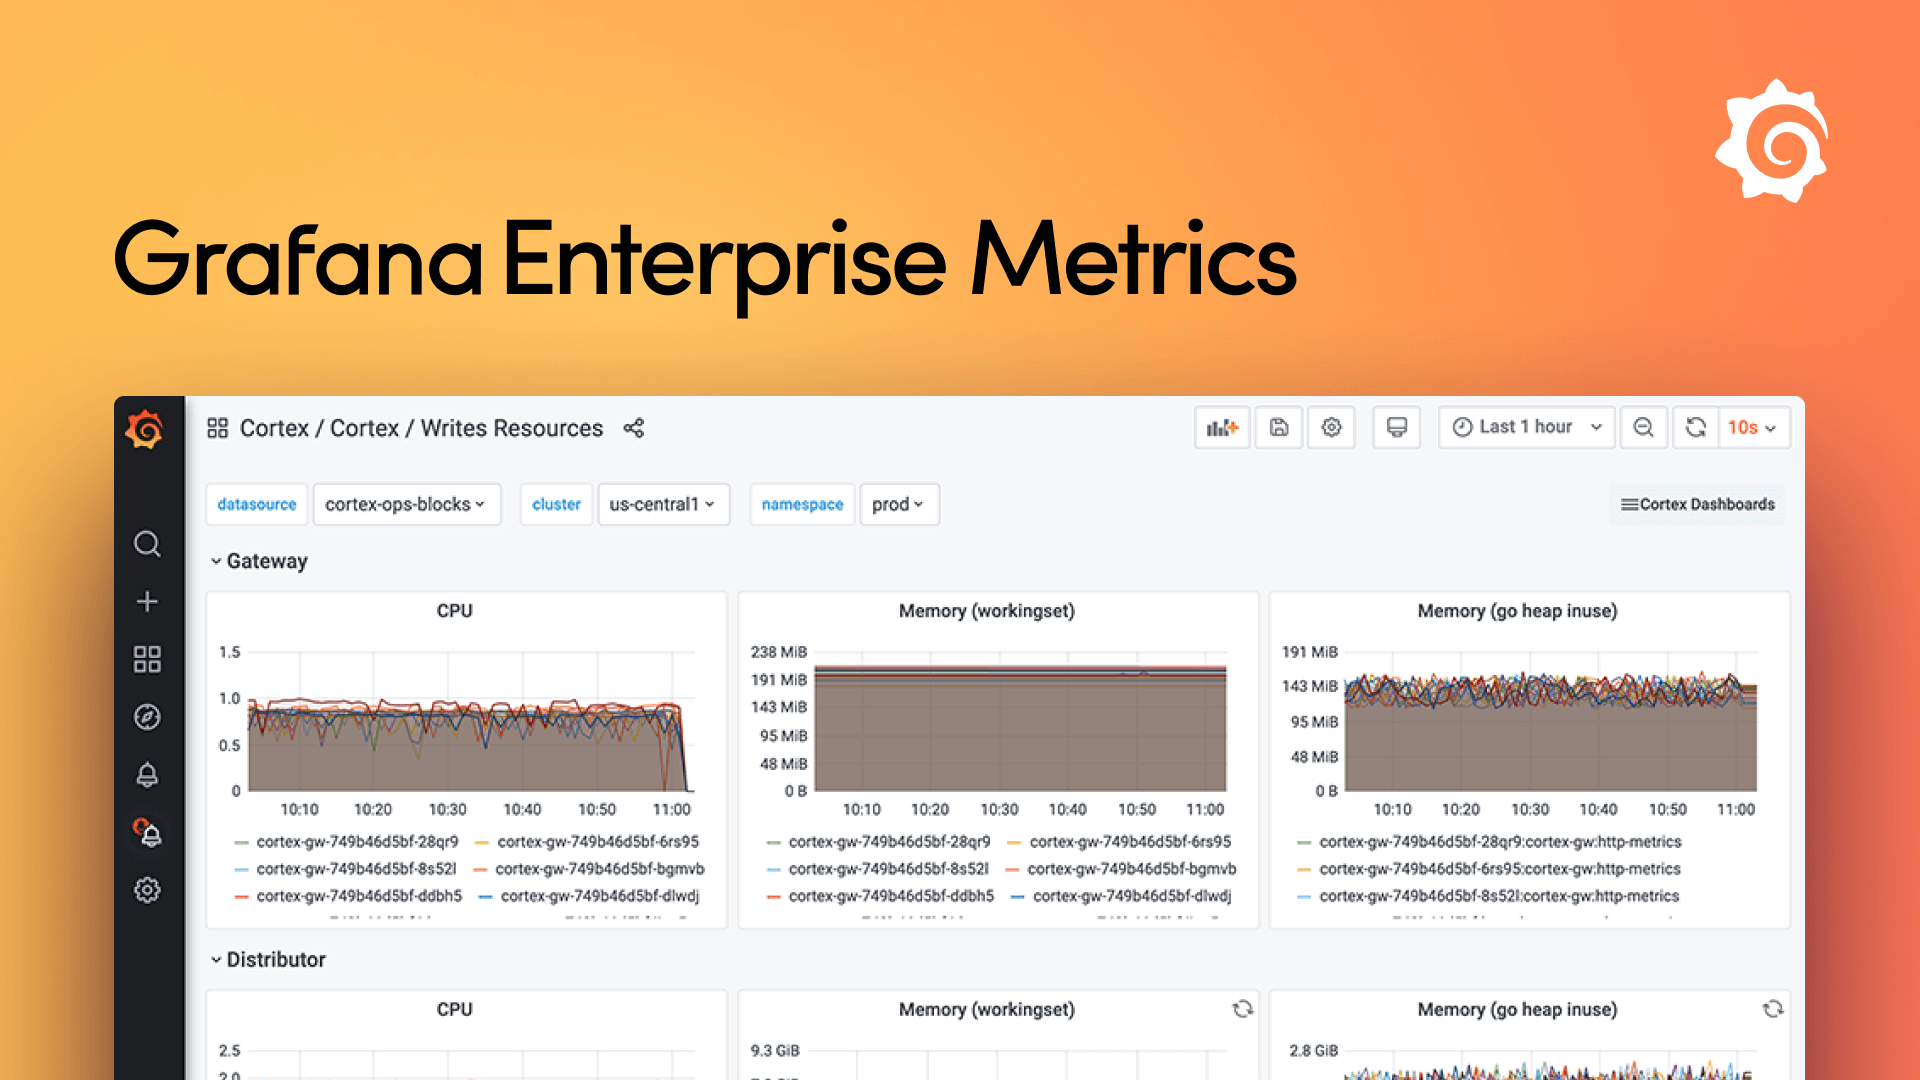
Grafana Enterprise Metrics is a scalable solution that enables Prometheus-as-a-Service for large organizations running at scale.| Grafana Labs
Grafana Enterprise Metrics is a scalable solution that enables Prometheus-as-a-Service for large organizations running at scale.| Grafana Labs

Know how to monitor, understand, and optimize Prometheus CPU usage to keep your observability reliable and efficient.| Last9
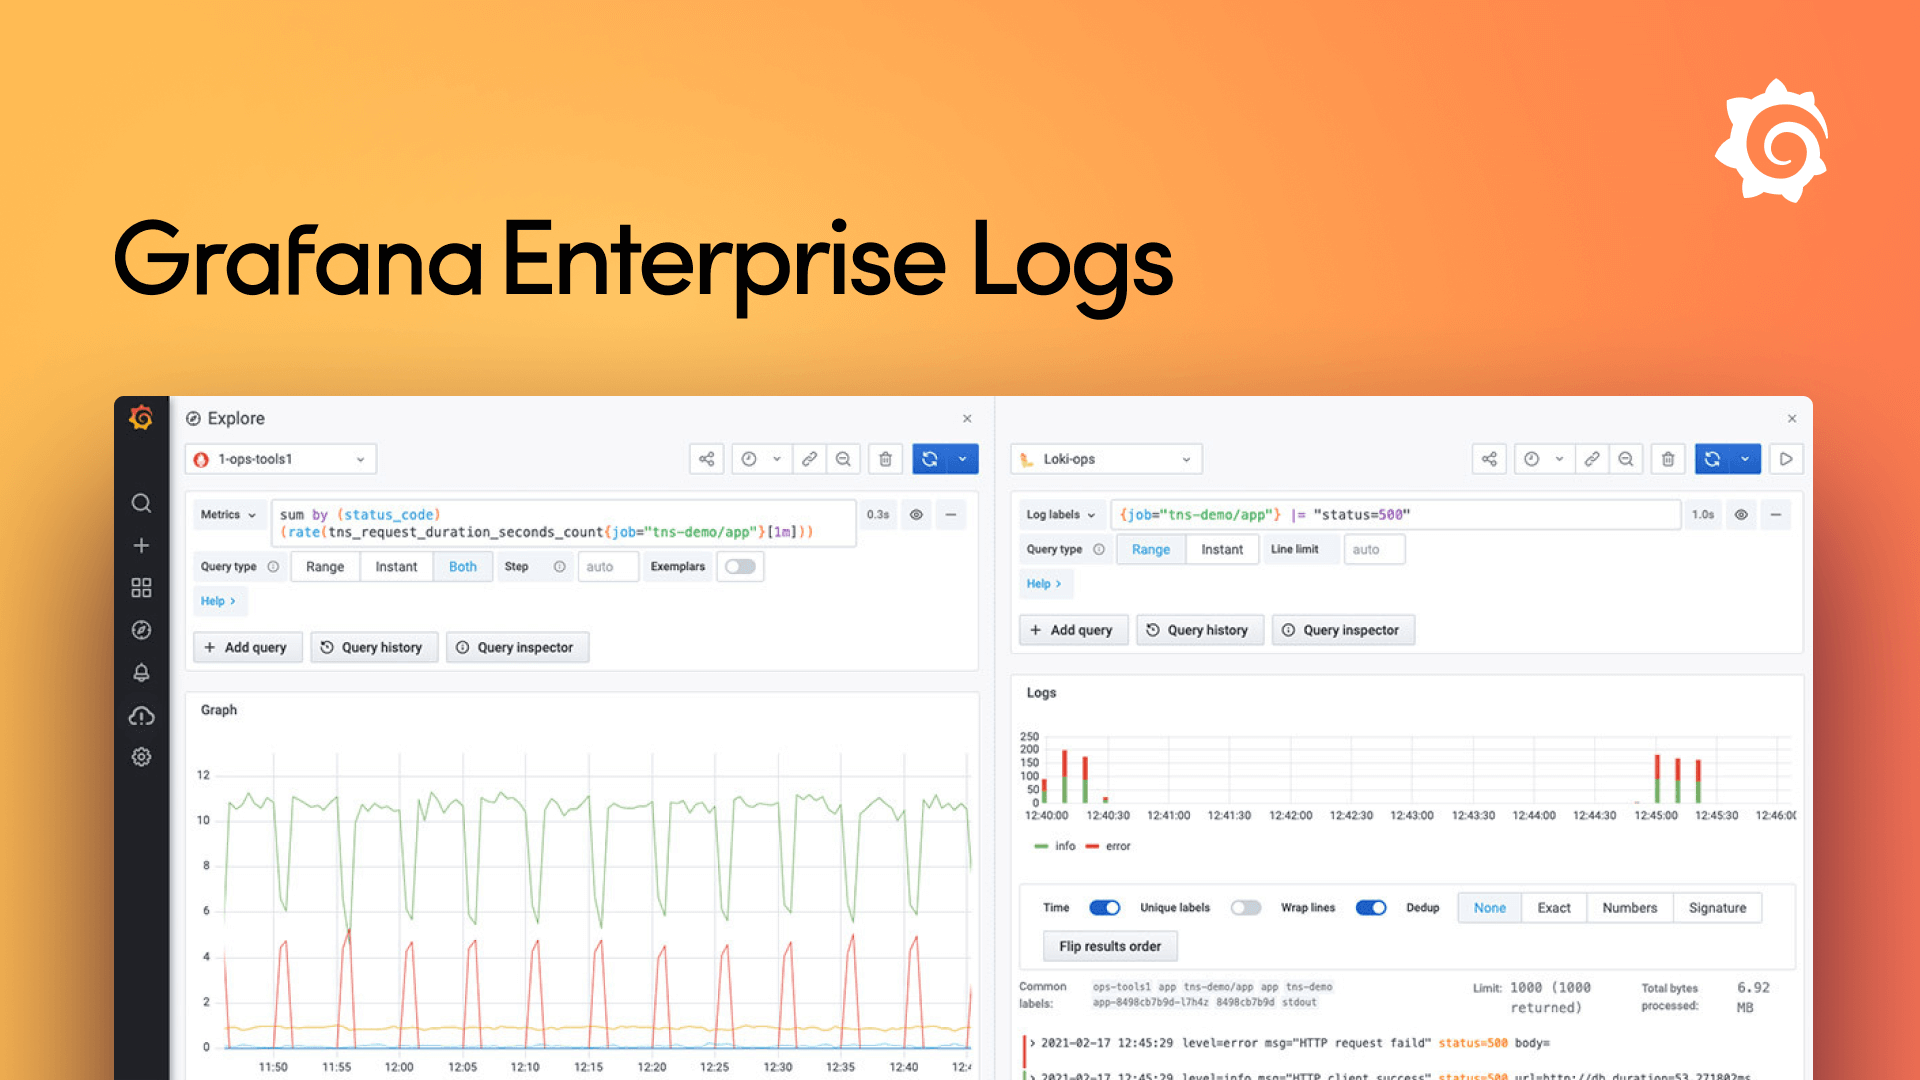
Grafana Enterprise Logs offers a unique approach to log indexing, storage and administration control that runs securely at scale and is supported by Grafana.| Grafana Labs
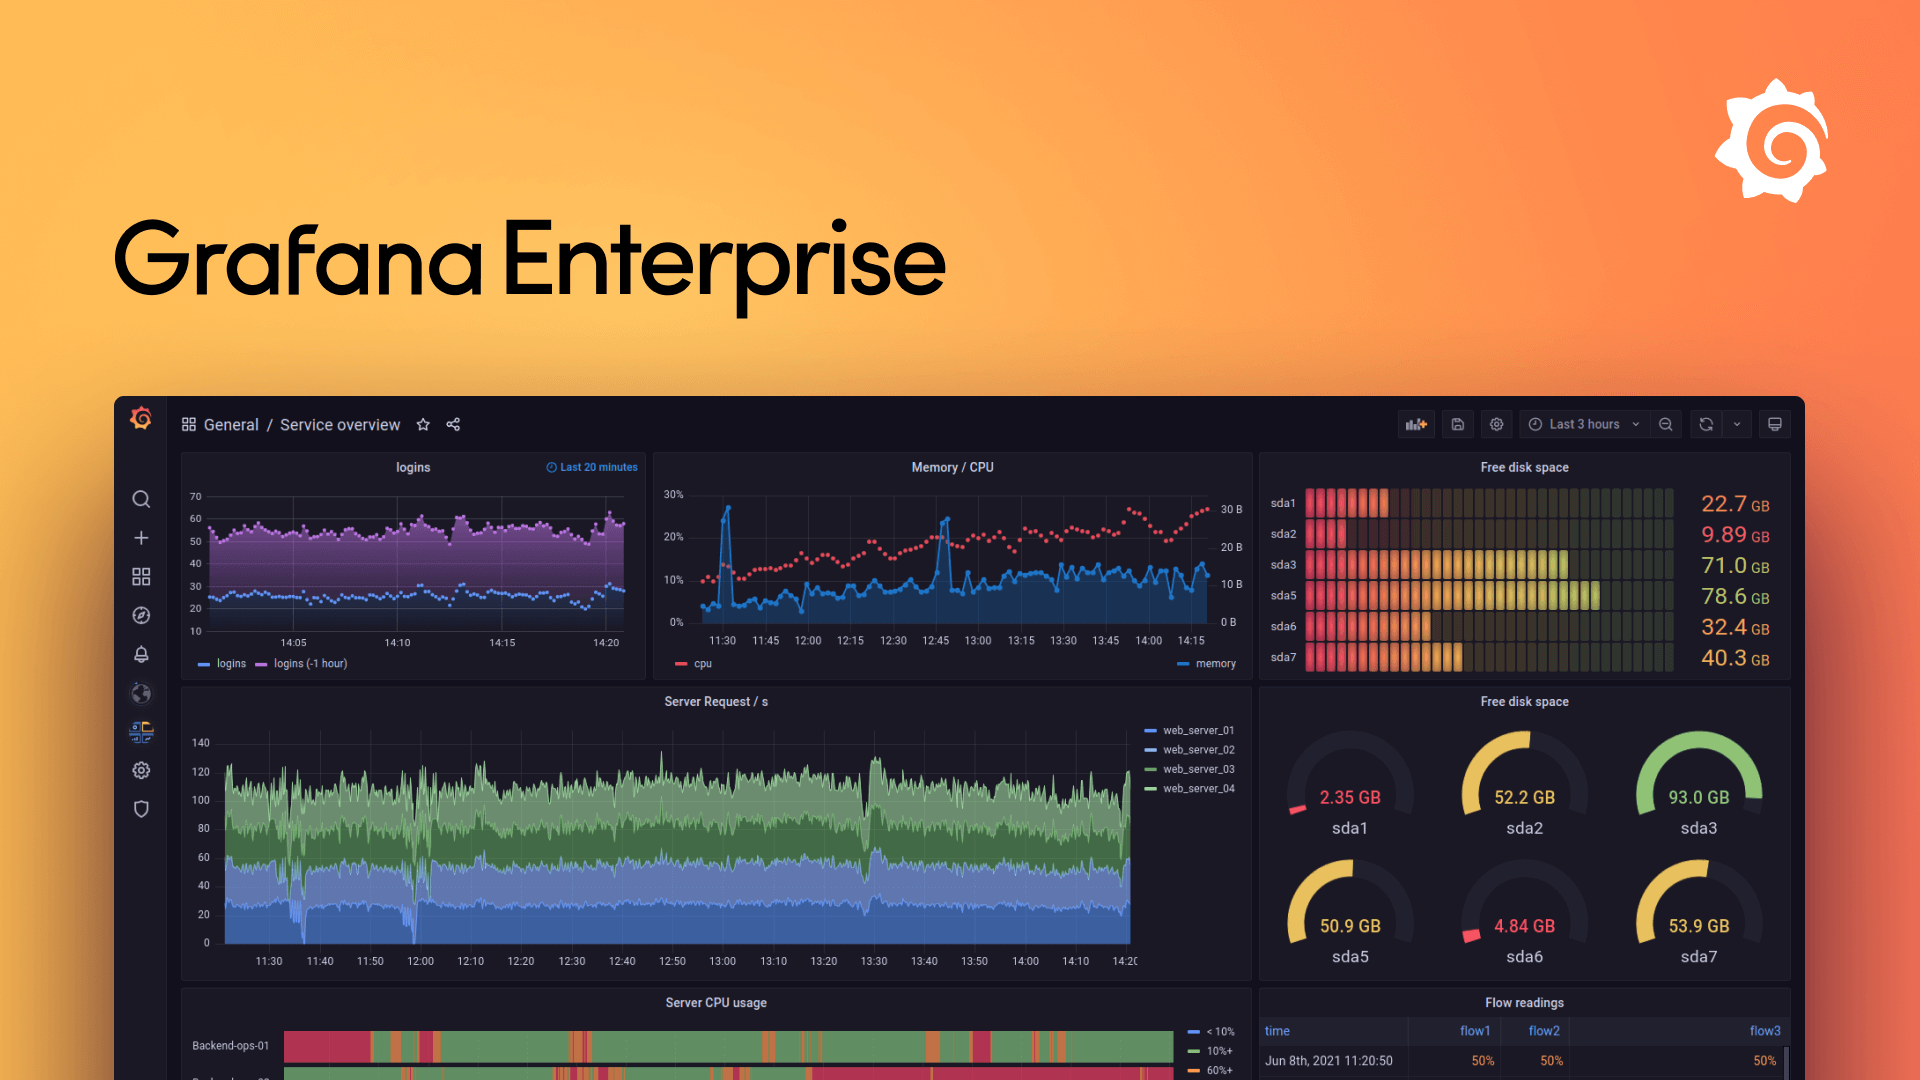
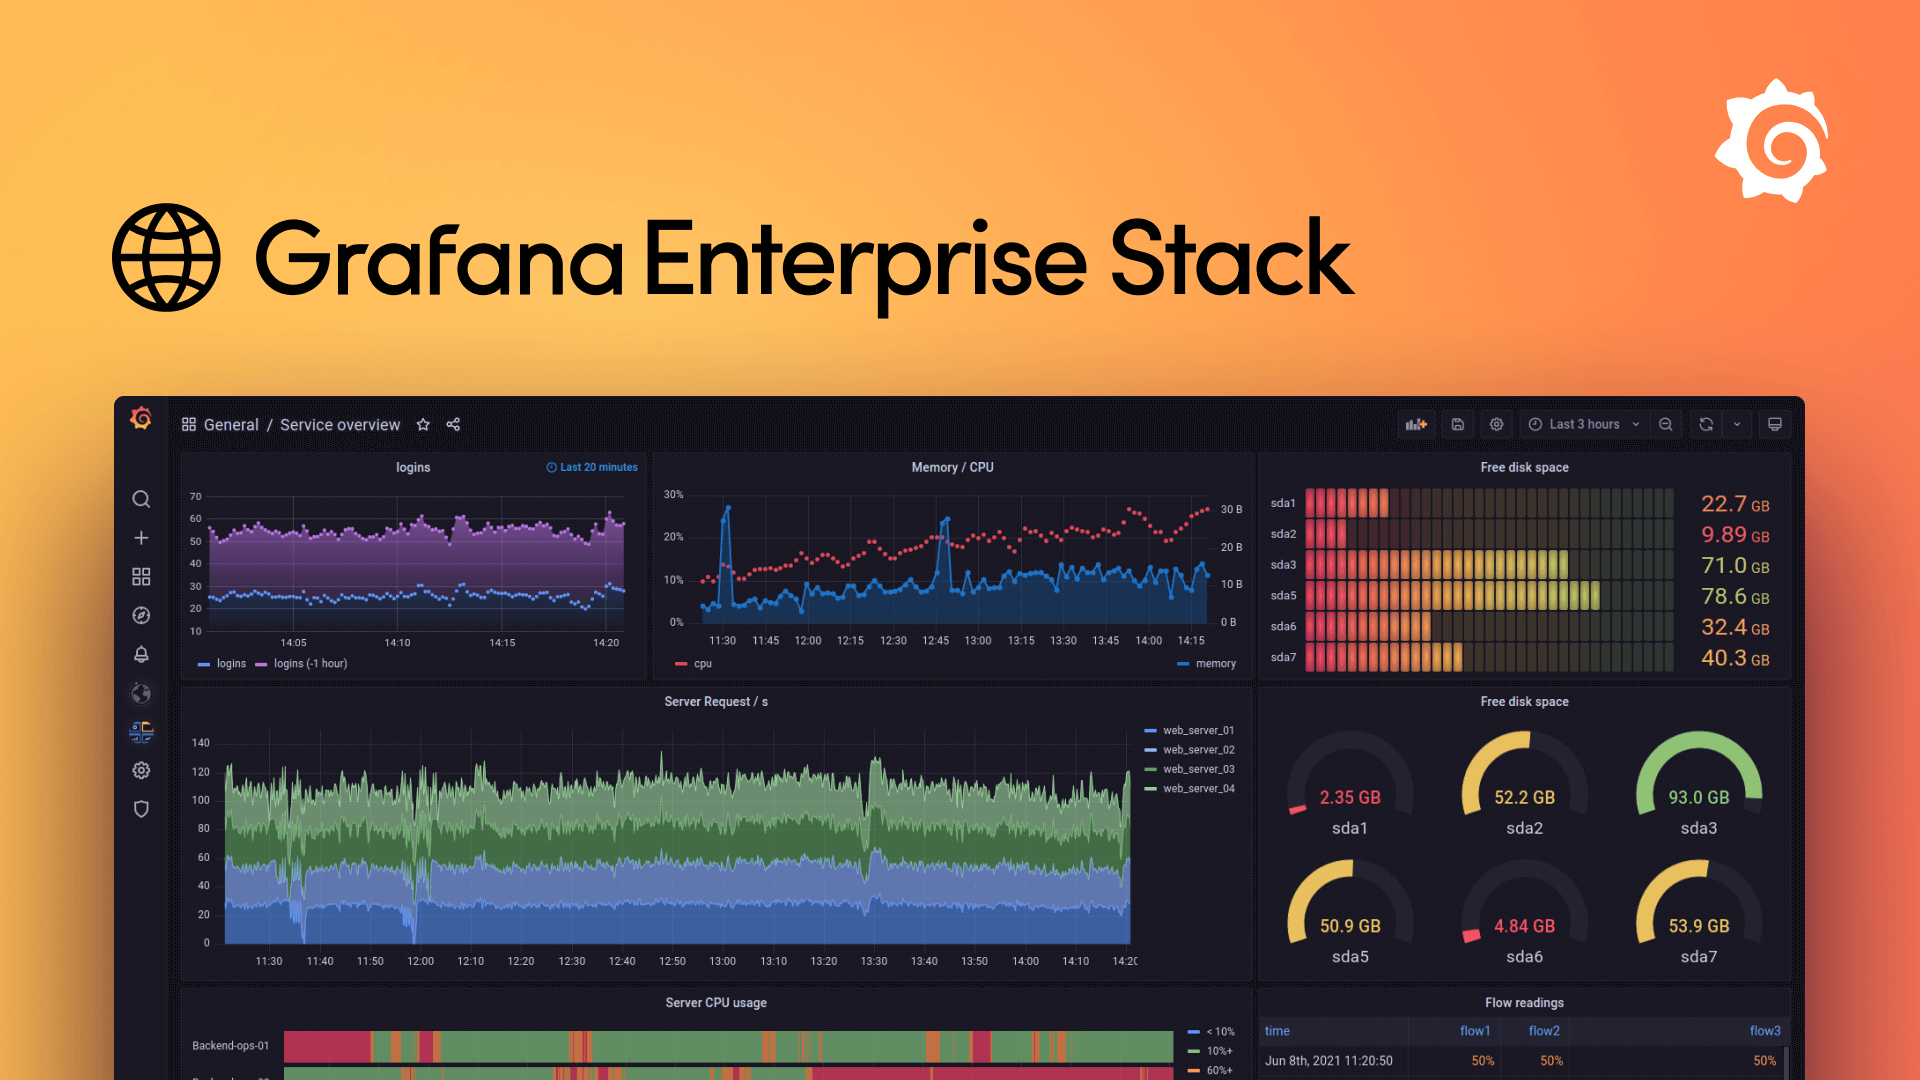
Why organizations choose Grafana Enterprise: Enhanced collaboration and usage analytics for teams. Advanced security and reporting requirements. Visibility into your full stack with Enterprise plugins like Splunk, ServiceNow, Datadog, and more. Ability to scale complex architectures and deploy faster. Access to talented experts on Prometheus, Graphite, and Grafana.| Grafana Labs
With the addition of GET, Grafana Labs’ self-managed stack now brings together the pillars of observability — metrics, logs, and traces — for enterprise scale.| Grafana Labs