Trendlines are a visual representation of the trend direction in the stock market. They are formed by connecting two or more significant highs or lows on a stock chart, creating a diagonal line that indicates the general trend of the asset's price movement.| Liberated Stock Trader
My research indicates that the most effective chart types for traders are Heikin-Ashi, Candlestick, OHLC, Raindrop, and Renko charts. These charts provide the optimal balance of price and trend reversal information to help investors develop effective trading strategies.| Liberated Stock Trader
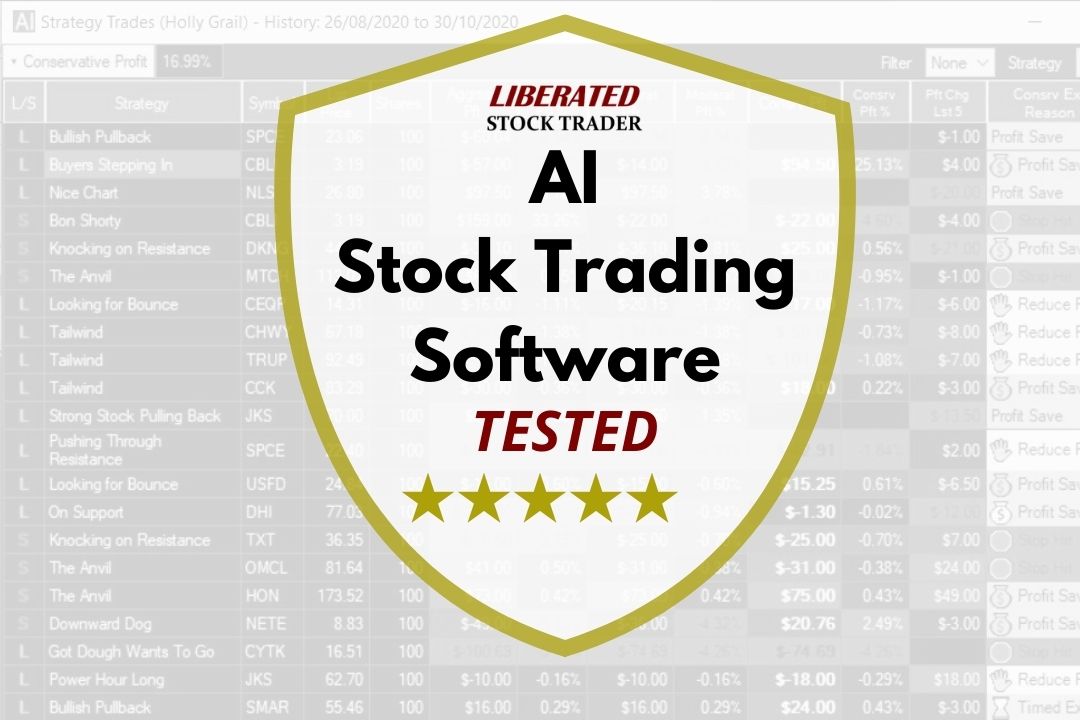
Most AI trading tools do not use real AI machine learning and large language models. The majority of self-proclaimed AI trading tools are algorithmic and do not actually learn.| Liberated Stock Trader
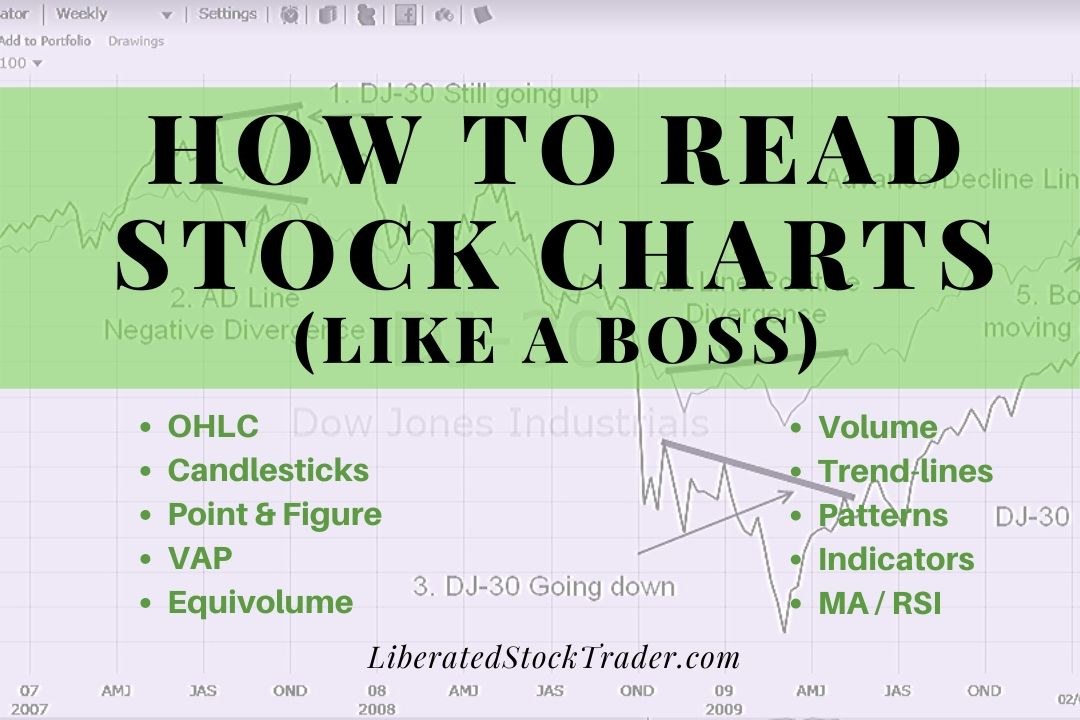
Learn technical analysis and how to read stock charts. This helps you understand the movement of stock prices, stock trends, and the supply-demand equation. Stock chart indicators and market sentiment are all important factors.| Liberated Stock Trader
Trade Ideas excels at real-time scanning and AI-generated trade recommendations, while TrendSpider dominates in automated chart pattern recognition, backtesting, and AI models.| Liberated Stock Trader
As a Professional market analyst, I build effective trading strategies using techniques such as indicator divergences, multi-time frame analysis, indicator combinations, and rigorous backtesting.| Liberated Stock Trader
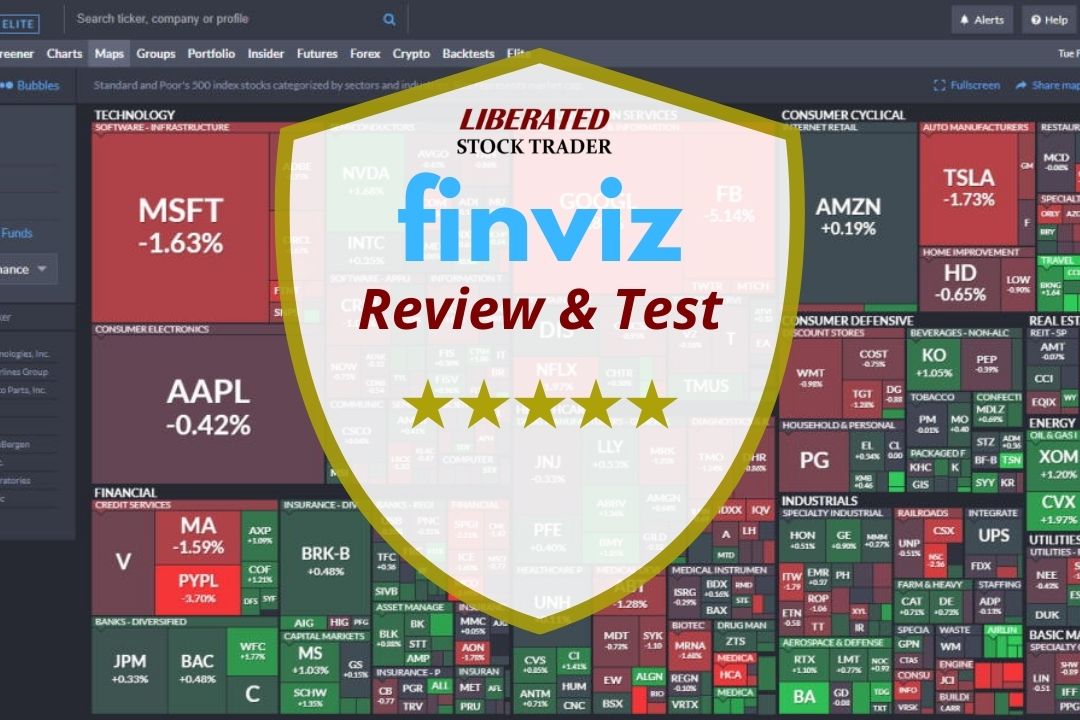
After hands-on testing, I found Finviz to be a powerful free stock screener, swift market heatmaps and impressive stock chart pattern recognition.| Liberated Stock Trader
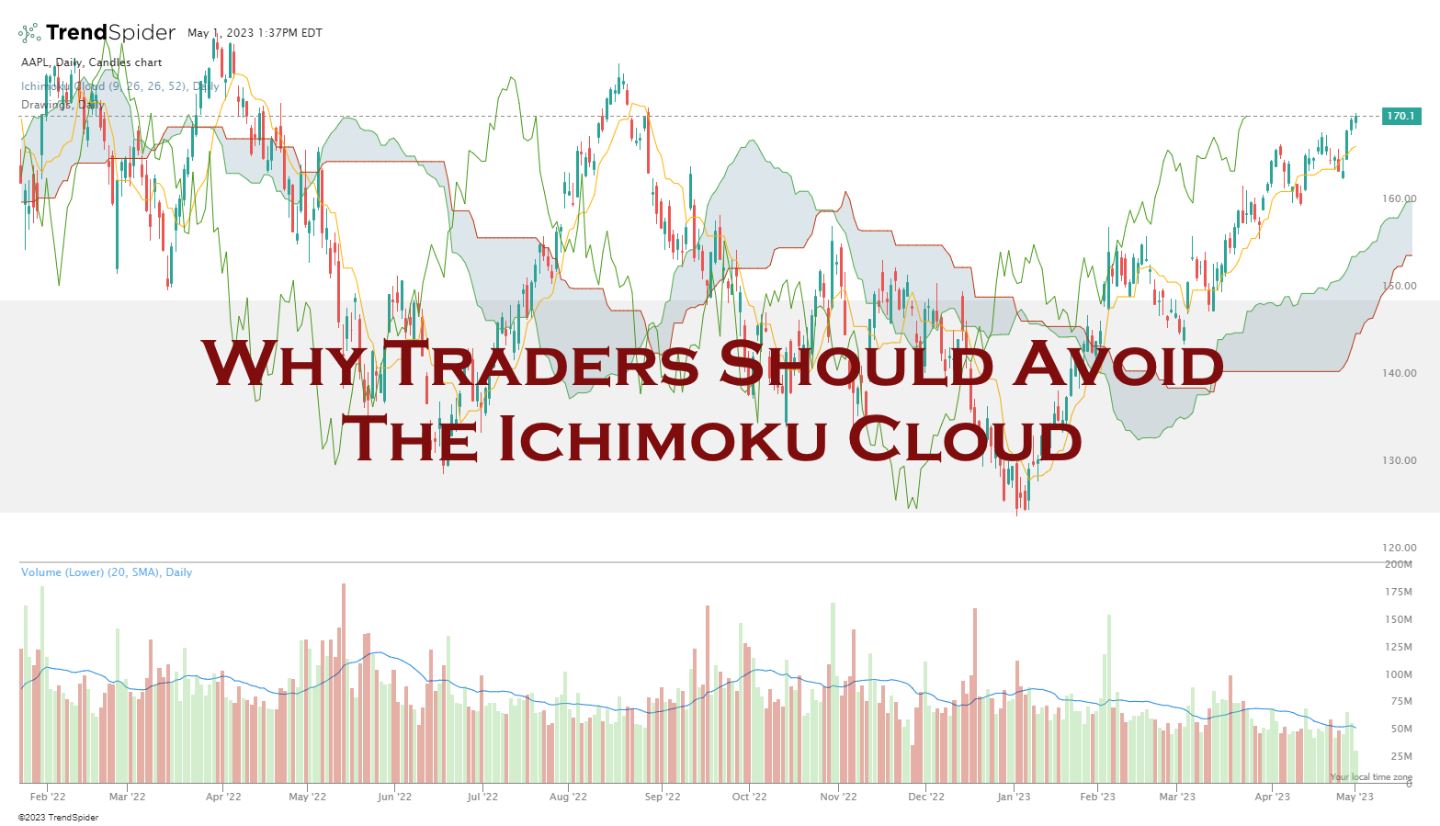
The Ichimoku test results are a dismal 10% win rate, underperforming a buy-and-hold strategy 90% of the time. The Ichimoku indicator is a poor choice for traders.| Liberated Stock Trader
The average true range (ATR) is a nondirectional momentum indicator that measures price volatility. Our 1,205 test trades showed a solid 1.77 reward-to-risk ratio with an average 8.5% winning trade.| Liberated Stock Trader
TradingView scores 4.8/5.0 because it does everything well, and Finviz scores 4.3/5.0 because it lacks a community, live trading, and has inferior charts. However, Finviz excels at rapidly visualizing vast stock market data on a single screen.| Liberated Stock Trader
Seasonal trends refer to certain sectors, like retail, which often perform better during holiday seasons, while agricultural products might see spikes during harvest times.| Liberated Stock Trader
According to my research, during a bull market, investors should hold a stock for between 50 and 300 days to allow profits to develop optimally. The ideal hold time for swing traders is 45 days for an average profit of 30%.| Liberated Stock Trader
As a verified TrendSpider partner, my 30% discount code "LST30" will save you 30% on a monthly plan. Save 63% by using it on an annual subscription.| Liberated Stock Trader
My reliability testing of Bollinger Bands on the S&P 500, using 13,360 years of data, suggests it is an unprofitable indicator for traders. However, Bollinger Bands can be highly profitable, with the optimal settings.| Liberated Stock Trader
Our ultimate guide to technical analysis, with its 14 videos and detailed examples covering charts, trends, indicators, patterns, and tools, will fast-track your knowledge.| Liberated Stock Trader
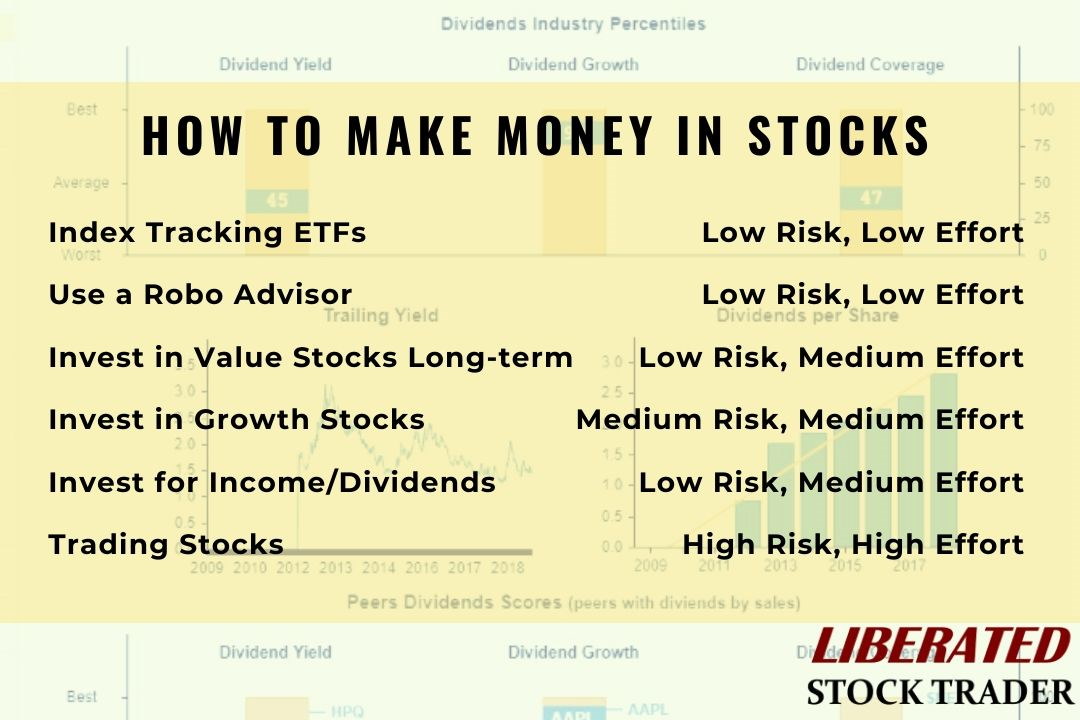
The five time-tested, proven ways to make money in the stock market are investing in long-term ETFs, investing in value stocks, a portfolio of growth stocks, dividends, and stock trading.| Liberated Stock Trader
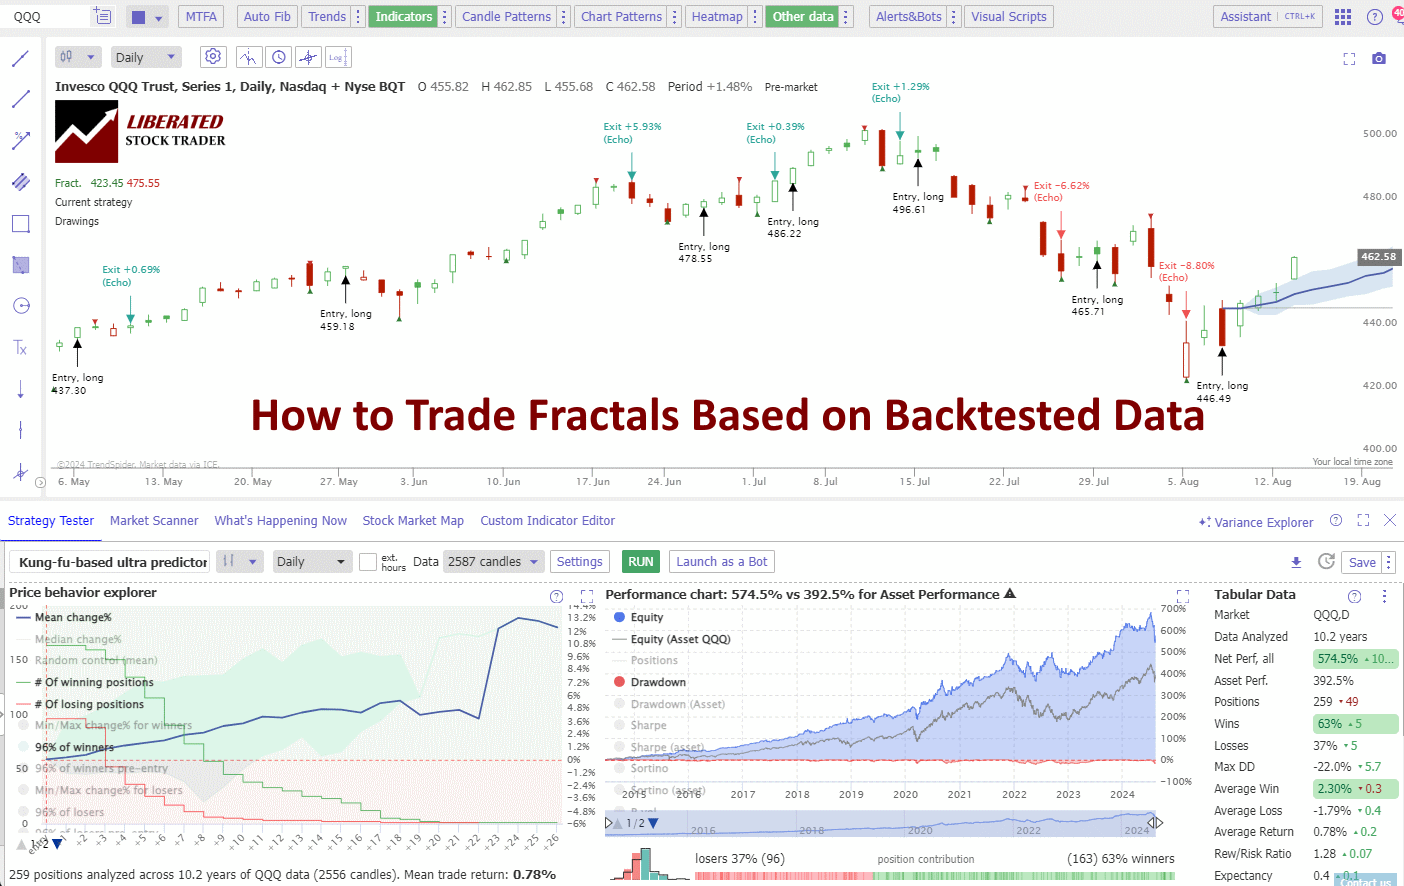
Based on 2,510 tested trades on 80 years of exchange data, I can confirm trading fractal patterns is profitable, with an average reward-to-risk ratio rate of 1.5 across all timescales.| Liberated Stock Trader
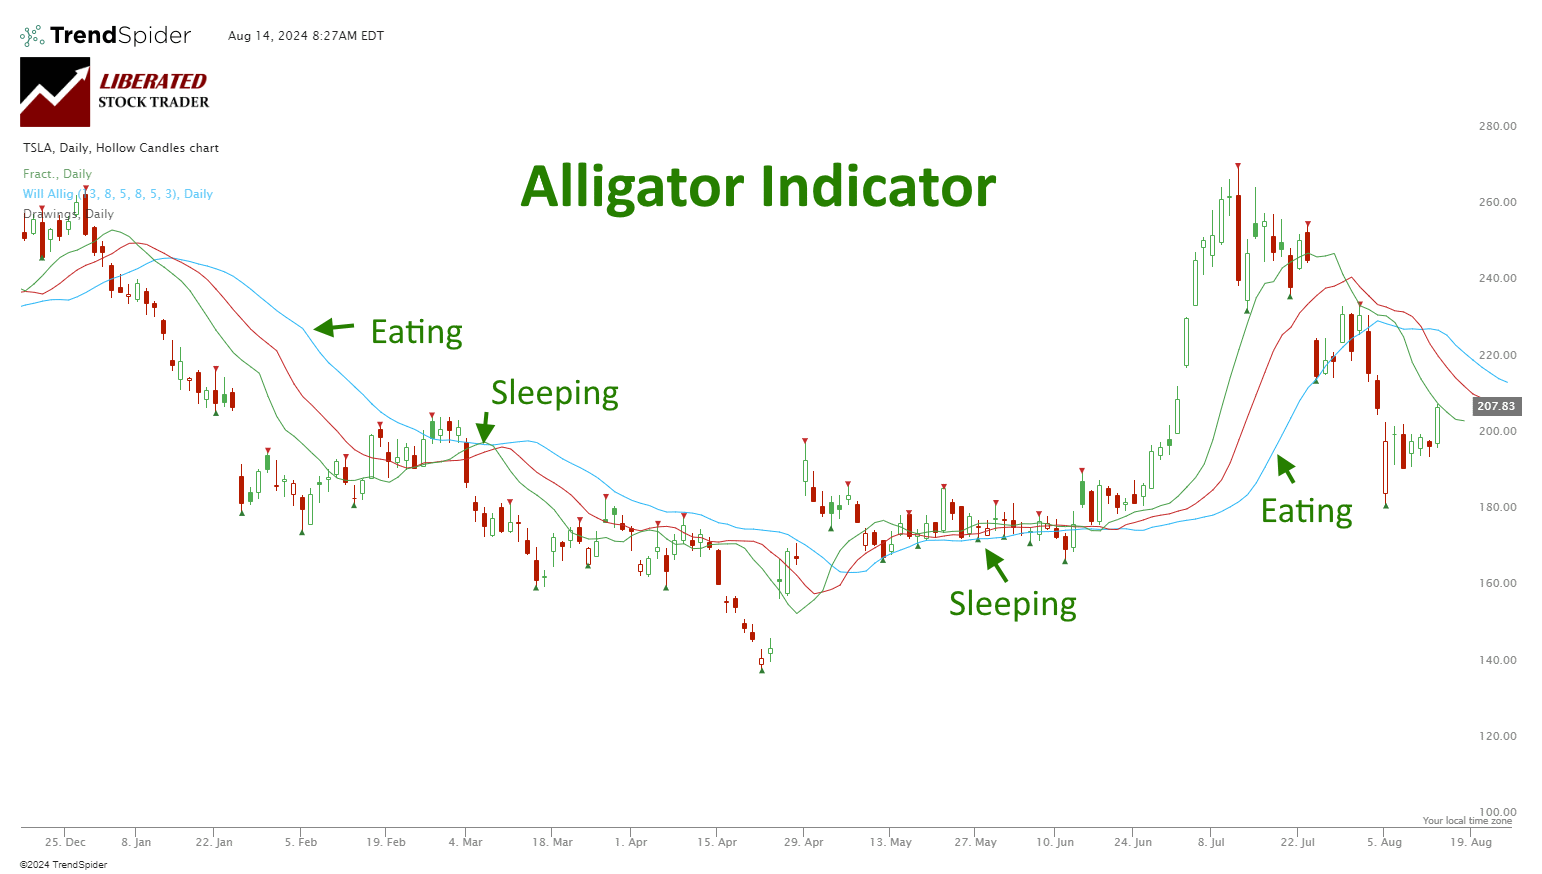
My unique research shows that the Alligator indicator is highly profitable in stocks and indices, using daily and weekly chart timeframes. It is also only profitable on a weekly chart for Forex.| Liberated Stock Trader
Ultimately, for 95% of speculators, day trading is not worth it. Although day traders can make significant money quickly, statistics show that most day traders lose money. Over a six-month period excessive commissions, poor trading decisions, weak strategies, and bad market timing cause losses.| Liberated Stock Trader
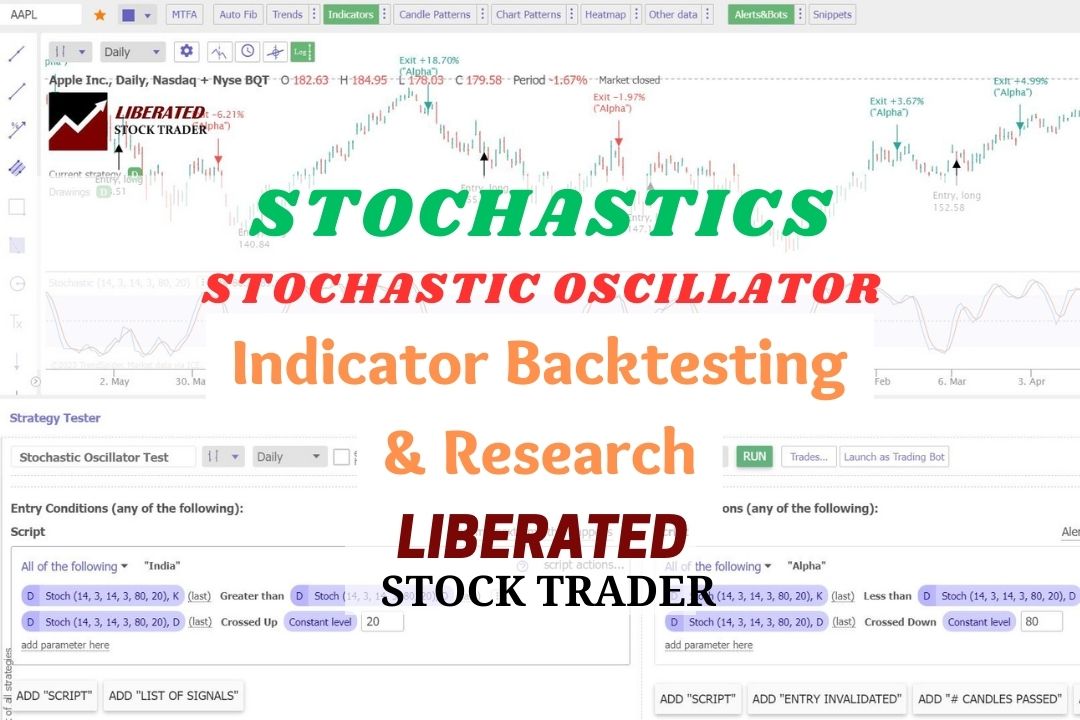
The Stochastic Oscillator momentum indicator compares an asset's closing price to a range of its previous prices. It oscillates between 0 and 100; below 20 indicates oversold, and above 80 suggests an overbought market.| Liberated Stock Trader
Decades of research have proven the most predictable bearish chart patterns are the inverted cup-and-handle, with an average price decrease of 17%, the rectangle top (-16%), head-and-shoulders (-16%), and the descending triangle (-15%).| Liberated Stock Trader
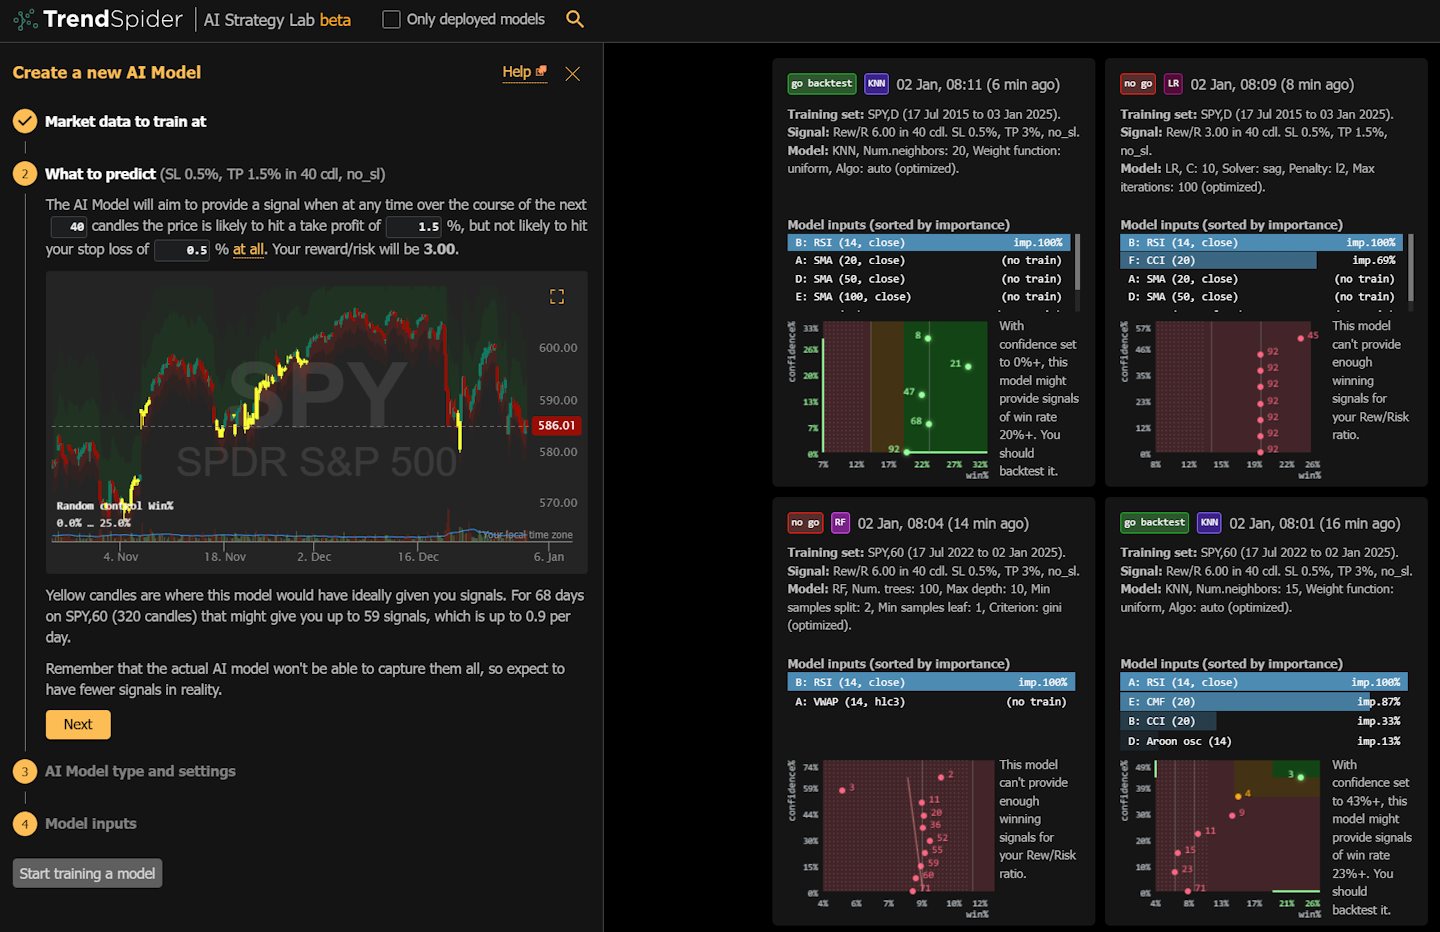
While platforms like TradingView and Trade Ideas offer many algorithms, only TrendSpider lets you fully train your own models. It’s a game-changer for traders looking to create unique strategies!| Liberated Stock Trader
To calculate the intrinsic value of a stock, estimate a company's future cash flow, discount it by the compounded inflation rate, and divide the result by the number of shares outstanding. The result is a stock's fair value.| Liberated Stock Trader
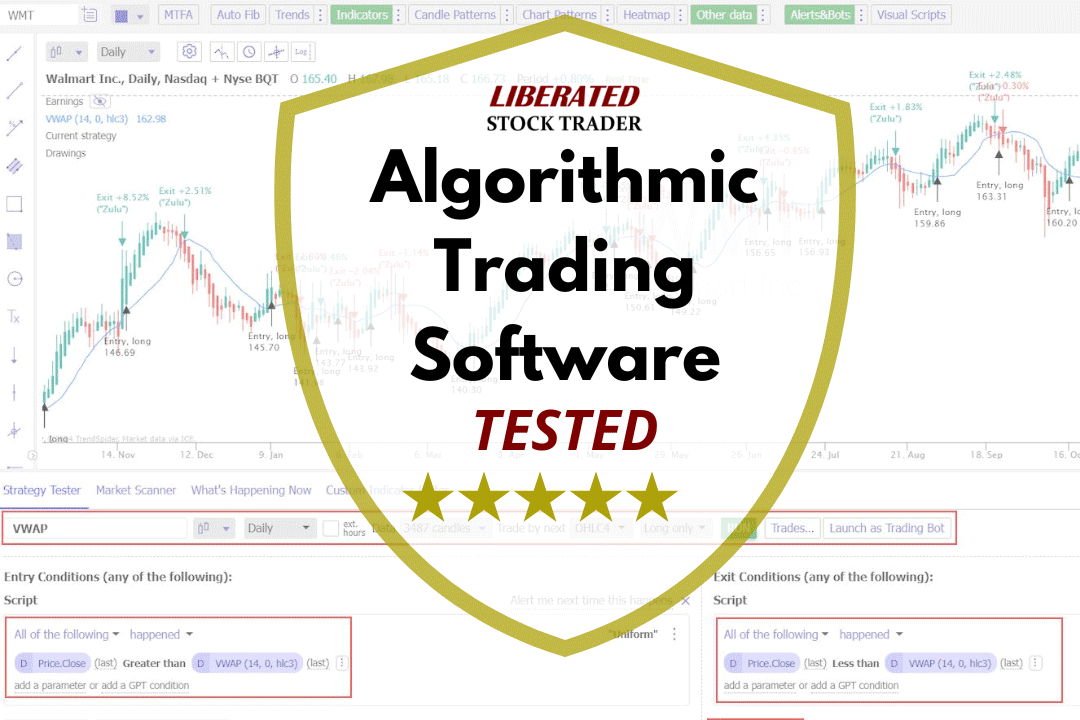
My testing shows that TrendSpider, Trade Ideas, TradingView, and Tickeron are the most effective software for creating, testing, and executing trading algorithms.| Liberated Stock Trader
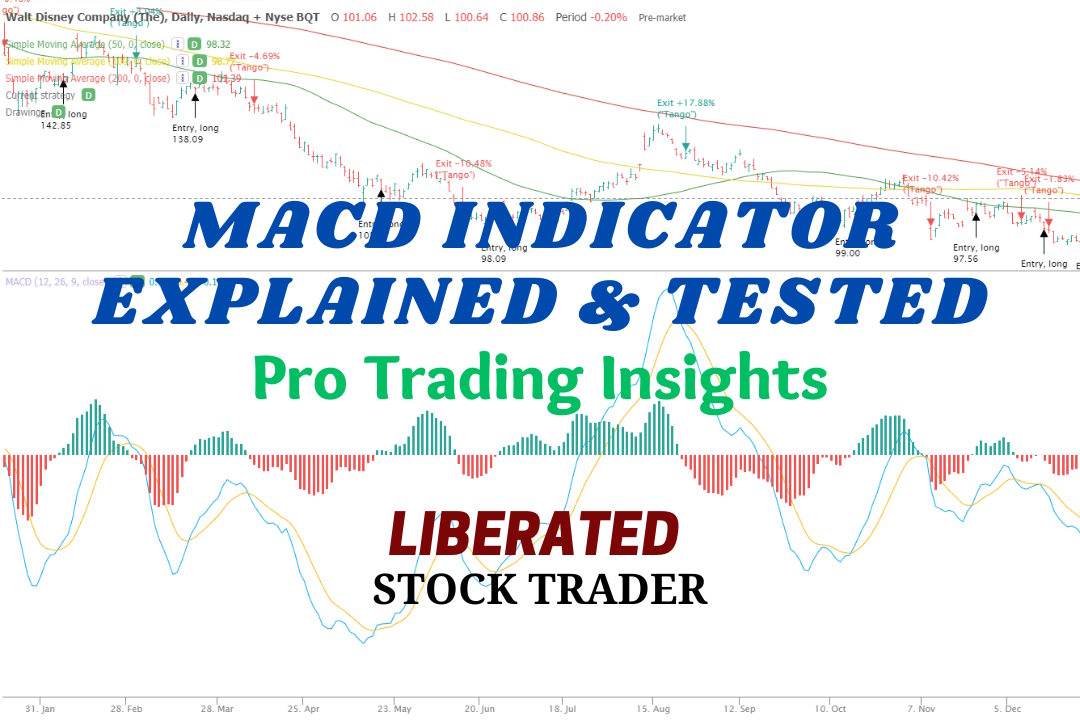
MACD is a trend-following momentum indicator used to identify price trends. We conducted 606,422 test trades to find the best settings and trading strategies.| Liberated Stock Trader
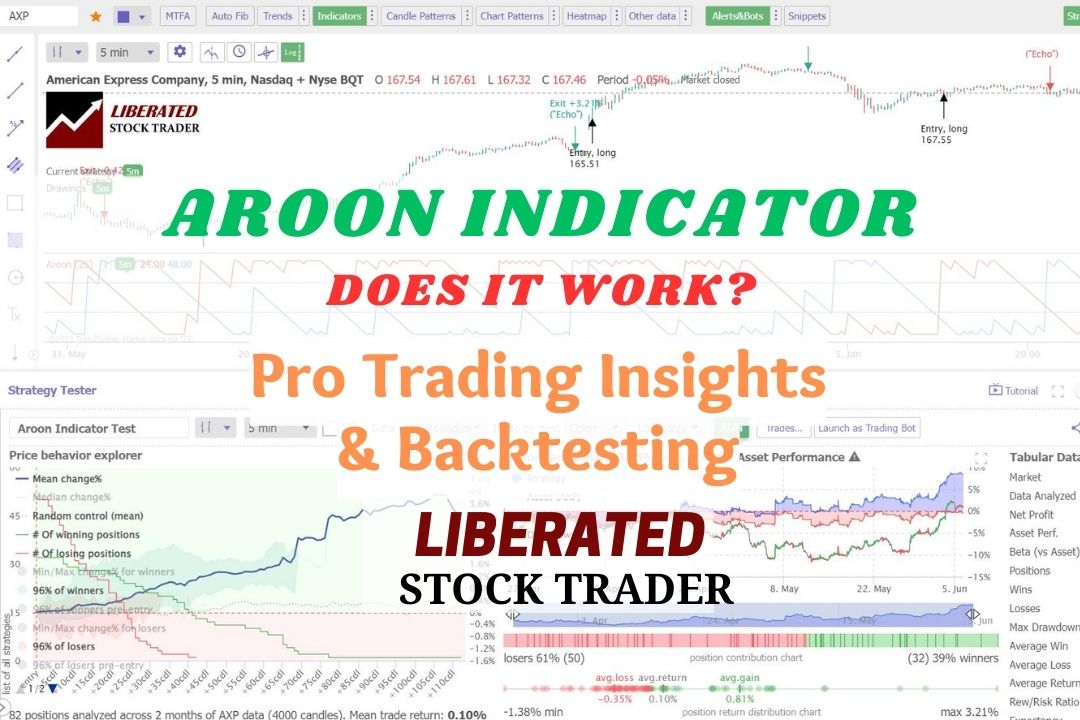
In technical analysis, the Aroon indicator identifies trend reversals and trend strength. This oscillating indicator has two parts: the "Aroon Up" line measures uptrend strength, and the "Aroon Down" line for downtrend strength.| Liberated Stock Trader
At Liberated Stock Trader we pride ourselves on delivering high-quality products that meet your needs. However, if the situation does occur and we do not meet| Liberated Stock Trader
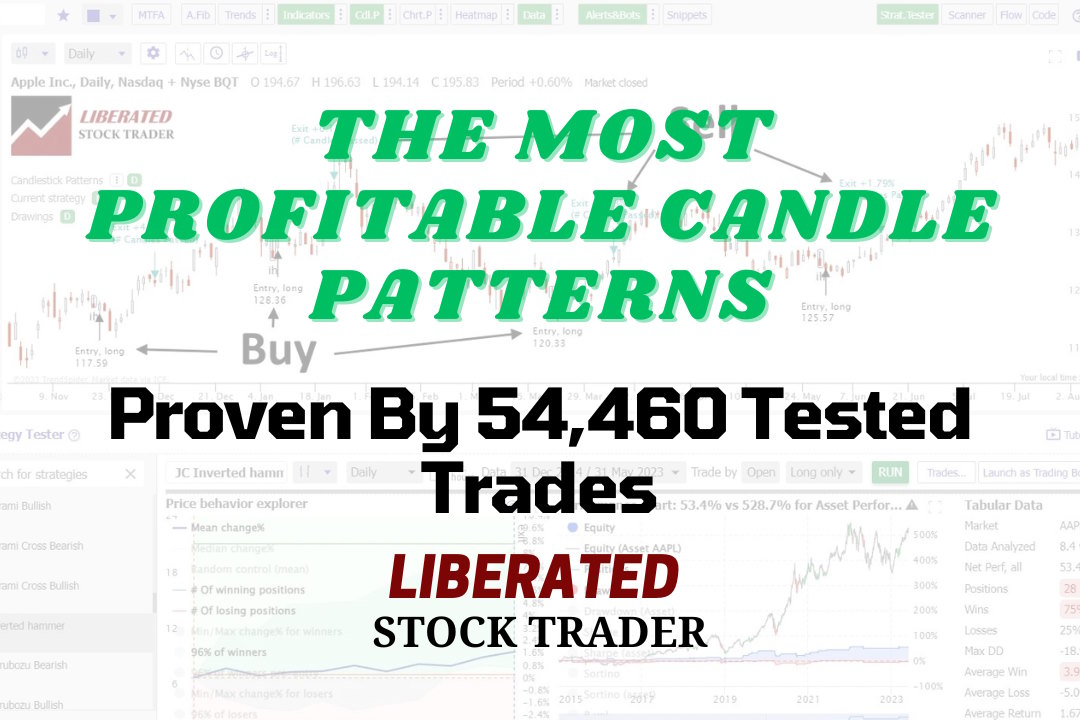
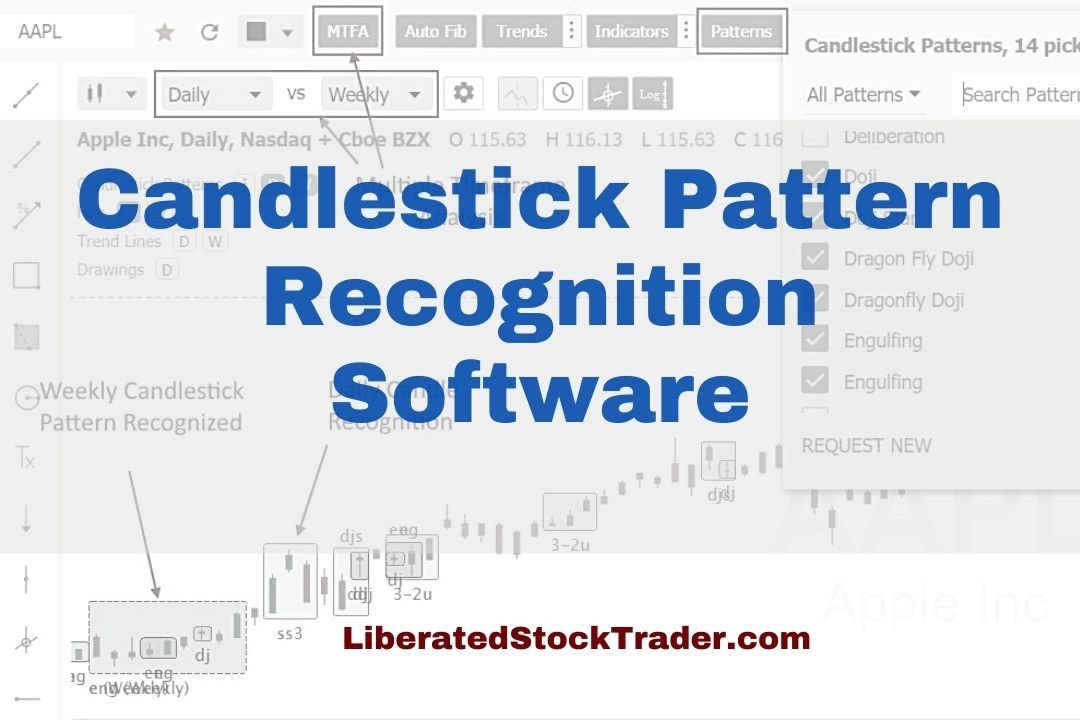
You can read candlestick charts using pattern recognition software to identify five reliable patterns, the Inverted Hammer, Bearish Marubozu, Gravestone Doji, Bearish Engulfing, and Bullish Harami Cross.| Liberated Stock Trader
My rigorous testing shows the most reliable candle patterns are the Inverted Hammer (60% success rate), Bearish Marubozu (56.1%), Gravestone Doji (57%), and Bearish Engulfing (57%). The inverted hammer is the most profitable candle pattern, with a 1.12% profit per trade.| Liberated Stock Trader
Day and swing trading uses technical chart analysis to trade short-term price moves, whereas growth and value investing use long-term fundamental financial analysis. The tools and strategies used for these types of trading are completely different.| Liberated Stock Trader
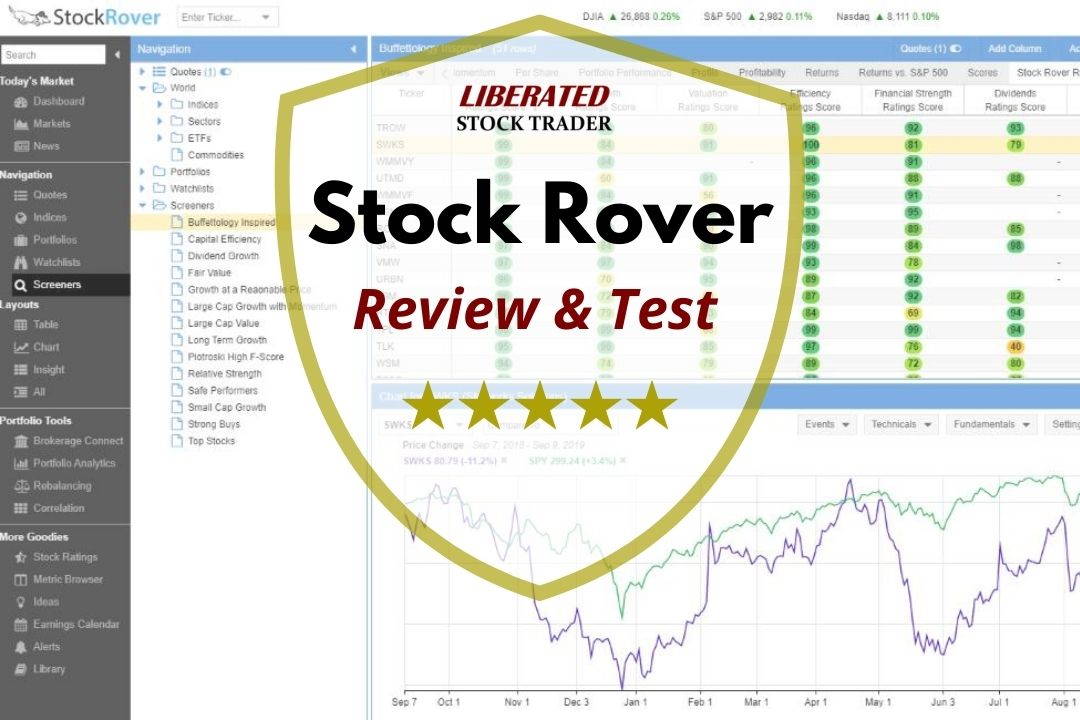
LiberatedStockTrader's review testing awards Stock Rover 4.7 stars. Its advanced screening, research, and portfolio tools are ideal for US value, income, and growth investors. With 650 financial metrics on 10,000 stocks and 44,000 ETFs, we rate Stock Rover the number one stock screener.| Liberated Stock Trader
To read stock charts you need to use stock charting software, select your chart type, configure your timeframe, determine price direction using trendlines and use indicators to estimate future prices.| Liberated Stock Trader
My comparison of Stock Rover vs. Finviz reveals that Stock Rover is best for screening, stock research, and portfolio management. Finviz is better at stock pattern recognition and heat maps. I wholeheartedly recommend Stock Rover.| Liberated Stock Trader
To create an algo trading system, you must choose a strategy, select a trading platform, choose the asset type, select the indicators and patterns, backtest, and refine the strategy.| Liberated Stock Trader
Our MetaStock review and test reveal an excellent platform for traders, with 300+ charts and indicators for stocks, ETFs, bonds & forex globally. Metastock has solid backtesting and forecasting, and Refinitiv/Xenith provides powerful real-time news and screening.| Liberated Stock Trader
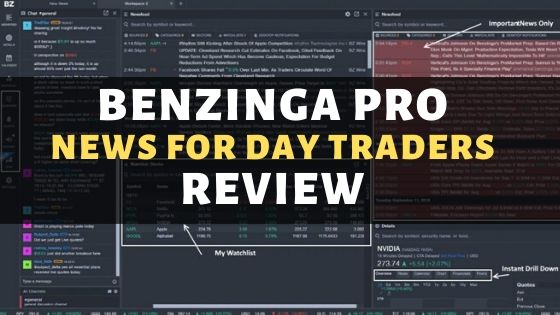
My extensive testing of Benzinga Pro review reveals a trustworthy real-time news screening and charting service for day traders. It includes alerts, insider block trades scanning, and unusual options activity signals for US markets.| Liberated Stock Trader
The Relative Strength Index (RSI) is an oscillating momentum indicator that measures the speed and change of stock price movements. RSI uses a scale from 0 to 100 to indicate overbought or oversold conditions.| Liberated Stock Trader
The Rate of Change (ROC) is a momentum indicator that measures the speed and direction of asset price movements. It helps traders determine whether a security is trending and how quickly its price changes.| Liberated Stock Trader
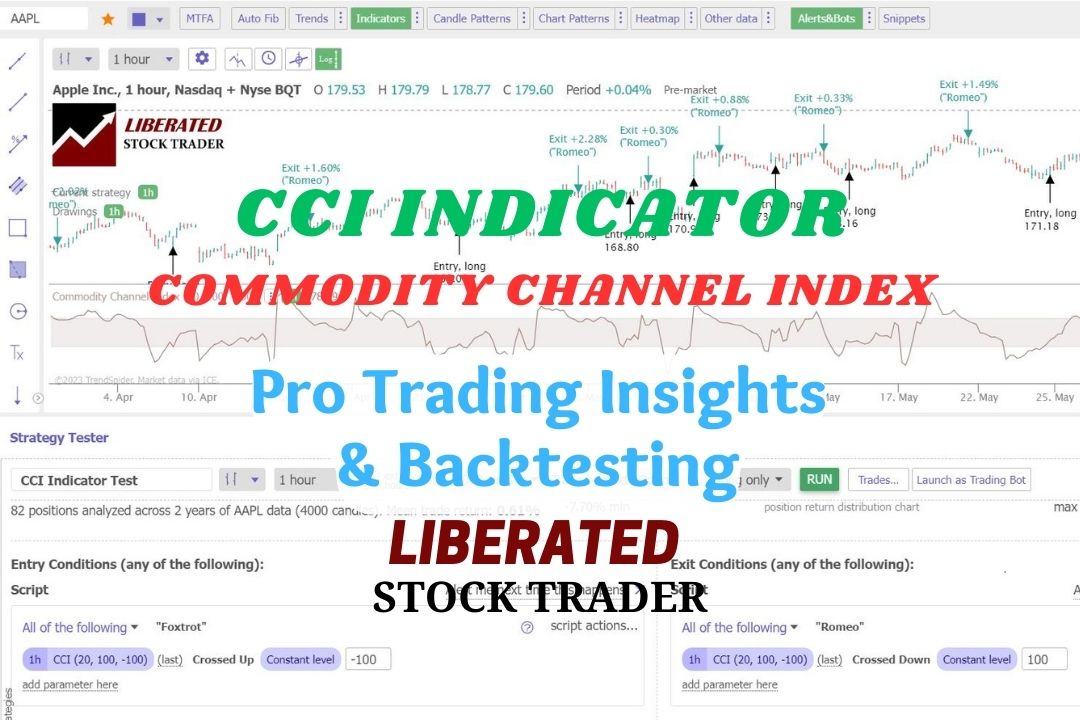
Our test data shows that using the CCI indicator with a 50 setting on the S&P 500 index stocks over 20 years was incredibly profitable, returning a 1,108% profit compared to the market, which returned 555%.| Liberated Stock Trader
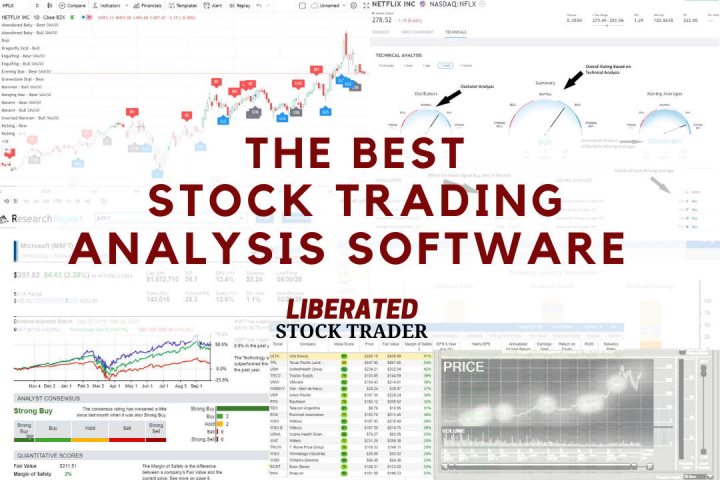
My in-depth testing shows that TradingView, TrendSpider, and Trade Ideas are the best tools for traders, and Stock Rover is superior for investors. Each provides unique benefits, features, and price points.| Liberated Stock Trader
My research shows the best stock market websites are TrendSpider for automated stock analysis, TradingView for charts and community, Trade Ideas for AI day trading, and Motley Fool for stock research. Benzinga Pro is the best site for real-time financial news.| Liberated Stock Trader
My 2025 testing awards TradingView 4.8 stars due to its continued innovation in chart analysis, pattern recognition, screening, and backtesting. TradingView is my top recommendation for US and international traders.| Liberated Stock Trader
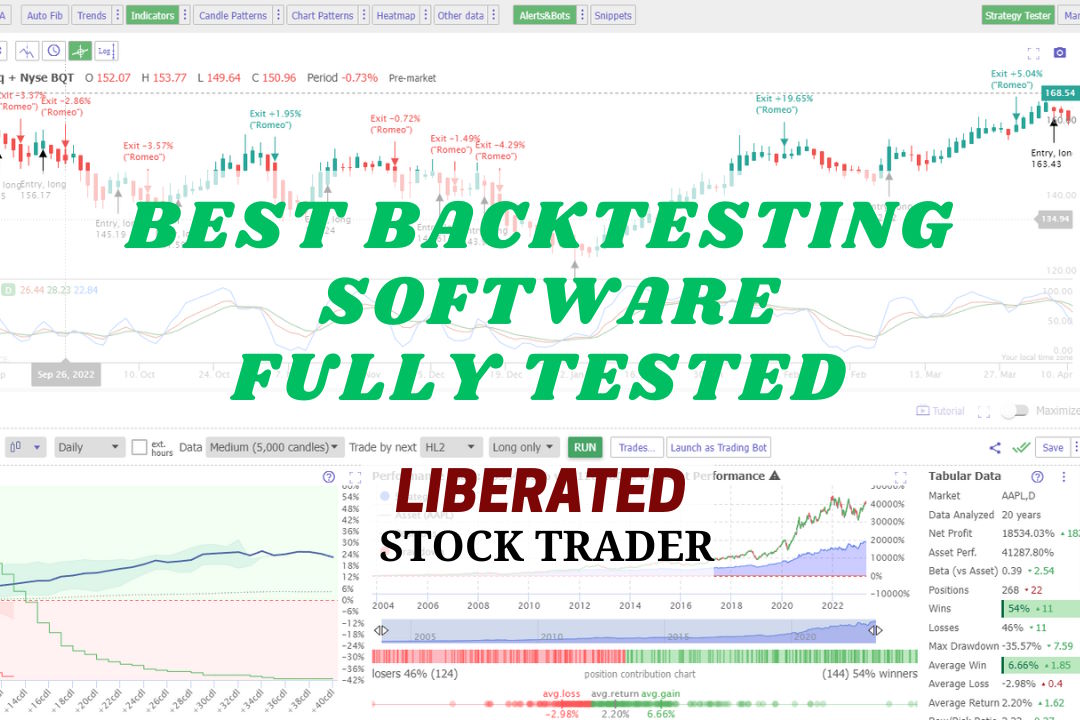
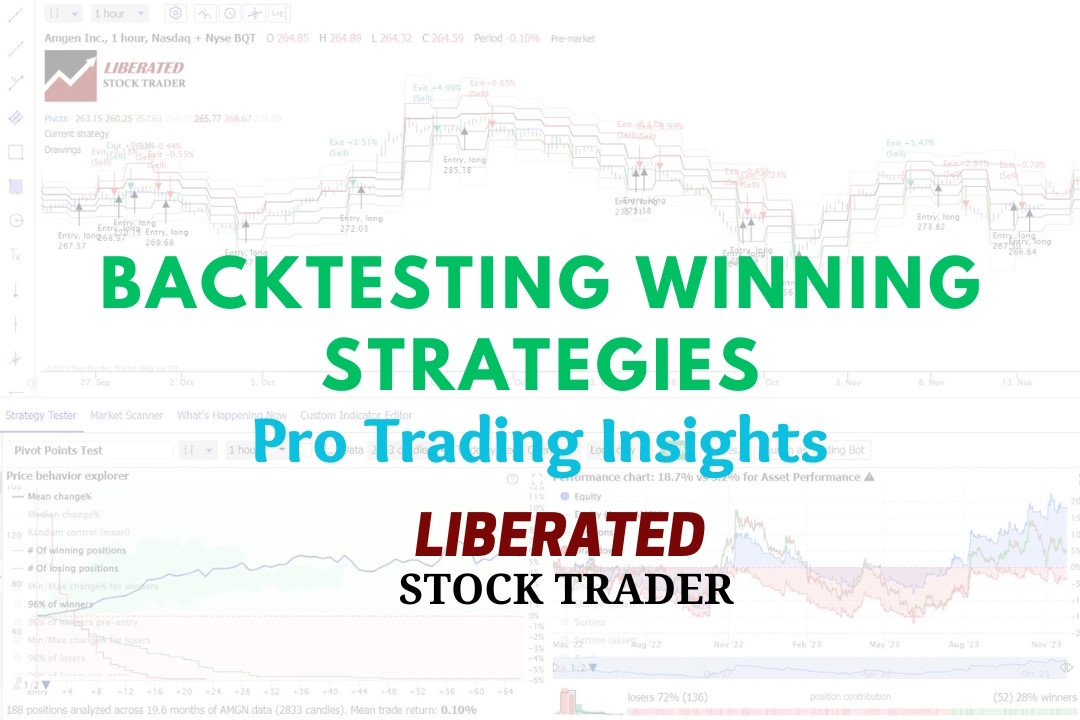
My research shows the best stock backtesting and auto-trade software are TrendSpider, Trade Ideas, and Tradingview. My testing process selected TrendSpider as the overall winner because it offers the most flexible, code-free, multilayer backtesting.| Liberated Stock Trader
My test results show the best financial news services are Benzinga Pro, MetaStock R/T, Bloomberg, the Wall Street Journal, and the Economist. Each provides trustworthy stock market news for investors.| Liberated Stock Trader
Testing reveals the best stock chart candlestick pattern recognition software is TrendSpider, TradingView, MetaStock, and Finviz.| Liberated Stock Trader
My research identifies Trade Ideas and TrendSpider as the leaders in AI trading software. Trade Ideas offers automated trading and bots, while TrendSpider offers automated pattern recognition, auto-trading, and backtesting.| Liberated Stock Trader
Our research on 10,400 years of exchange data shows the best day trading indicators are the Price Rate of Change, VWAP, Weighted Moving Average, Hull Moving Average, Simple Moving Average, and RSI.| Liberated Stock Trader
The Hull Moving Average (HMA) is a highly responsive technical analysis indicator designed to reduce lag. Our research reveals it outperforms other moving averages.| Liberated Stock Trader
Experienced investors backtest their trading strategies to optimize their portfolios. Backtesting is a critical step that enables traders to assess the potential viability of a trading strategy by applying it to historical data.| Liberated Stock Trader
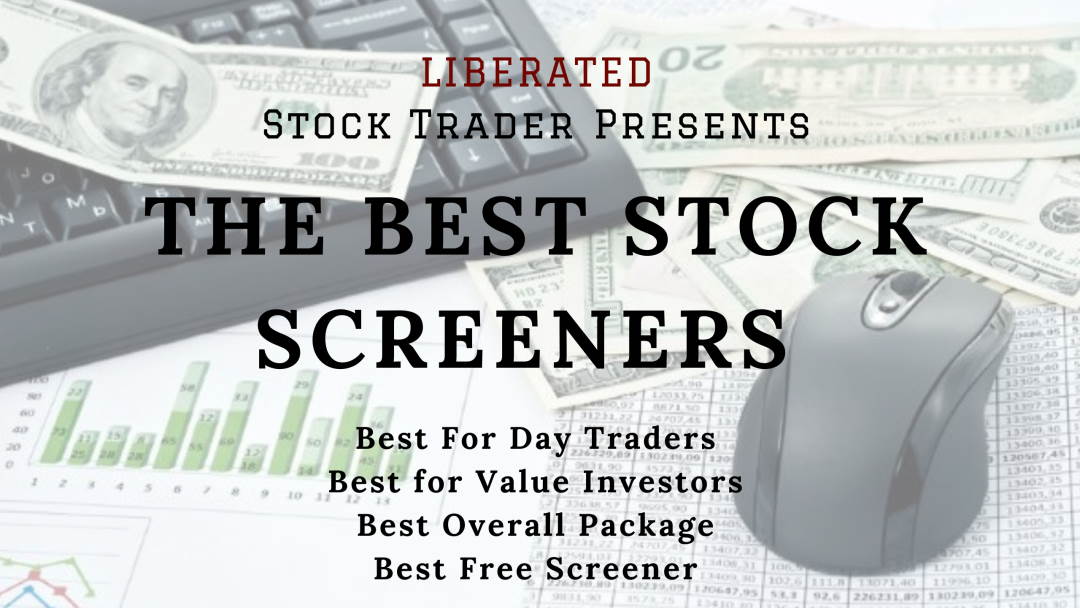
My rigorous testing shows the best free stock screeners are Stock Rover, TradingView, and Finviz. For premium screening, TrendSpider, Stock Rover, and Trade Ideas lead the pack.| Liberated Stock Trader
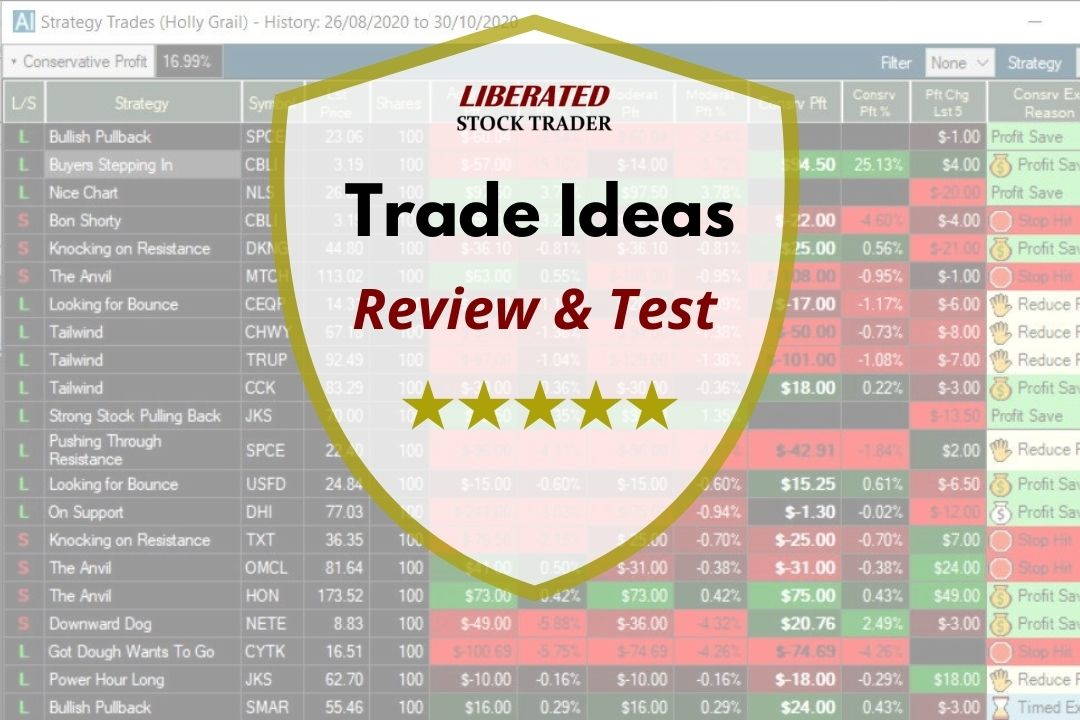
My in-depth testing shows Trade Ideas is the ultimate black box AI-powered day trading signal platform with built-in automated bot trading.| Liberated Stock Trader