
JetBrains and Azul claim big Kotlin performance gain from costly Zing JDK • DEVCLASS
JetBrains and Azul have announced a “strategic technical collaboration” to improve the performance of Kotlin applications running on […]| DEVCLASS
JetBrains and Azul have announced a “strategic technical collaboration” to improve the performance of Kotlin applications running on […]| DEVCLASS

Junie is one of the best coding agent I've been trying out so far. Very well integrated with IntelliJ, great for Kotlin, and the test first focus makes it quite good at coming out with good results. However, I do miss the capability to only accept part of a solution and it can be very slowwwwww.| Julien's DevRel corner
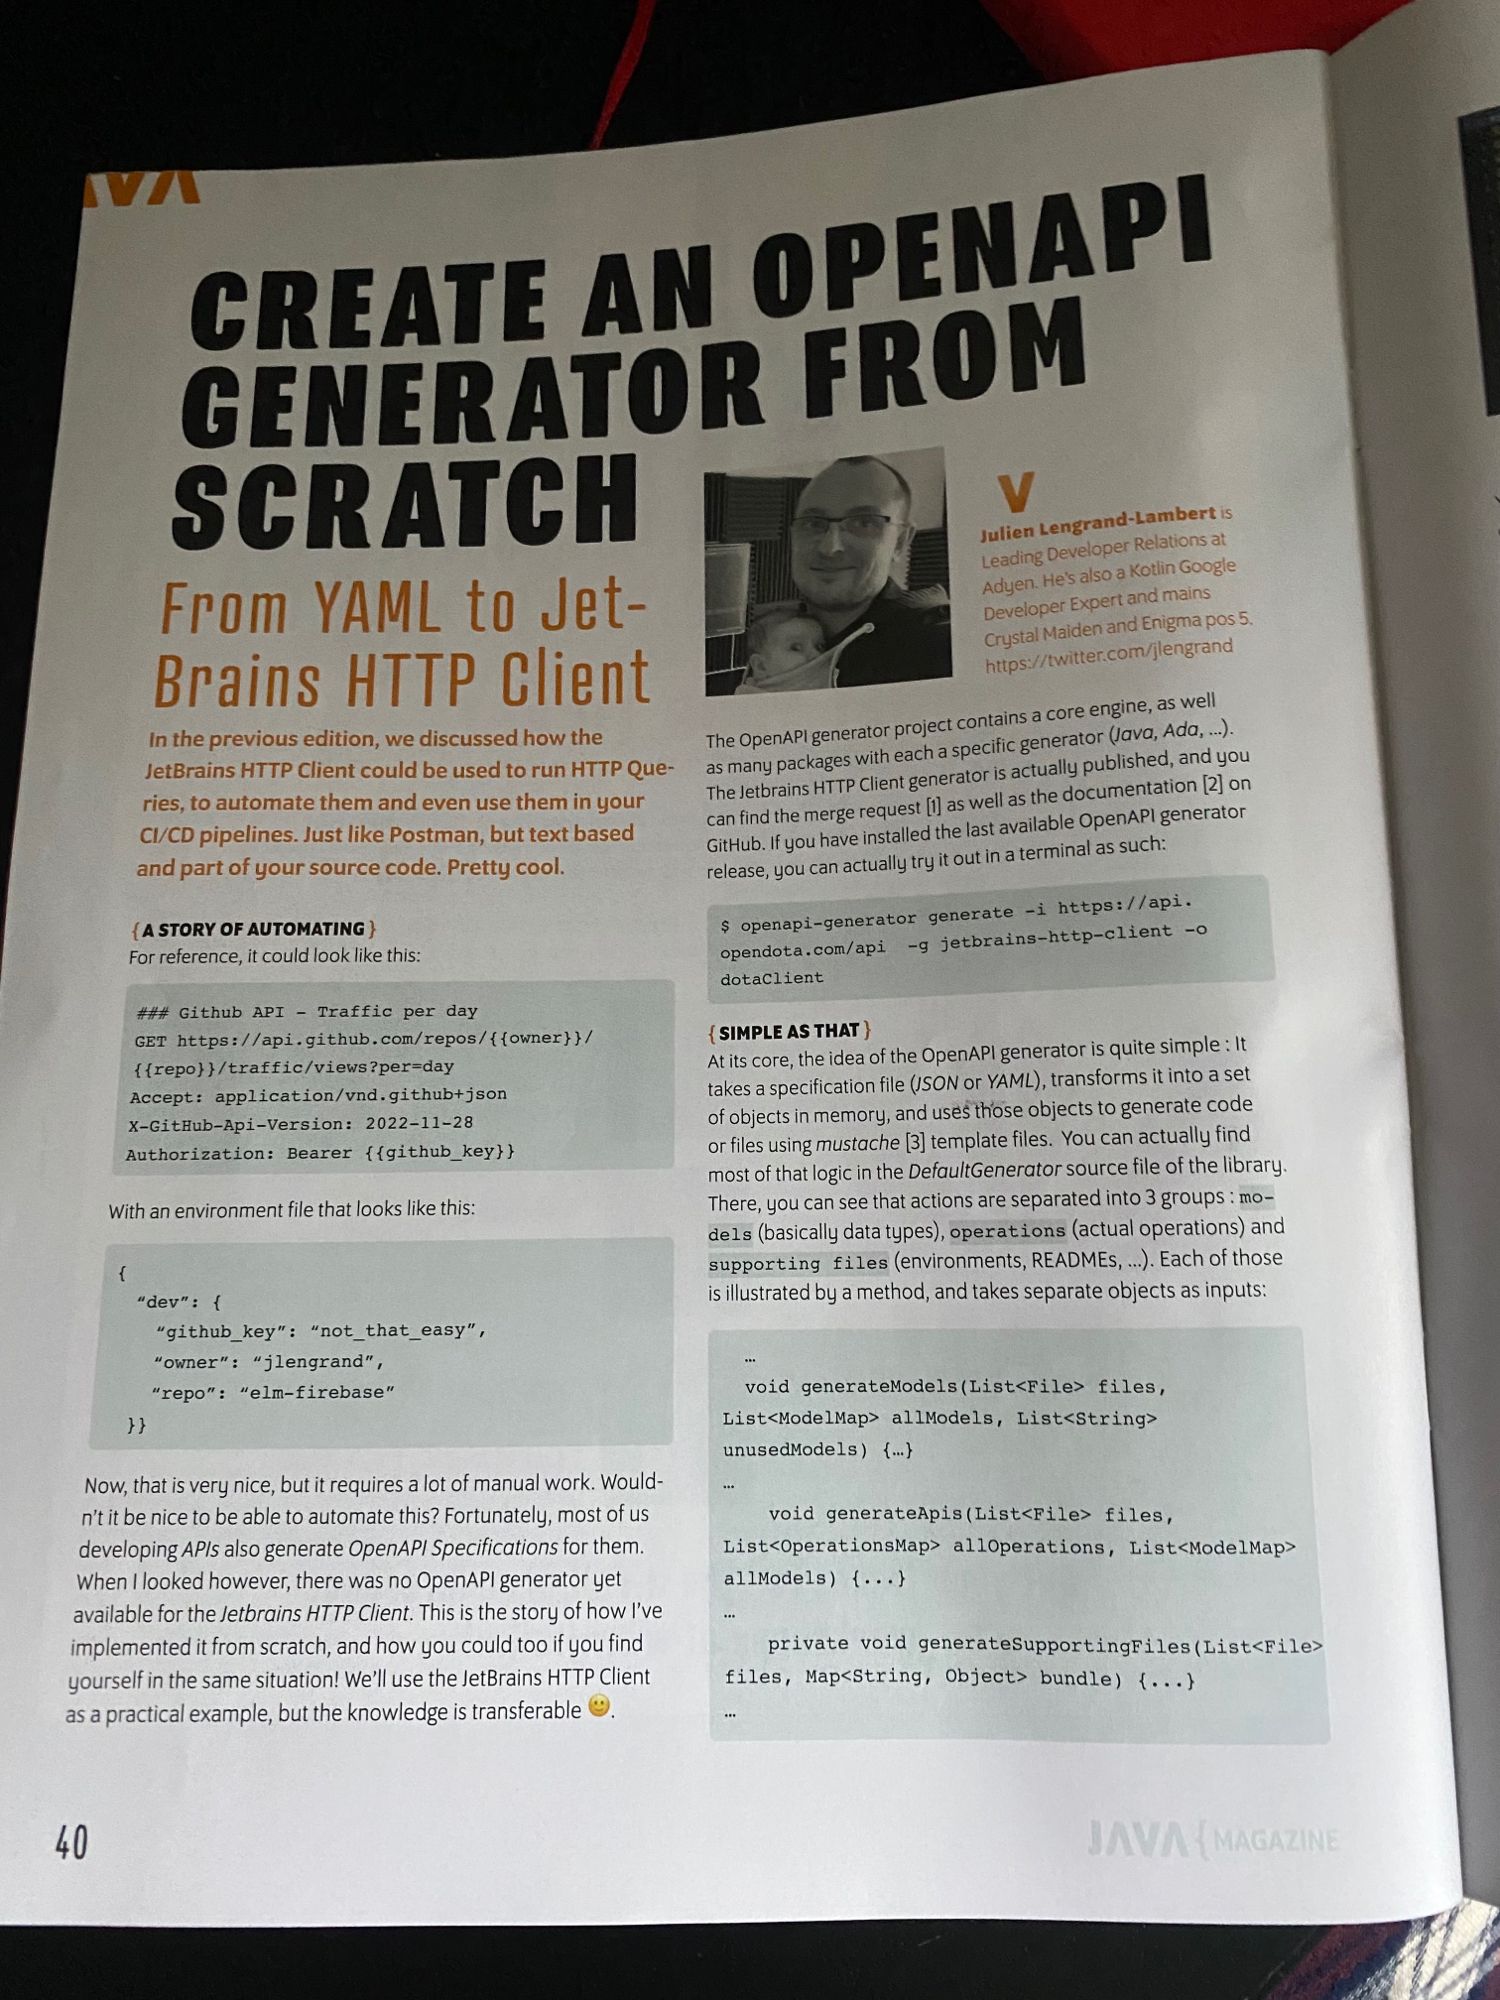
In this article, I'll be implementing an openapi generator from scratch so you can too! We'll be creating a very simple generator for the Jetbrains HTTP Client| Julien's DevRel corner

JetBrains has introduced a new AI coding agent called Junie, now in private preview for Mac and Linux only, a move towards agentic AI for developers, rather than just coding assistance.| DEVCLASS

JetBrains has published its 2025 plans for Rider, its cross-platform .NET IDE, including mixed mode debugging for .NET […]| DEVCLASS

JetBrains has published its State of Developer Ecosystem report, based on responses from over 23,000 developers, including data […]| DEVCLASS

Here is a list of Guru Alternatives (GetGuru alternatives) and, at the same time, an online collaboration tool and company knowledge base.| Klutch

JetBrains has updated its IDEs with the 2024.2 release, containing many new features including a radical change to […]| DEVCLASS

The Uno Platform team has released version 5.3 of its cross-platform framework for .NET, with full support for […]| DEVCLASS
In a previous post (Automating memory profiling with the JetBrains dotMemory Profiler API), I described the steps that could be used to automate the collection of memory snapshots and profiling data by using the JetBrains Profiler API NuGet package. In that post, we triggered the profiling session using the dotMemory application on Windows. As part […] The post Profiling Memory Allocations on Linux using the JetBrains dotMemory Command-Line Profiler appeared first on Steve Gordon - Code wit...| Steve Gordon – Code with Steve
Those who have read some of my previous performance-focused blog posts will know that I use the dotMemory product from JetBrains when working on code optimisations. In this post, I want to demonstrate a really handy, but somewhat underutilised feature, to automate the collection of snapshots in a repeatable way. I use these steps quite […] The post Automating Memory Profiling with the JetBrains dotMemory Profiler API appeared first on Steve Gordon - Code with Steve. --- Automating Memory Pr...| Steve Gordon – Code with Steve
