Automate DAX UDF With Semantic Link Labs
Learn how to automate DAX UDFs with Semantic Link Labs, centralizing user-defined functions for enhanced Power BI model management| Sandeep Pawar | Microsoft Fabric
xxx Your dashboards are more than just visualizations; they are decision-making engines. For organizations using Dynamics 365 Business Central, integrating Power BI creates an opportunity to turn transactional data into […] The post Maximizing Business Insights: Starting with the Right Dashboards in Power BI appeared first on ERP Software Blog. Related posts:Ep. 63: Interview with Kennie Pontoppidan | A Shot of Business Central and A Beer podcast From IT Start-Up to Global Player: On Poi...| ERP Software Blog
Learn how to automate DAX UDFs with Semantic Link Labs, centralizing user-defined functions for enhanced Power BI model management| Sandeep Pawar | Microsoft Fabric
Power BI Governance in Microsoft Fabric Ensure a Successful Power BI Deployment In Fabric, Power BI remains the front door to insights. Strong report governance helps your teams manage content growth, improve performance, and maintain trust in every dashboard. Companies across all industries understand they [...] The post Power BI Governance appeared first on Smartbridge.| Smartbridge
Power BI - An Optimal Self-Service BI Tool A modern self-service business intelligence approach means providing transparency and access to information, not only for management but also for business users. Power BI as a self-service BI tool can give your organization the capabilities it needs to empower your employees to [...] The post Power BI – An Optimal Self-Service BI Tool appeared first on Smartbridge.| Smartbridge
Before you dive too deep into a Power BI deployment, there are some Power BI best practices you should consider following. The post Power BI Best Practices appeared first on Smartbridge.| Smartbridge

Slow reporting is a silent tax. See how to centralize data, automate pipelines, enable self-service, and publish fast to cut BI latency and act on timely data.| PeopleInsight by HireRoad
Microsoft Power BI is fast becoming one of the leading business intelligence applications. If you’re serious about a data career you need to be an advanced Power BI user. In this article I take a look at the different ways you can quickly learn Power BI and open up roles... Read more » The post 3 Fastest Ways To Learn Power BI In The UK & Progress Your Career appeared first on Big Data Analytics News.| Big Data Analytics News

If you’ve been working with Direct Lake in Microsoft Fabric, you’ll know its magic resides in its ability to quickly load data. It loads data into semantic models from OneLake when needed. This feature eliminates the overhead of importing. But until recently, the first query on a cold cache might feel sluggish. Why? One reason … Continue reading Direct Lake Performance Gets a Boost: Faster Join Index Creation| Phil Seamark on DAX
Learn how Smartbridge helped an energy firm assess and revamp their current state IT with a digital strategy roadmap.| Smartbridge
One of the reasons Facebook is such a popular and successful marketing platform is the fact that it provides detailed insight that allows marketers to scale and optimize their campaigns with ease. Having fresh Meta Ads (Facebook Ads) in Power BI is very useful. Especially in case, you are investing heavily in Facebook and Power… Read More »How Connect Facebook Ads to Power BI: Ultimate Guide 2025 The post How Connect Facebook Ads to Power BI: Ultimate Guide 2025 appeared first on windsor.ai.| windsor.ai

Last week I had the pleasure to attend the Power BI Next Step conference in Copenhagen. I enjoyed it and can highly recommend it. As part of that event, I was invited to a fun “Power BI Shootout” session. Each competitor had 10 minutes to show something fun and creative using Power BI. There were … Continue reading Create Custom Visuals in Power BI with GitHub Copilot| Phil Seamark on DAX

Don't settle for manual validations before deploying Power BI reports. We can run Fabric notebooks to do this for us using Semantic Link Labs.| Data Architect as a Service | Remote DBA Services

See how the integration of AI and Looker enhances business intelligence, driving data-driven decisions and outcomes.| Govindhtech

Augmented analytics uses AI to deliver instant insights via chatbots, transforming BI for faster decisions. Discover how to get started.| XTIVIA Microsoft Solutions
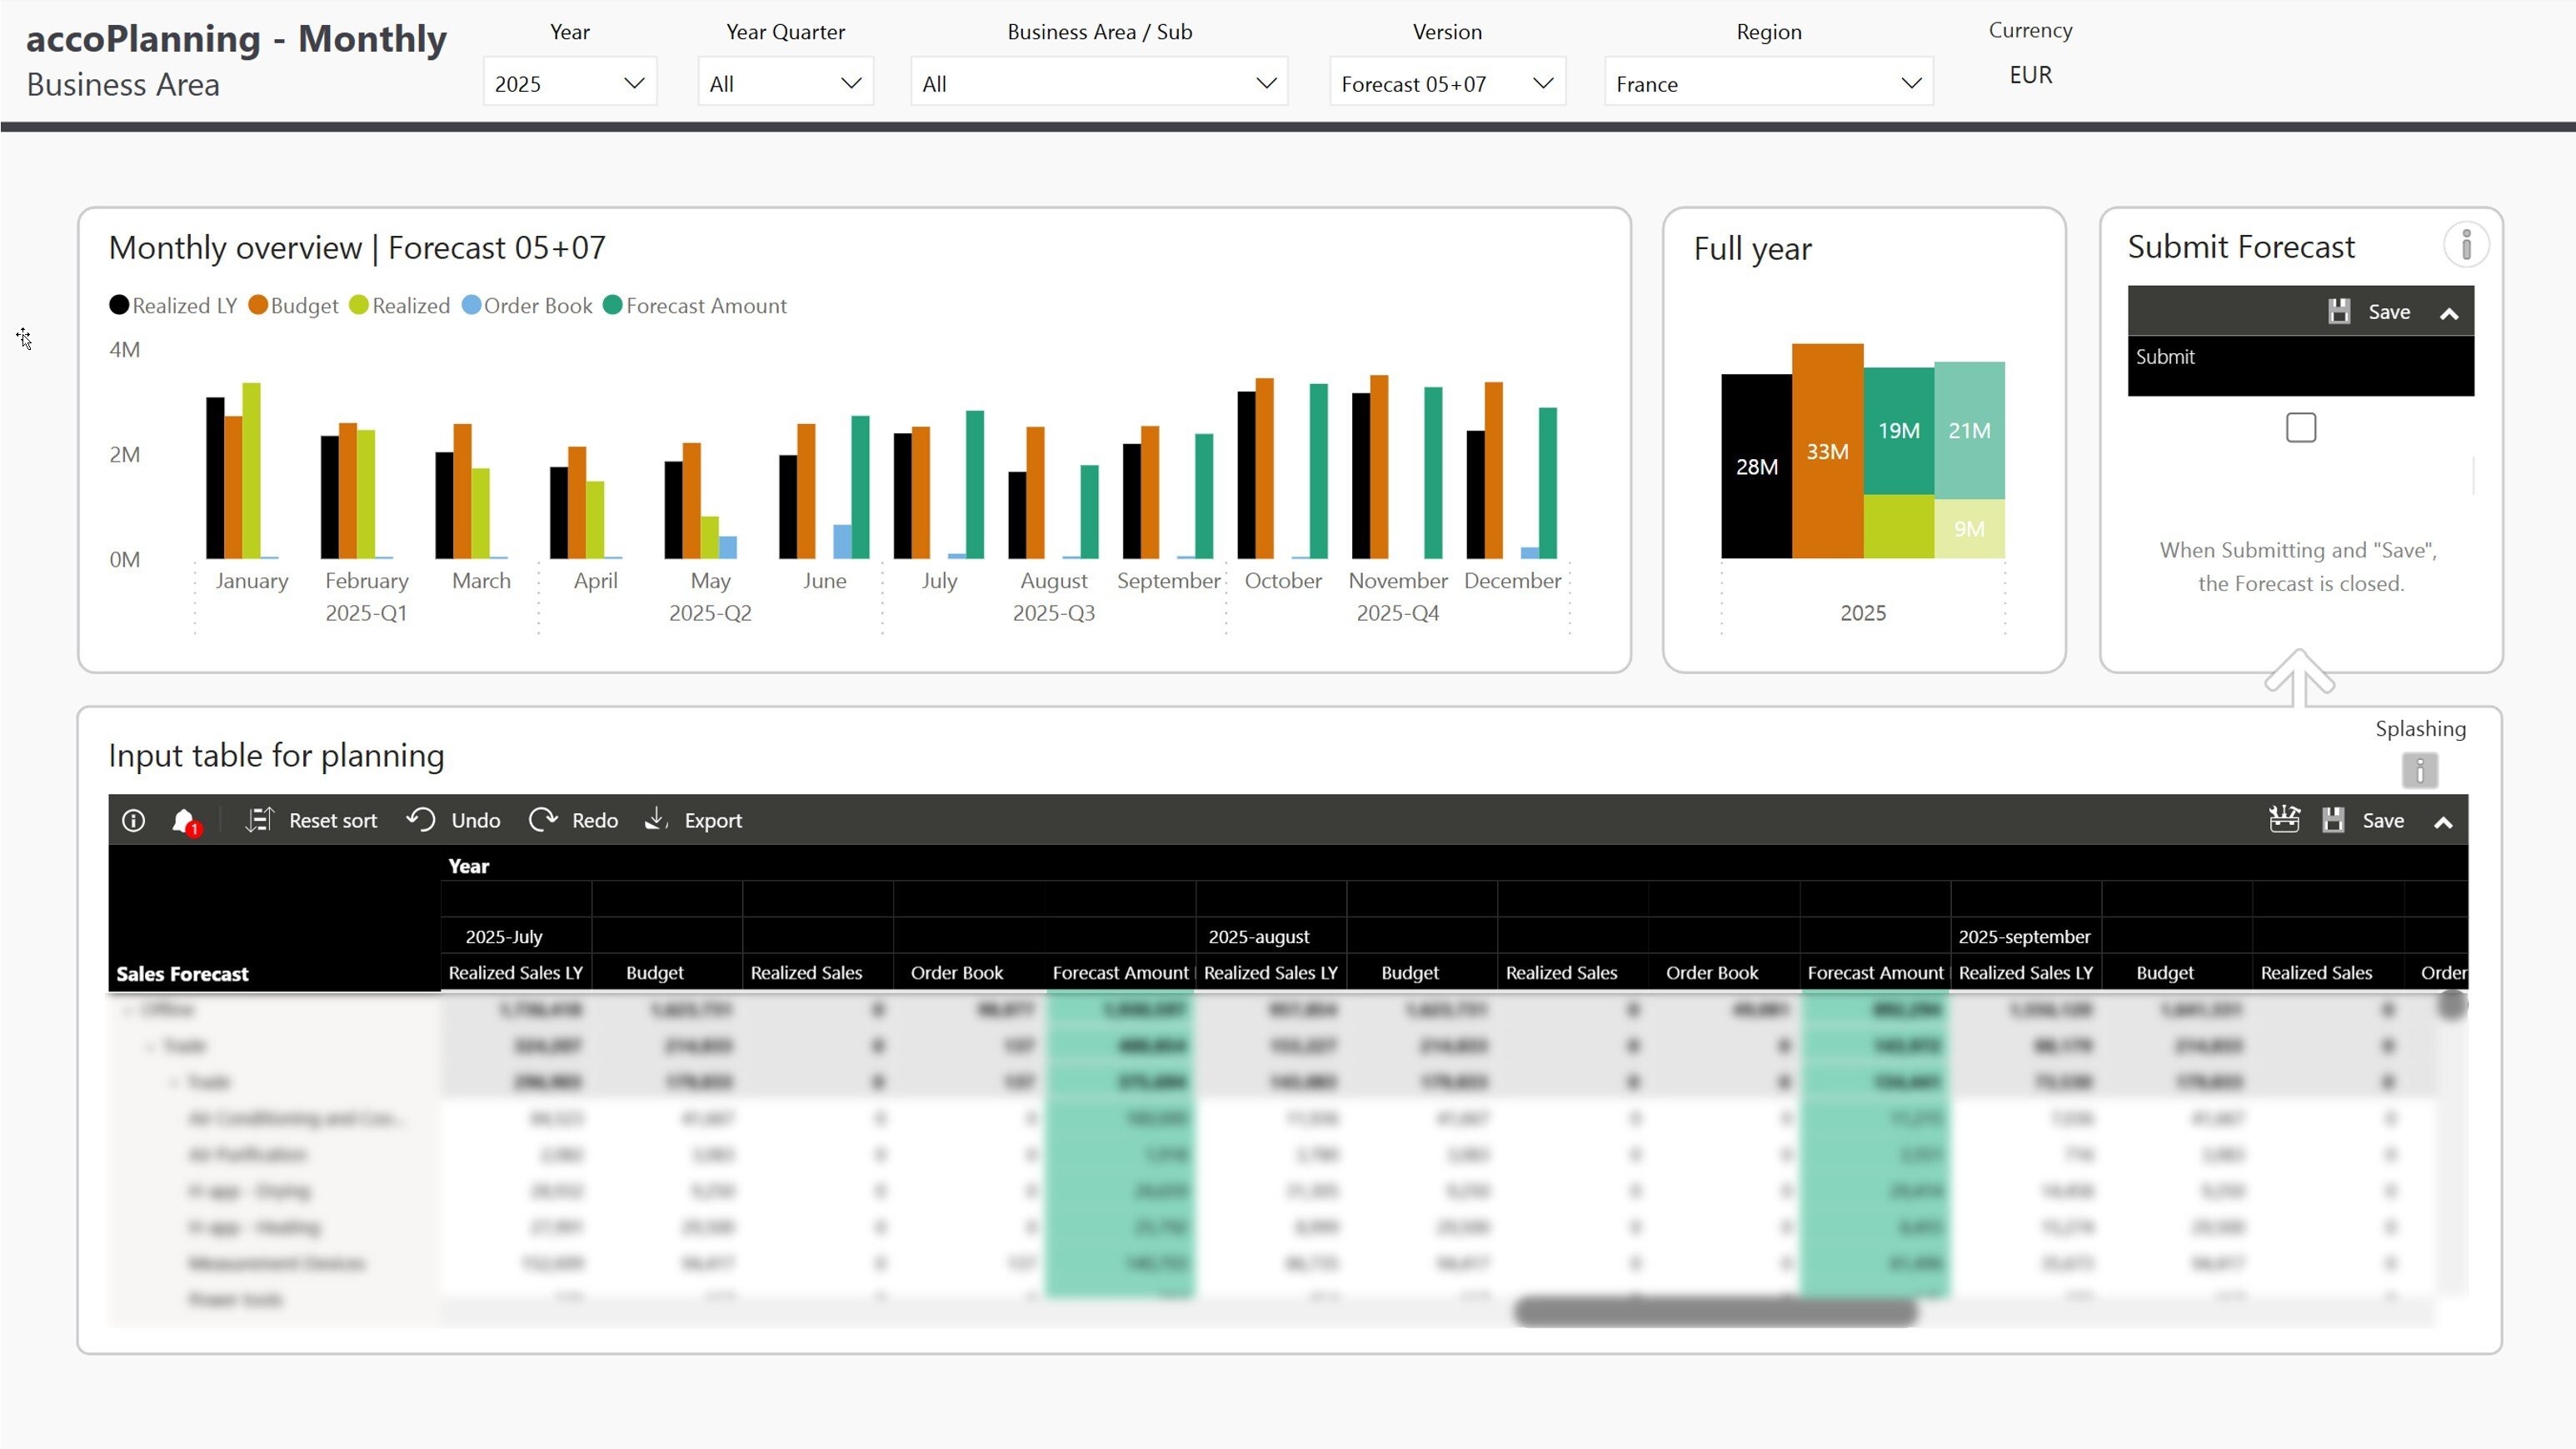
Bismart y Accobat se unen para permitir la edición y escritura de datos directamente en Power BI, como si fuera Excel. ¡Descubre cómo funciona!| blog.bismart.com

We’re at a point where the way we work with data is fundamentally shifting. Natural language is becoming the new interface, and tools like Microsoft Fabric are making it possible to ask questions a…| Data - Marc
Explore the new version of Semantic Link Labs for easily copying semantic model objects across models with the `copy_object()` method| Sandeep Pawar | Microsoft Fabric
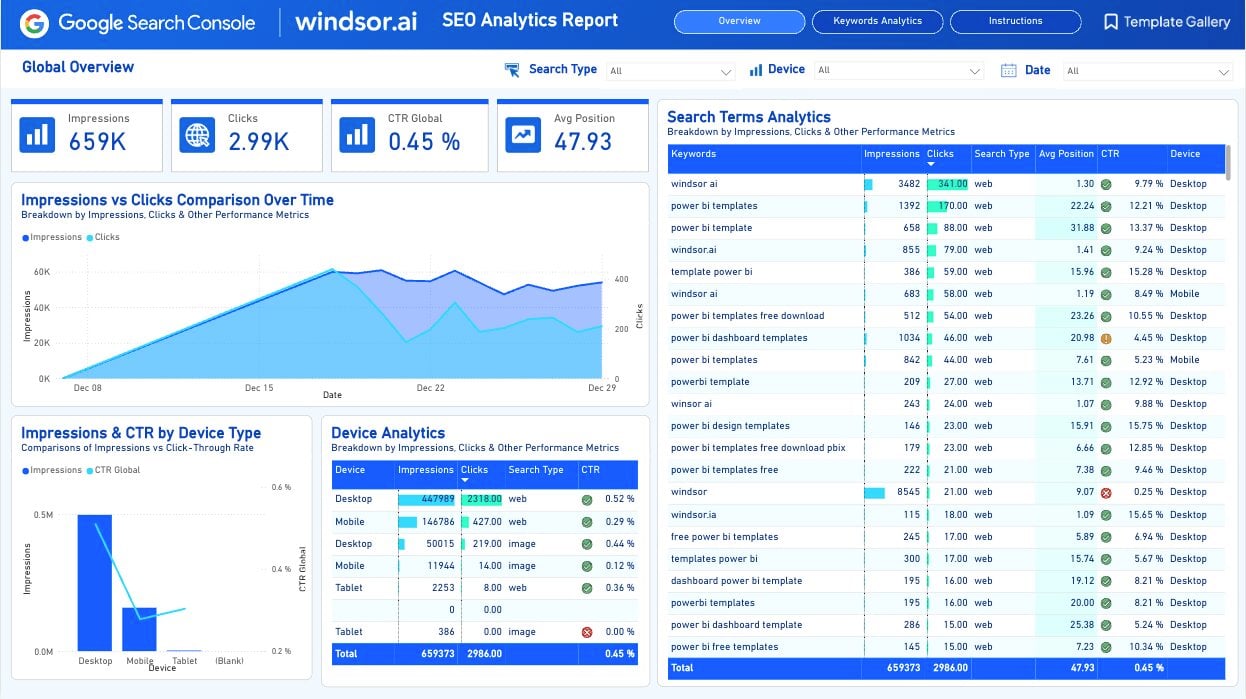
Connect your SEO Data to Power BI and automate your marketing reports without coding. Windsor.ai provides the dashboard template for free.| windsor.ai
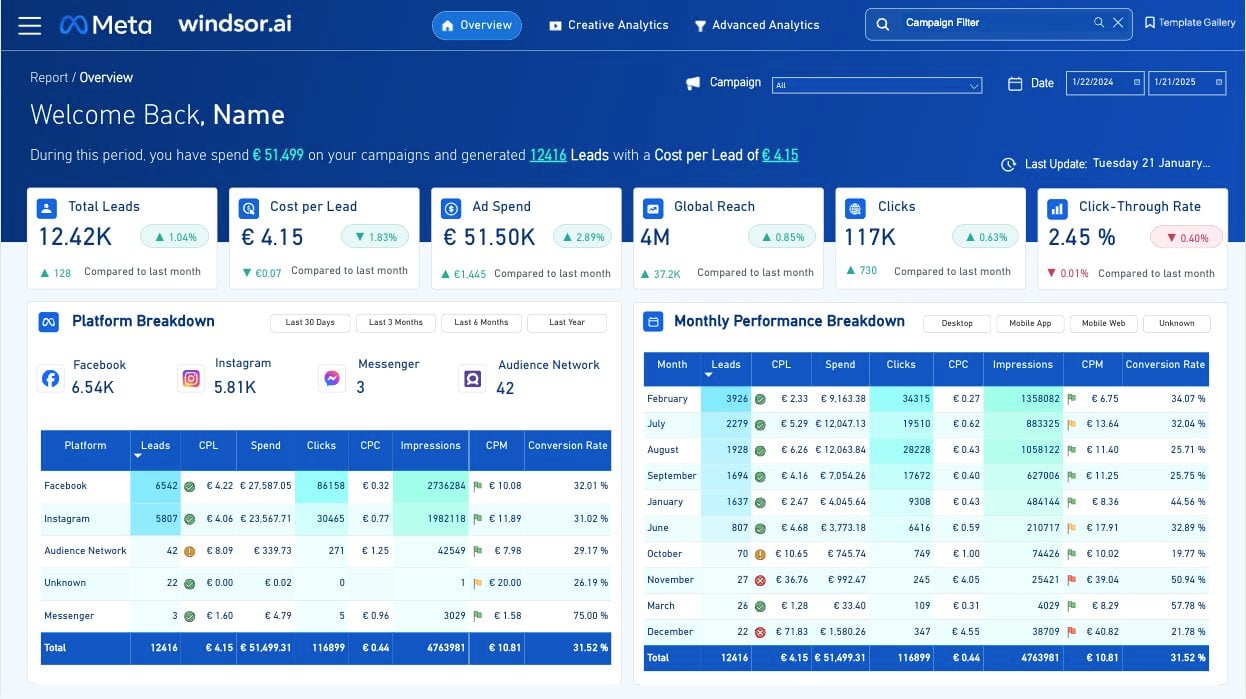
Connect to the Meta Ads template dashboard on Power BI to automate your marketing reports without coding. Windsor.ai provides the dashboard template for free.| windsor.ai
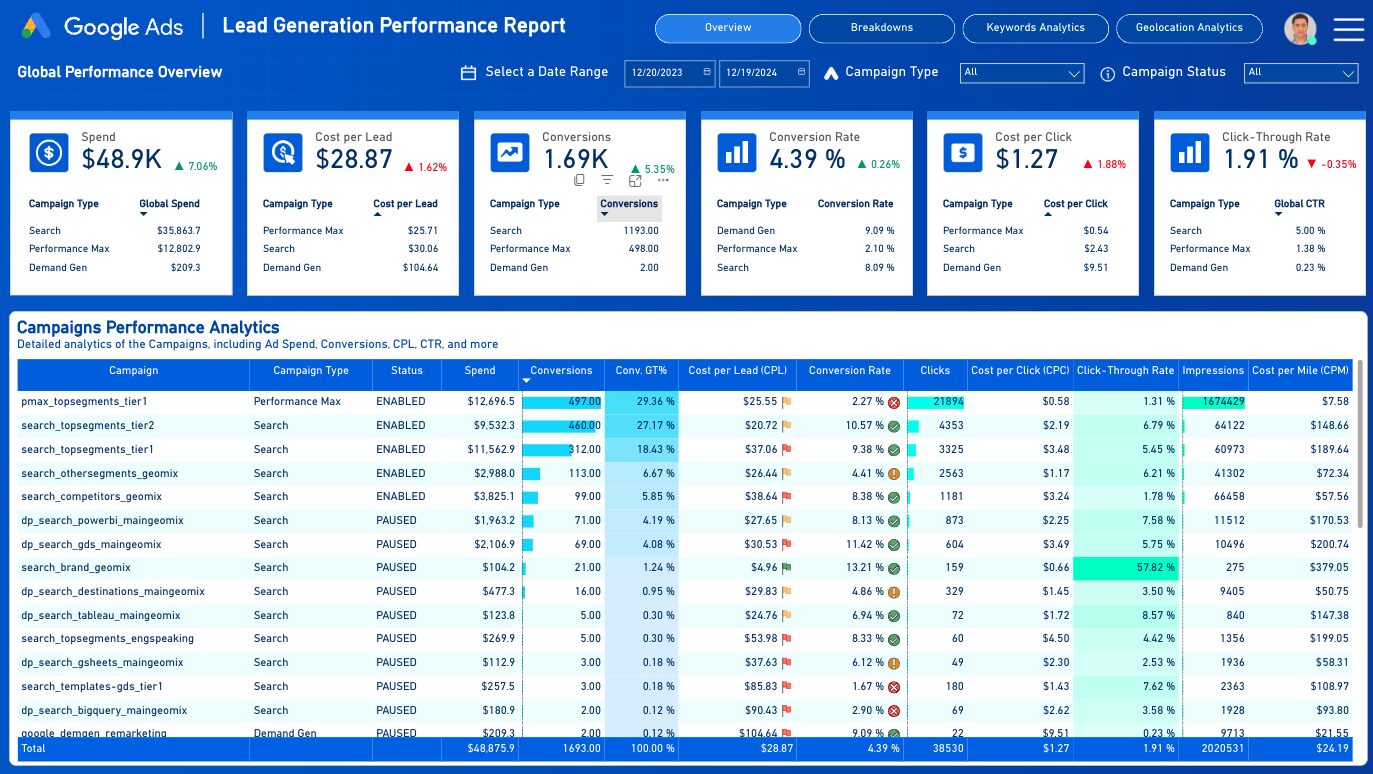
Connect to the Google Ads template dashboard on Power BI to automate your marketing reports without coding. Windsor.ai provides the dashboard template for free.| windsor.ai
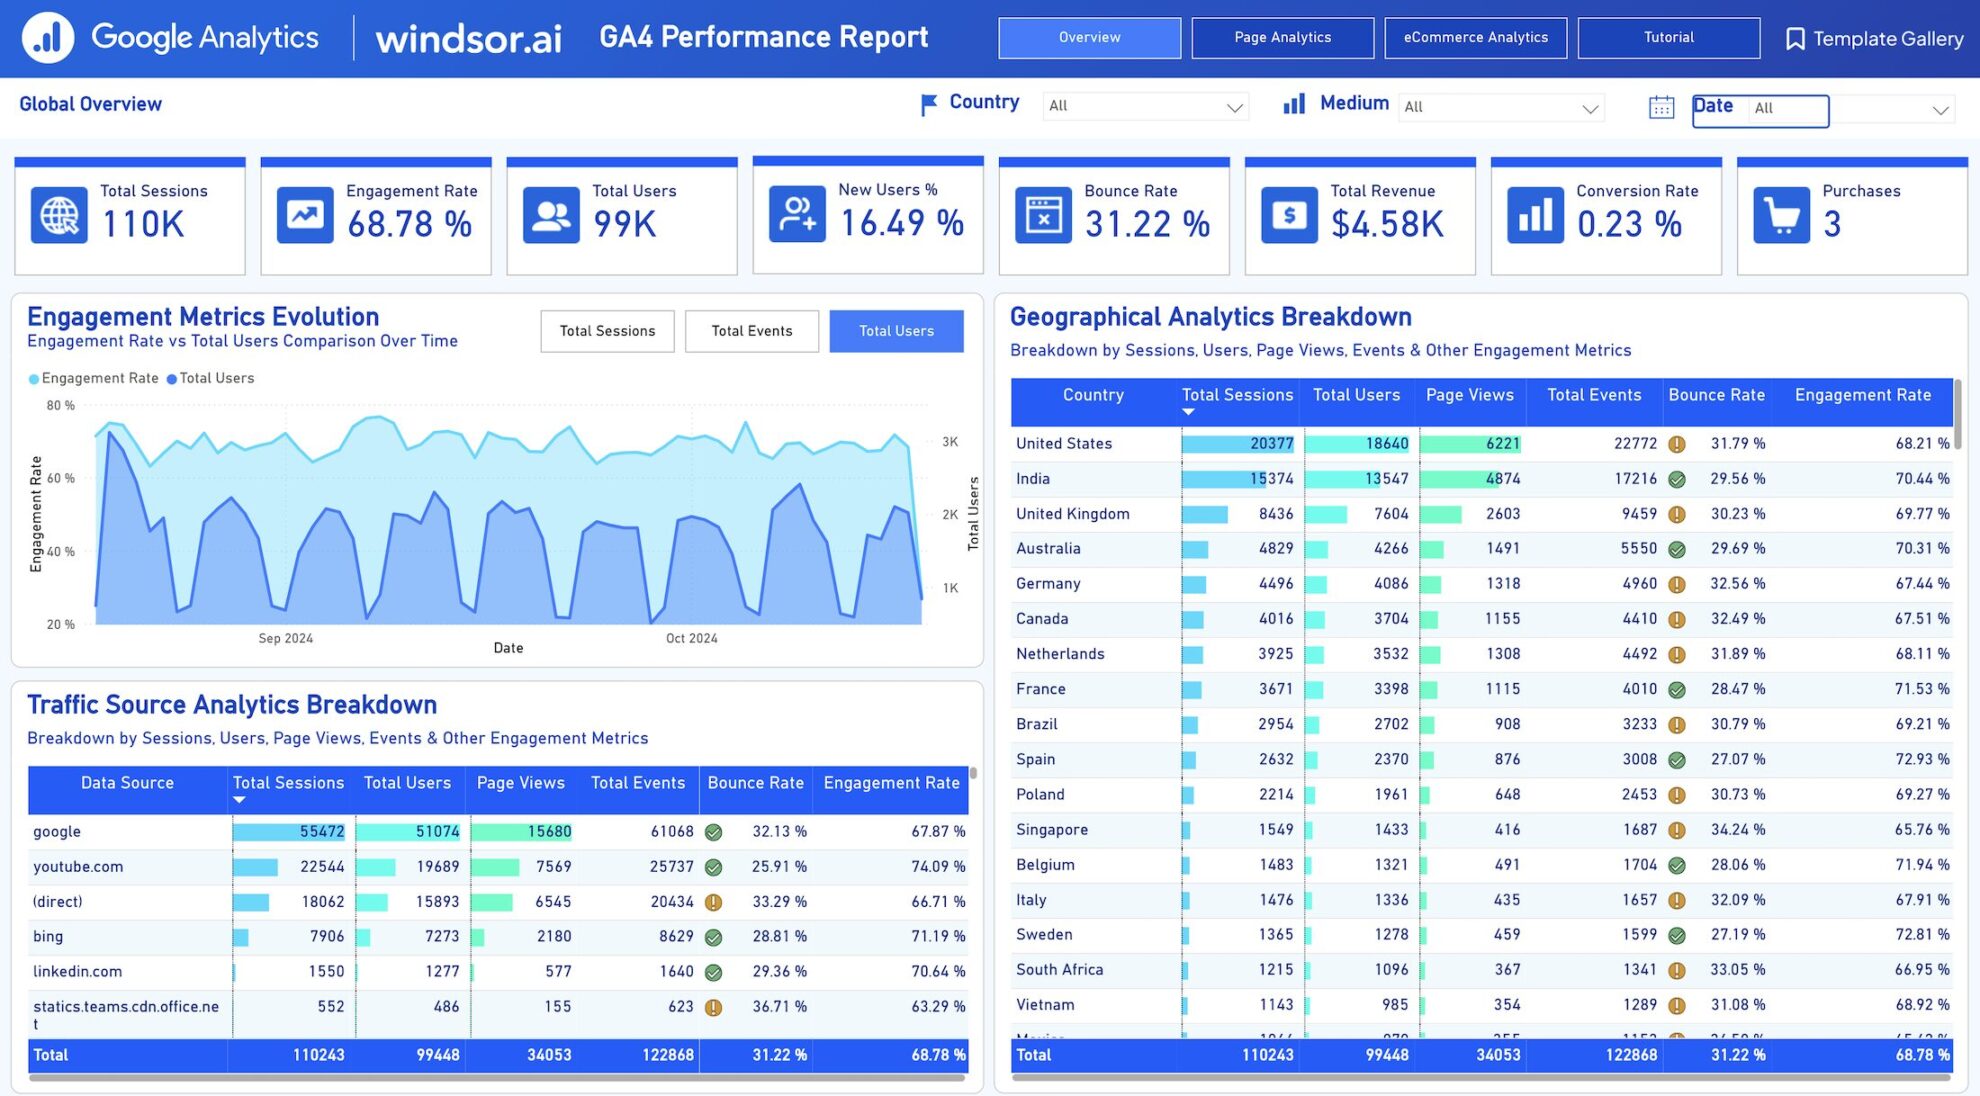
Automate your Google Analytics 4 reports using the free GA4 performance report on Power BI from Windsor.ai. The Windsor.ai connector works without coding.| windsor.ai
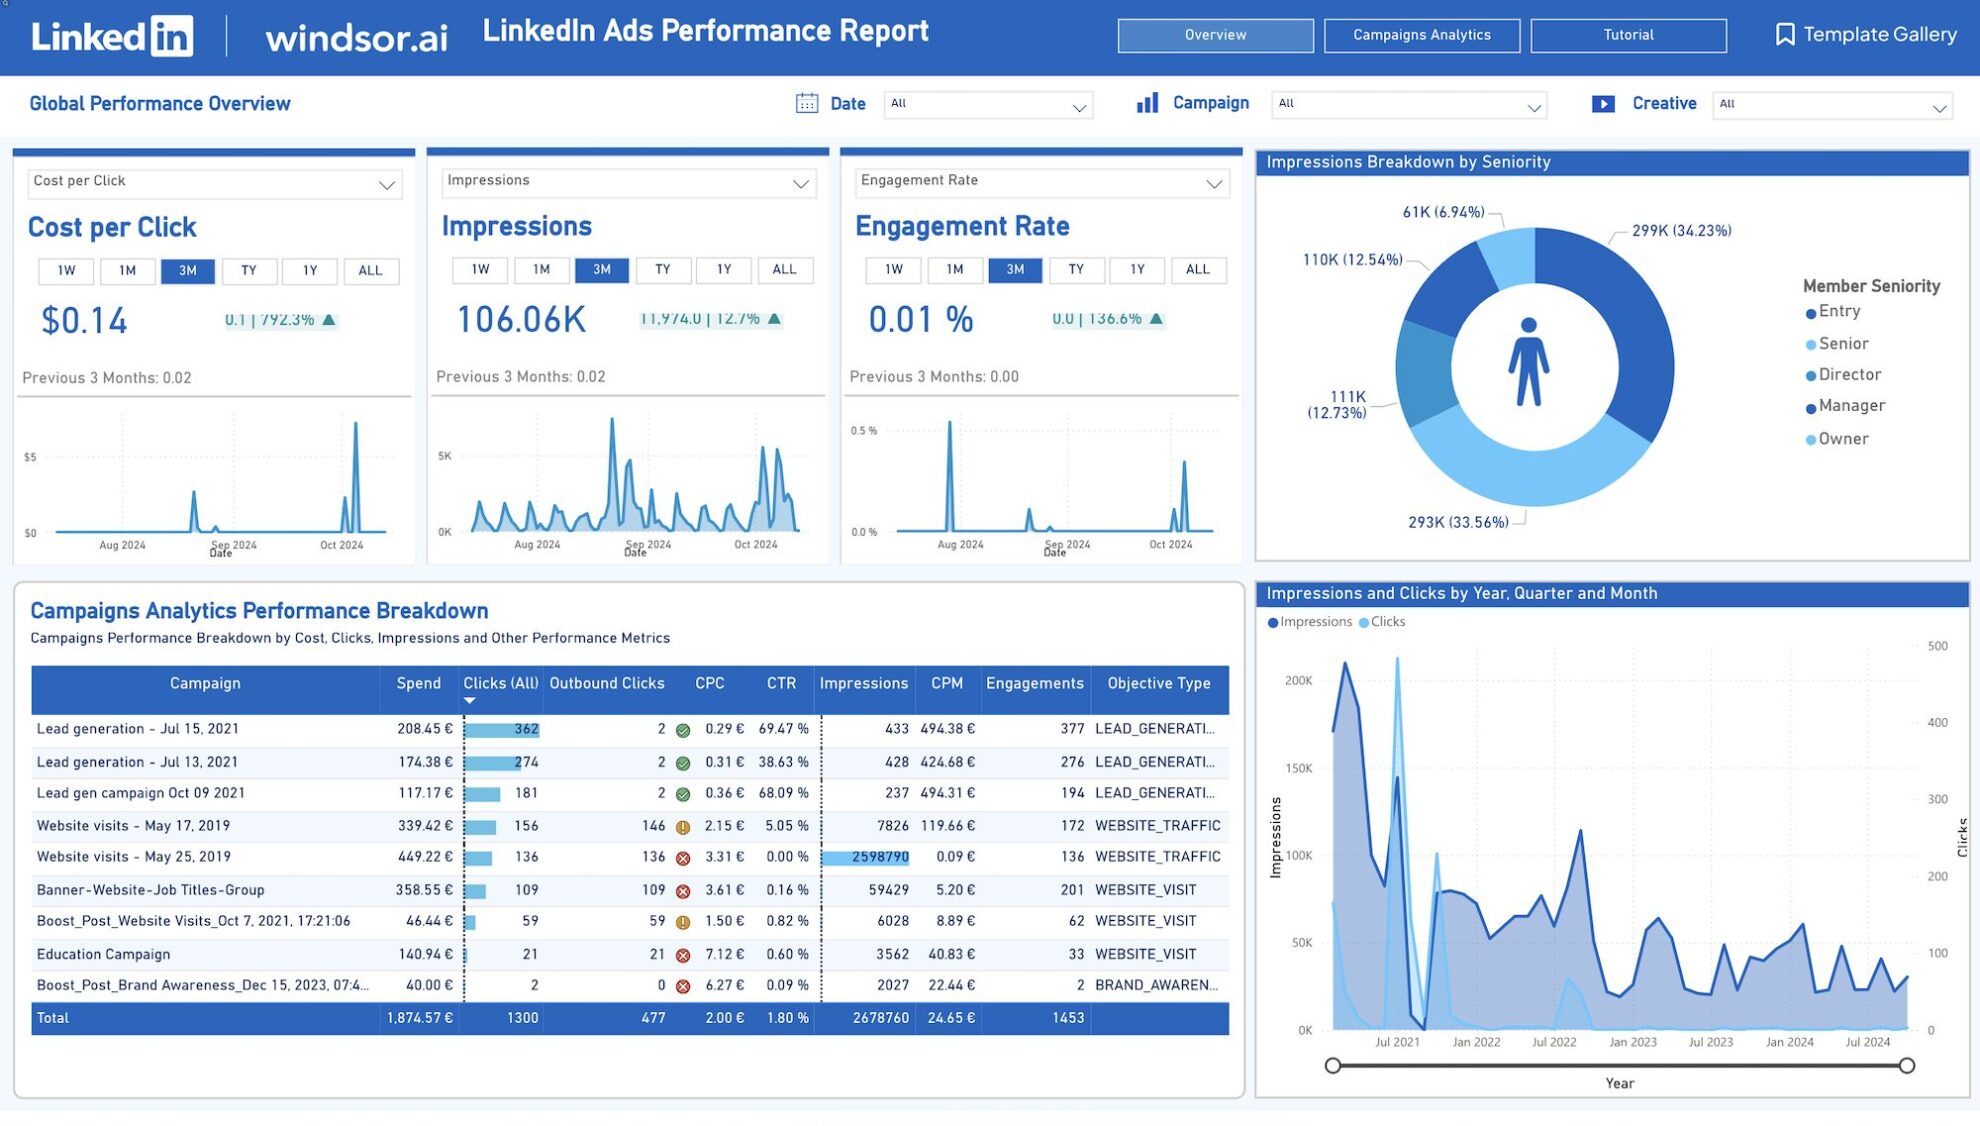
Connect to the LinkedIn Ads template dashboard on Power BI to automate your marketing reports without coding. Windsor.ai provides the dashboard template for free.| windsor.ai
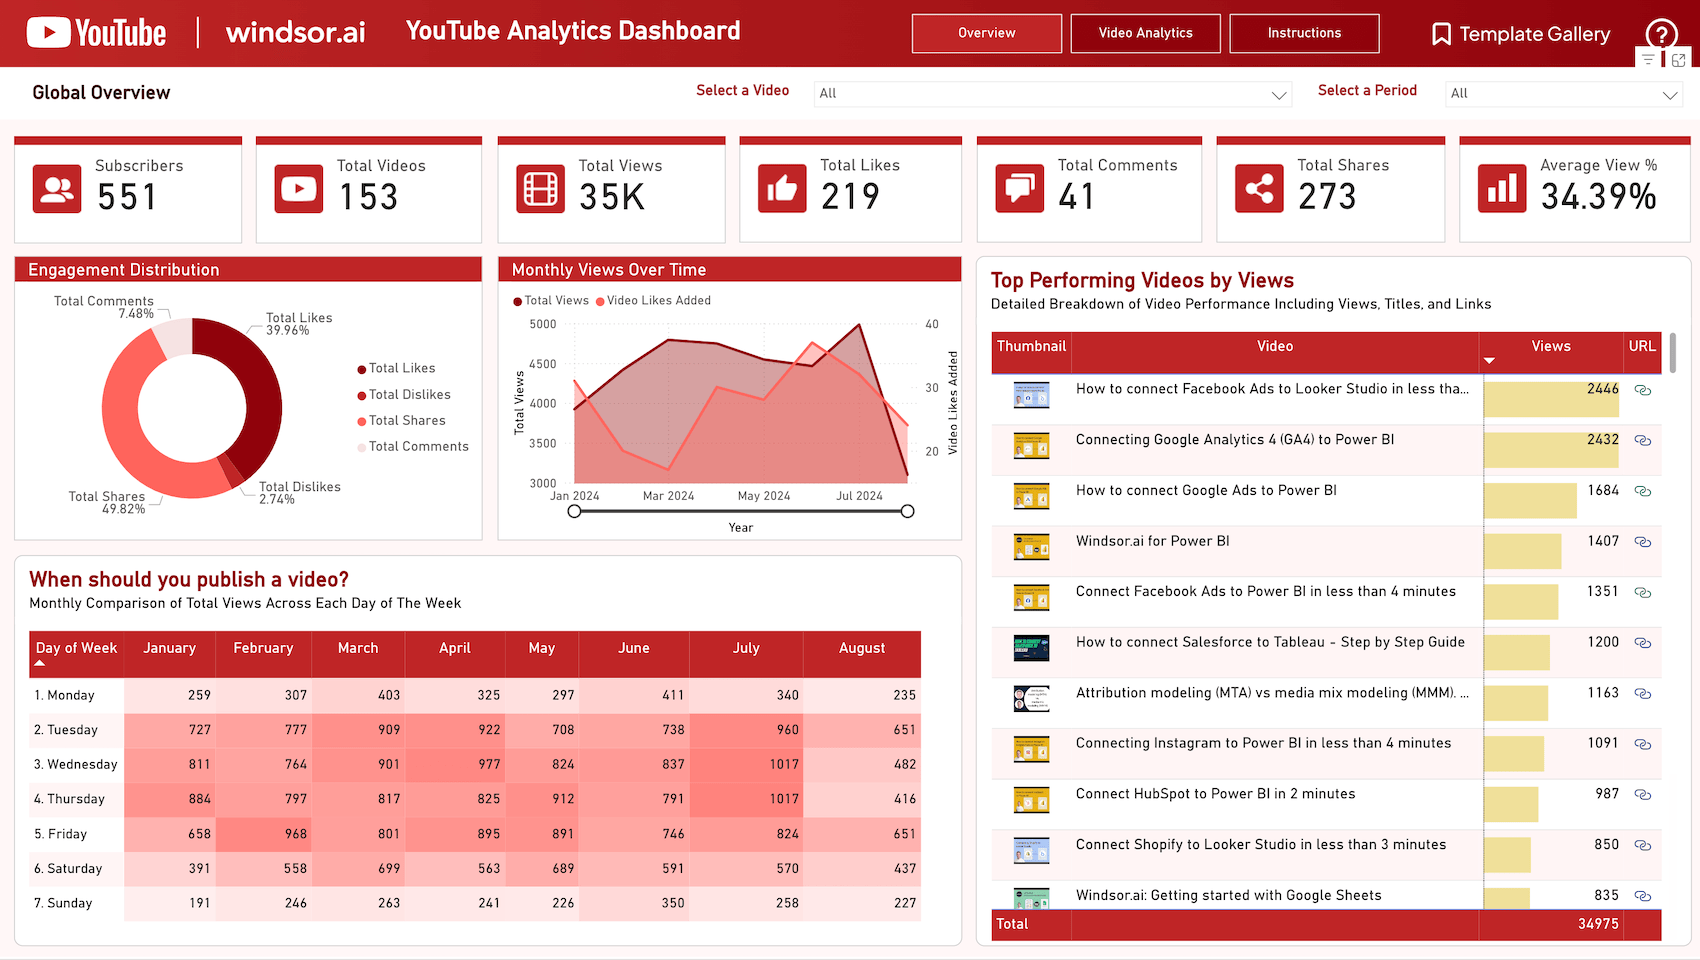
Automatically sync your YouTube data with the Power BI YouTube Analytics Dashboard template from Windsor.ai. Unlock the potential of your data.| windsor.ai

Discover how to write report-scoped DAX expressions using AtScale dimensional models. Unlock the full potential of your data analytics with our step-by-step guide.| AtScale

Last week I was running a post-conference (postcon) workshop at Fabric February in Oslo. To have a successful postcon, workspaces were needed for all attendees of the workshop. In these workspaces …| Data - Marc

I wanted to share the results of a few experiments I recent conducted with one of my favorite sets of sample data. This will take at least two blog posts to cover, but I will summarize them here: C…| Paul Turley's SQL Server BI Blog

Covers four places you can visualize data in Microsoft Fabric. Since knowledge about these ways can help prepare for Microsoft Fabric exams.| Kevin Chant
The October 2024 Power BI update introduces an inconspicuous yet significant preview feature: Value Filter Behavior. This feature is activated by setting a new model-level property, ValueFilterBehavior, to Independent. The default setting of Automatic preserves the existing behavior, at least during the public preview period. This property controls how the DAX SUMMARIZECOLUMNS function behaves, which […]| pbidax
Optimize your data models with AtScale's modern approach. Learn how to maintain a single source of truth while enhancing Power BI's capabilities.| AtScale

Imagine you have a semantic model in the Power BI Service (or Fabric if you will), and you’re about to make a breaking change to this semantic model. How do you inform your end users? How do …| Data - Marc
Power BI lanza actualizaciones constantemente. En esta ocasión se introduce como novedad el gráfico de descomposición en árbol (decomposition tree).| blog.bismart.com
Power BI is defined as the unique collection of different software services, connectors, and apps that assist unrelated data sources to be interactive and| Whizlabs Blog
Reading Time: 2minutes Last year, Microsoft introduced Microsoft Fabric, a unified SaaS platform that combines under one umbrella the best of Microsoft Power BI, various Azure PaaS offerings, and a host of new experiences related to data science, real-time analytics, and more. Fabric... The post Transition from Power BI Premium P SKU to Fabric F SKU: Impact of Enterprise Agreement (EA) Timeline appeared first on DataVeld.| DataVeld
Reading Time: 3minutes Data visualization and design have been essential skills for anyone who wants to communicate insights from data effectively. Creating engaging and informative visuals and reports often requires a lot of time and effort, however; and involves multiple iterations of data... The post Is a Lengthy Iterative Data Visualization Design Process Relevant in the Era of Generative AI? appeared first on DataVeld.| DataVeld
Reading Time: 3minutes Data is generated by every click, swipe, and interaction we have online. It is collected by businesses, governments, and organizations to understand their customers, markets, and operations. It is analyzed both manually and automatically by tools, AI algorithms, and models... The post Boost your Data Culture by Improving Data Literacy appeared first on DataVeld.| DataVeld
Reading Time: 3minutes Data literacy has become a vital skill for individuals at any organization that wants to leverage data for better decision making and innovation. Data is everywhere, and decisions are often based on data-driven insights. Data Literacy’s Impact As the ability... The post Heighten Data Literacy with the Power BI Natural Language Q&A Visual appeared first on DataVeld.| DataVeld
Reading Time: 2minutes One of the key advantages of Power BI is the ability to create powerful custom measures in your data models using the Data Analysis Expressions (DAX) language. DAX allows users to create complex calculations based on their data, but it... The post Learning Power BI? Try GPT-based natural language Quick Measure Suggestions for DAX appeared first on DataVeld.| DataVeld
Reading Time: 2minutes It can be challenging for Mac users to work with Power BI Desktop because it is a Windows-only application for creating datasets and reports. In this tutorial, we’ll walk you through the steps to install Power BI Desktop on your... The post How to Install Power BI Desktop on a Mac (without Parallels) appeared first on DataVeld.| DataVeld
Reading Time: < 1minute Imagine being able to analyze your company’s revenue while you’re washing your hair. Or tracking your metrics while you’re secretly singing your favorite tunes. It’s now possible with new data analytics tool Shower BI. Marketed toward analytics engineers who work... The post Startup Releases Waterproof Data Analysis Tool: Shower BI appeared first on DataVeld.| DataVeld
Reading Time: < 1minute Power BI Paginated Report Bear, a beloved figure among data analysts hungry for Excel exports and emailed PDFs, is not who he claims to be. In fact, he is not a real bear at all. Instead, I believe that he... The post Power BI Paginated Report Bear EXPOSED appeared first on DataVeld.| DataVeld

The February release of Microsoft Power BI Desktop unveiled the public preview of a transformative DAX feature – visual calculations. This new feature promises to revolutionize the way calcul…| pbidax
On 11 January 2019 I had the privilege to speak at the Michigan System Center Users Group meeting on the topic of using Power BI to report your OSD build stats. This is a companion post to that presentation. This is an update to my original post ( here ) on how to gather and present […]| The Systems Monkey
I always enjoy it when we get new DAX functions, especially so for the new set of WINDOW Functions recently added. As part of the April 2023 release of Power BI Desktop, we now have a RANK function and the ability to use a measure to control the order within the existing WINDOW function. The … Continue reading DAX Pareto Calculation The post DAX Pareto Calculation appeared first on Phil Seamark on DAX.| Phil Seamark on DAX
This article aims to show how you can speed up distinct count calculations in Power BI using the built-in user-defined aggregations feature. The user-defined aggregation feature in Power BI is designed to work with direct query models and usually gets used for calculations such as SUM, MIN, MAX etc. However, it can also work well … Continue reading Speed up Distinct Count calculations in Power BI using Aggregations The post Speed up Distinct Count calculations in Power BI using Aggregations...| Phil Seamark on DAX
Background I recently shared on Twitter a 7-module learning path on MS Learn that teaches all you need to know about calculation groups in Power BI. This learning path is an excellent course, and I highly recommend it. However, as part of this exchange, I received a reply from someone lamenting that calculation groups are … Continue reading Using PowerShell to create Calculation Groups in Power BI Desktop The post Using PowerShell to create Calculation Groups in Power BI Desktop appeared fi...| Phil Seamark on DAX
Introduction How to choose the correct storage mode for Power BI Tables. This article aims to help explain the different storage modes available when designing an aggregation strategy for a Power BI Report. What each storage mode is and when you would use it. Picking the correct storage mode for each table in your model … Continue reading Power BI Storage Modes for Aggregations The post Power BI Storage Modes for Aggregations appeared first on Phil Seamark on DAX.| Phil Seamark on DAX
Part two in this series on Power BI Aggregation tables focuses on Power BI data models with more than one aggregation table. The first article introduced Power BI Aggregations and included a walk through configuring a Power BI model with a single aggregation table. Intro to Power BI Aggregations Multiple aggregations tables DUAL storage mode … Continue reading Power BI Multiple Aggregations tables The post Power BI Multiple Aggregations tables appeared first on Phil Seamark on DAX.| Phil Seamark on DAX

This is the second article in a series on the introduction to the EvaluateAndLog function. As I explained last time, EvaluateAndLog can be used to print to the debug output the intermediate result …| pbidax
