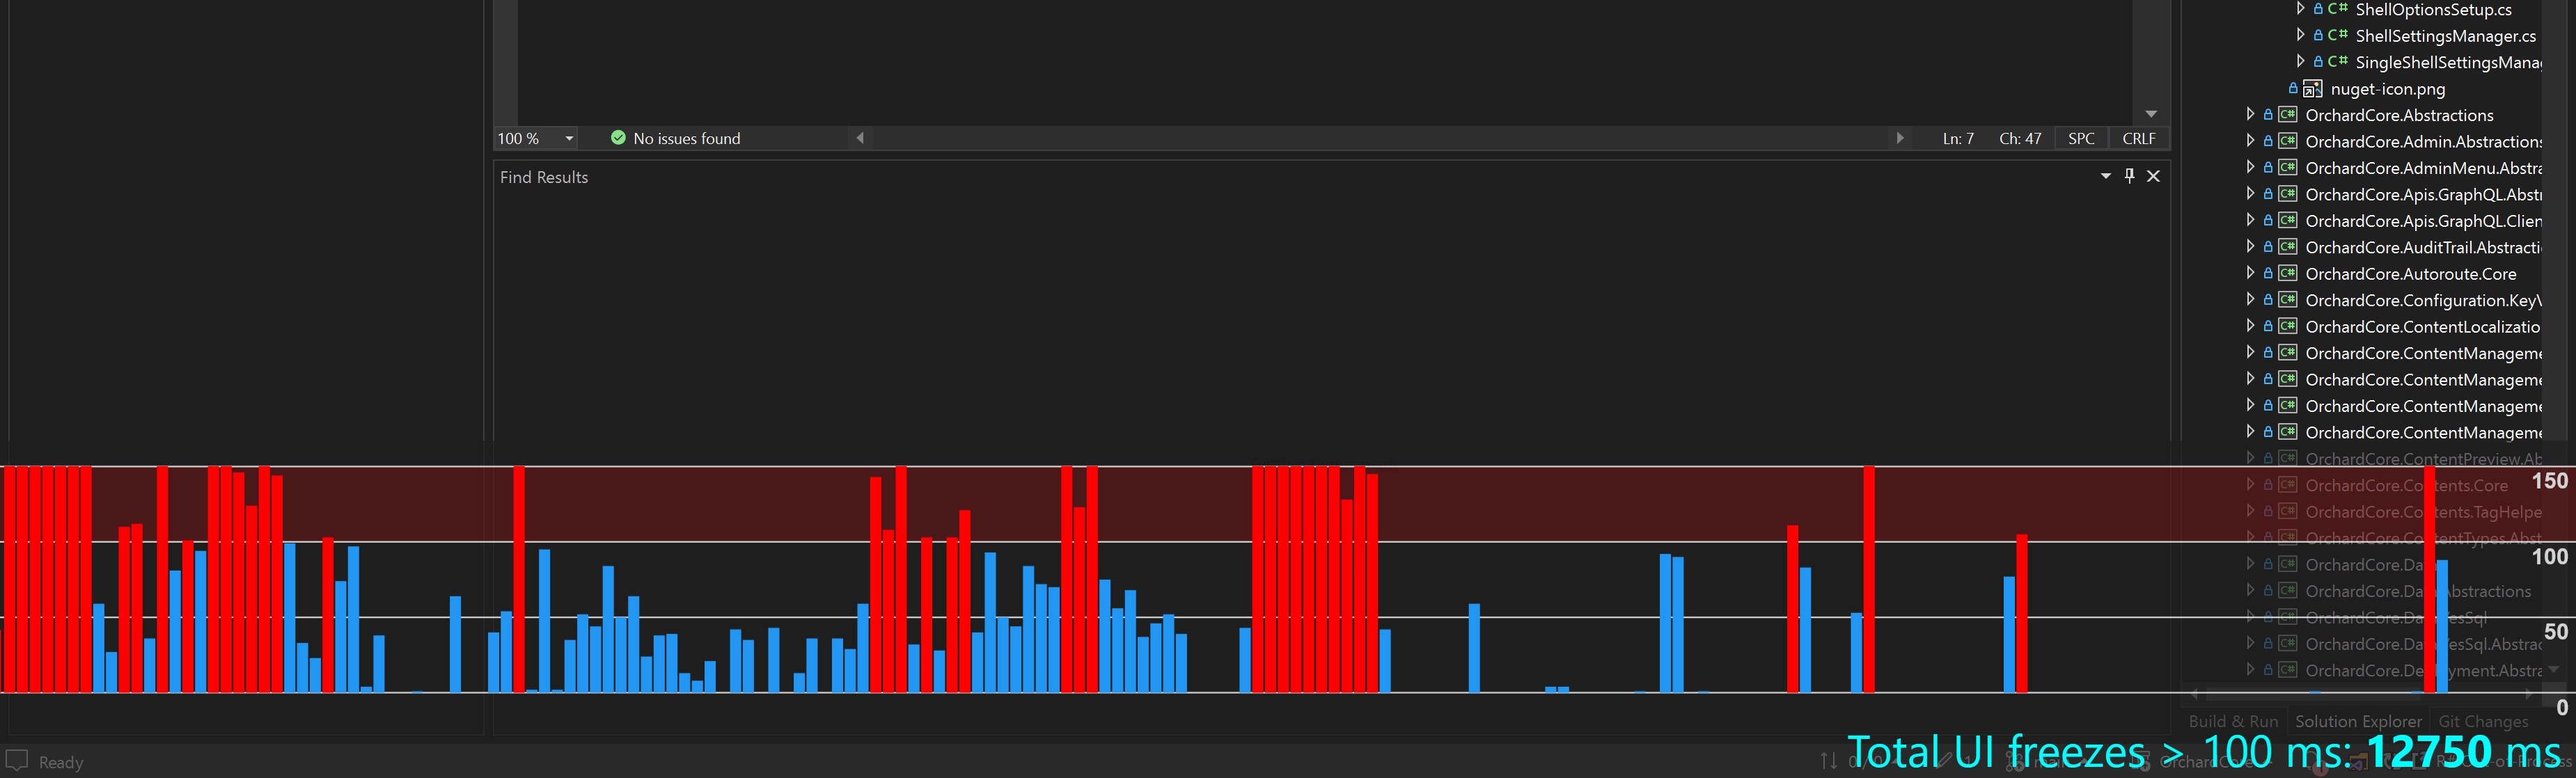
Measuring UI responsiveness in Resharper
A walkthrough of how I built a custom profiler to measure UI responsiveness, using .NET and Silhouette.| minidump.net
A walkthrough of how I built a custom profiler to measure UI responsiveness, using .NET and Silhouette.| minidump.net
In a previous post (Automating memory profiling with the JetBrains dotMemory Profiler API), I described the steps that could be used to automate the collection of memory snapshots and profiling data by using the JetBrains Profiler API NuGet package. In that post, we triggered the profiling session using the dotMemory application on Windows. As part […] The post Profiling Memory Allocations on Linux using the JetBrains dotMemory Command-Line Profiler appeared first on Steve Gordon - Code wit...| Steve Gordon – Code with Steve

How to attach remote profiler to JVM in AWS EC2 instance| oooops.dev
As part of our ongoing efforts to improve Mono’s profiling infrastructure, in| www.mono-project.com
