
How to automate Google Ads reporting in Looker Studio
Master Google Ads to Looker Studio integration with 3 methods: Windsor.ai no-code, Google native, and Ads Scripts for developer-level control.| windsor.ai
Master Google Ads to Looker Studio integration with 3 methods: Windsor.ai no-code, Google native, and Ads Scripts for developer-level control.| windsor.ai

Learn how to automatically sync Facebook Ads with Looker Studio using Windsor.ai connector, or explore manual and developer setup options.| windsor.ai
Nowadays, almost every business worldwide strives to collect as much information as possible. From customer feedback to proposals and more, more than 96% of businesses rely on data to make informed decisions, says the S&P Global Market Intelligence Study. However, it’s important to note that raw data alone won’t drive any success. You need to… Read More »Strategies to Turn Raw Data into Insightful Reports The post Strategies to Turn Raw Data into Insightful Reports appeared first on...| windsor.ai
Marketing reports are essential to understand and justify your efforts, through data visualizations, facts, and more. They must be written clearly so that your organization can easily make decisions and maximize returns. However, creating impactful marketing reports is often easier said than done. It requires utmost perfection in data cleansing, visualization, and discussing; a diverse… Read More »The Ultimate Guide to Creating an Impactful Marketing Report The post The Ultimate Guide to ...| windsor.ai
Data blending is a significant reason analysts choose Looker Studio, But what is data blending? The feature enables analysts to combine data from multiple sources when creating Looker Studio reports. While Looker Studio simplifies the creation of data blends, it has some limitations, which we will discuss herein. We will also show you how to… Read More »Data Blending in Looker Studio: How to Blend Data, Benefits, and Overcoming Limitations The post Data Blending in Looker Studio: How to B...| windsor.ai
Creating an availability calendar plot using ggplot2 in R.| rmf
Viktor Orbán’s party may lose the popular vote by over 5 points and still win a parliamentary majority, as local districts are gerrymandered heavily in the ruling party’s favor. Source| English

Hi all, I have a new found love of golf. Don’t get me wrong, I am just a Rory fan from the masters, but also love to watch Brysons youtube channel. Realistically, I dont know what I’m d…| CJ Mayes

Hi all, Something creatively bespoke to share today, coined a radial waterfall chart. I love when i see people build pretty adventerous chart types and are willing to shift away from the bars and l…| CJ Mayes
Hi all, A warm welcome back to another blog, and this week, Seun has kindly offered up his time to […]| CJ Mayes

Hi all, I’ve always enjoyed the ‘design’ aspect to visualisation tools. Anything related to user experience. The tableau community have been at the forefront of creating new ways …| CJ Mayes
The ”Napoleon Map“ by the French engineer Charles-Joseph Minard is one of the most cited works of data visualization. Unfortunately, it is still highly relevant|

This was a thrilling discovery tour: “Napoleon’s Russian Campaign” (1869) is one of the most famous infographics ever. The man who created it was Charles-Joseph Minard (1781-1870), a little known F…| sandrarendgen.wordpress.com
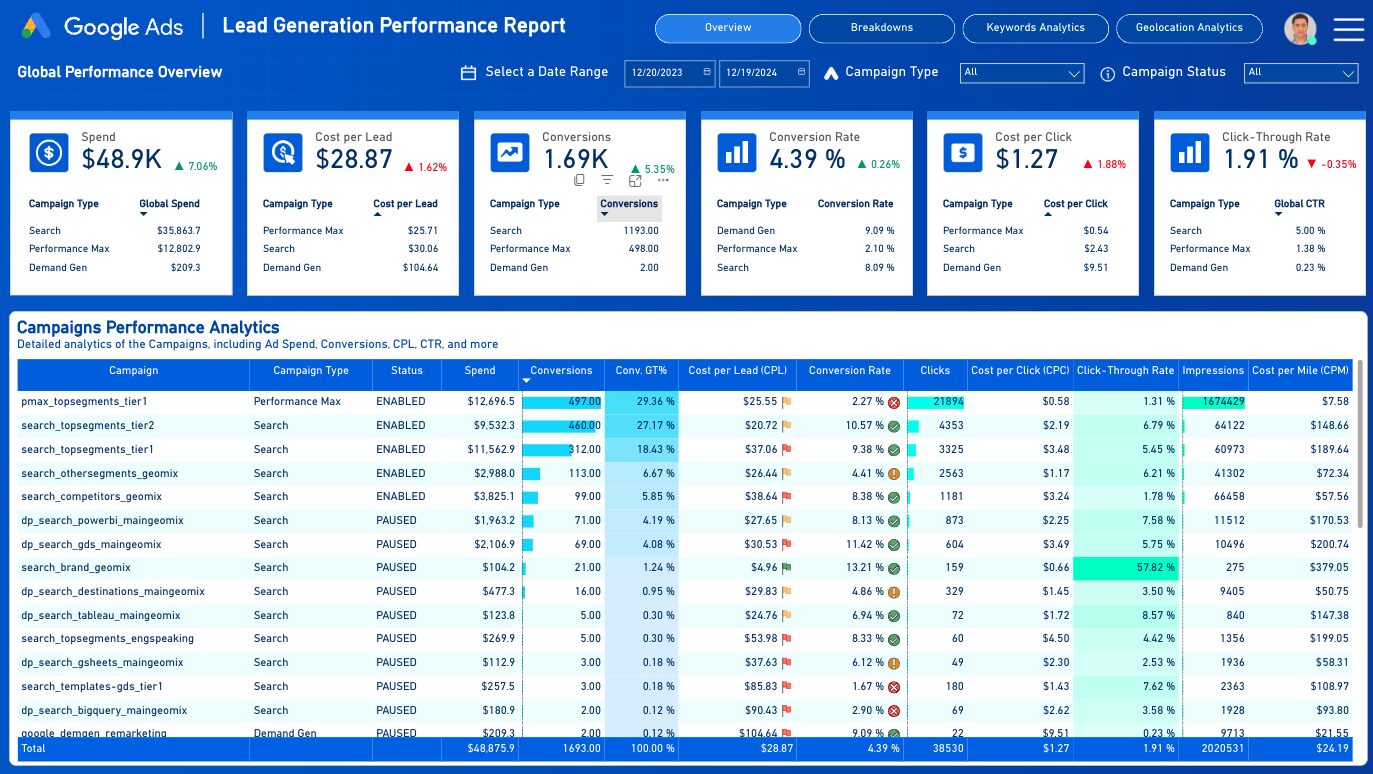
Connect to the Google Ads template dashboard on Power BI to automate your marketing reports without coding. Windsor.ai provides the dashboard template for free.| windsor.ai
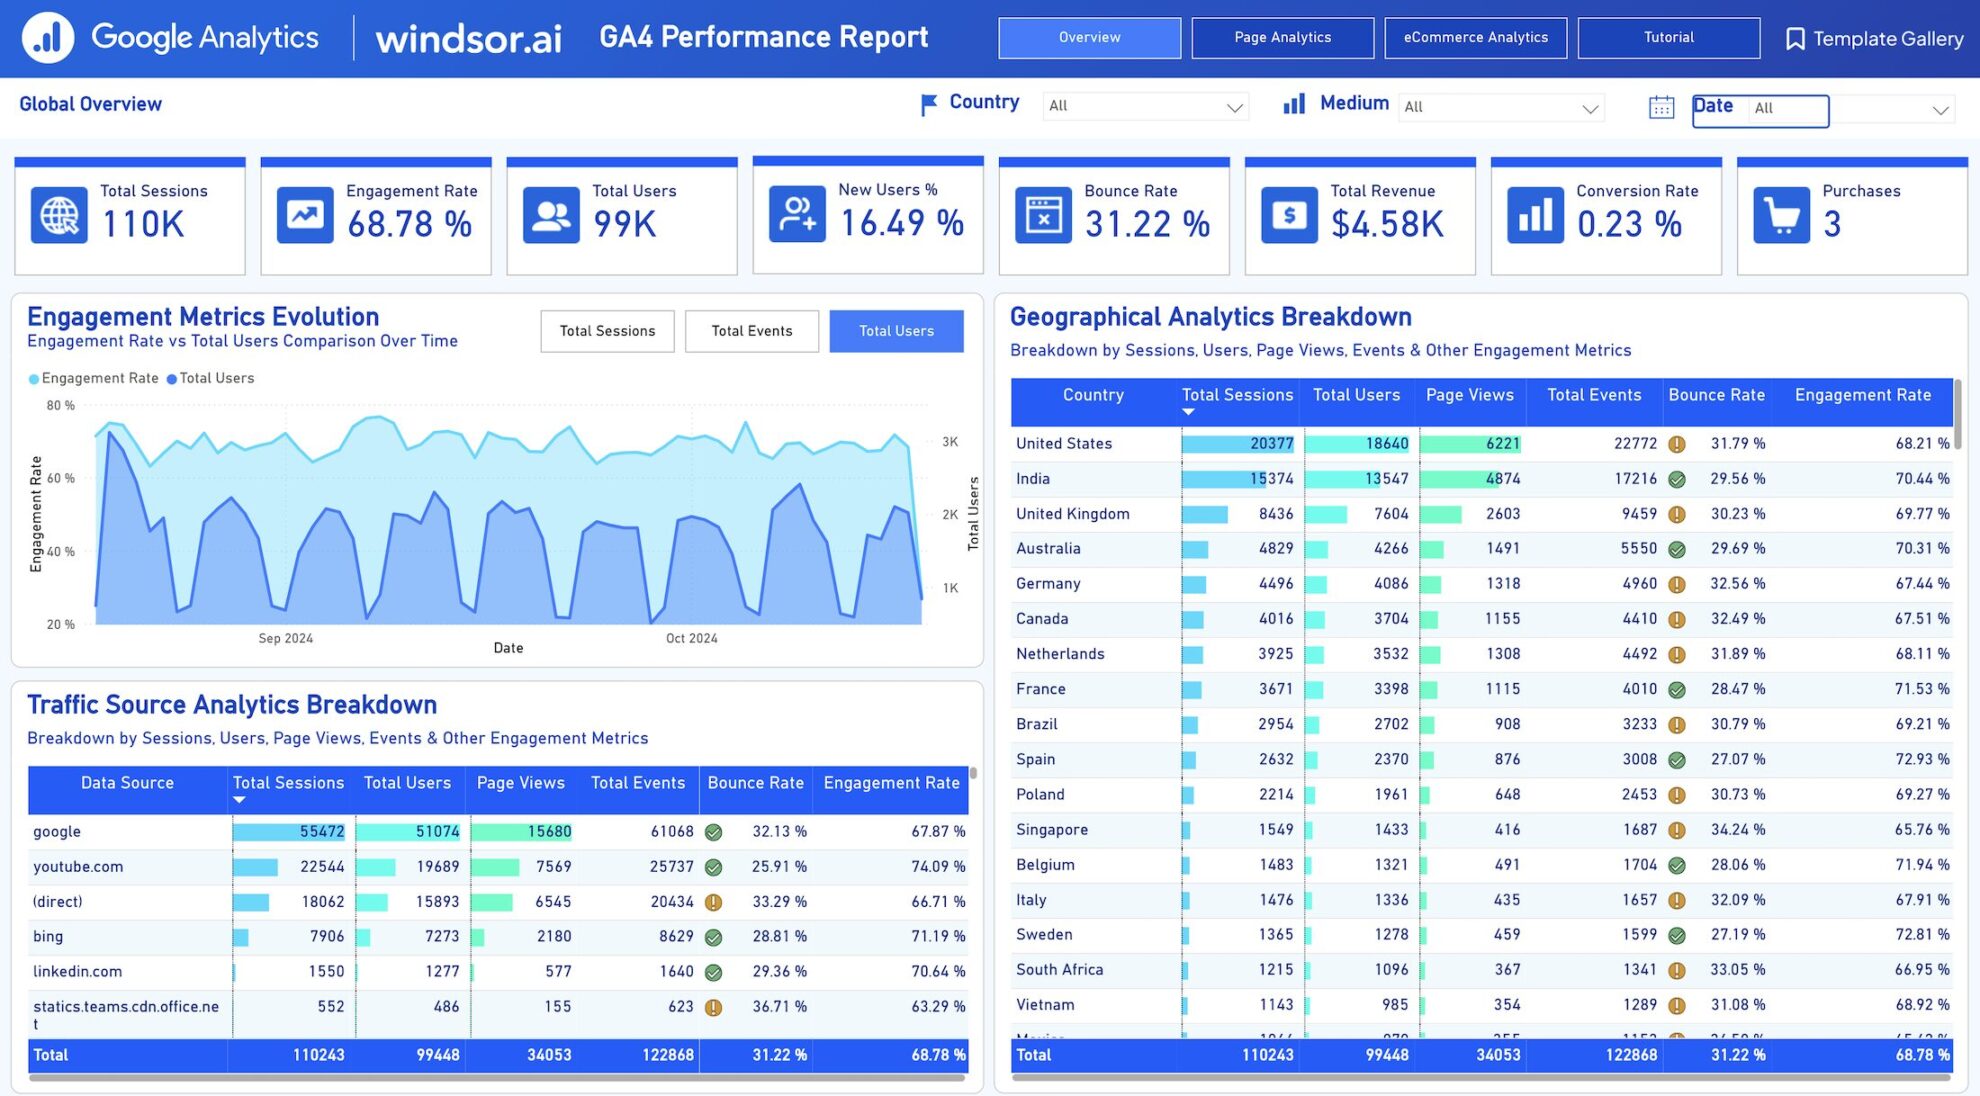
Automate your Google Analytics 4 reports using the free GA4 performance report on Power BI from Windsor.ai. The Windsor.ai connector works without coding.| windsor.ai
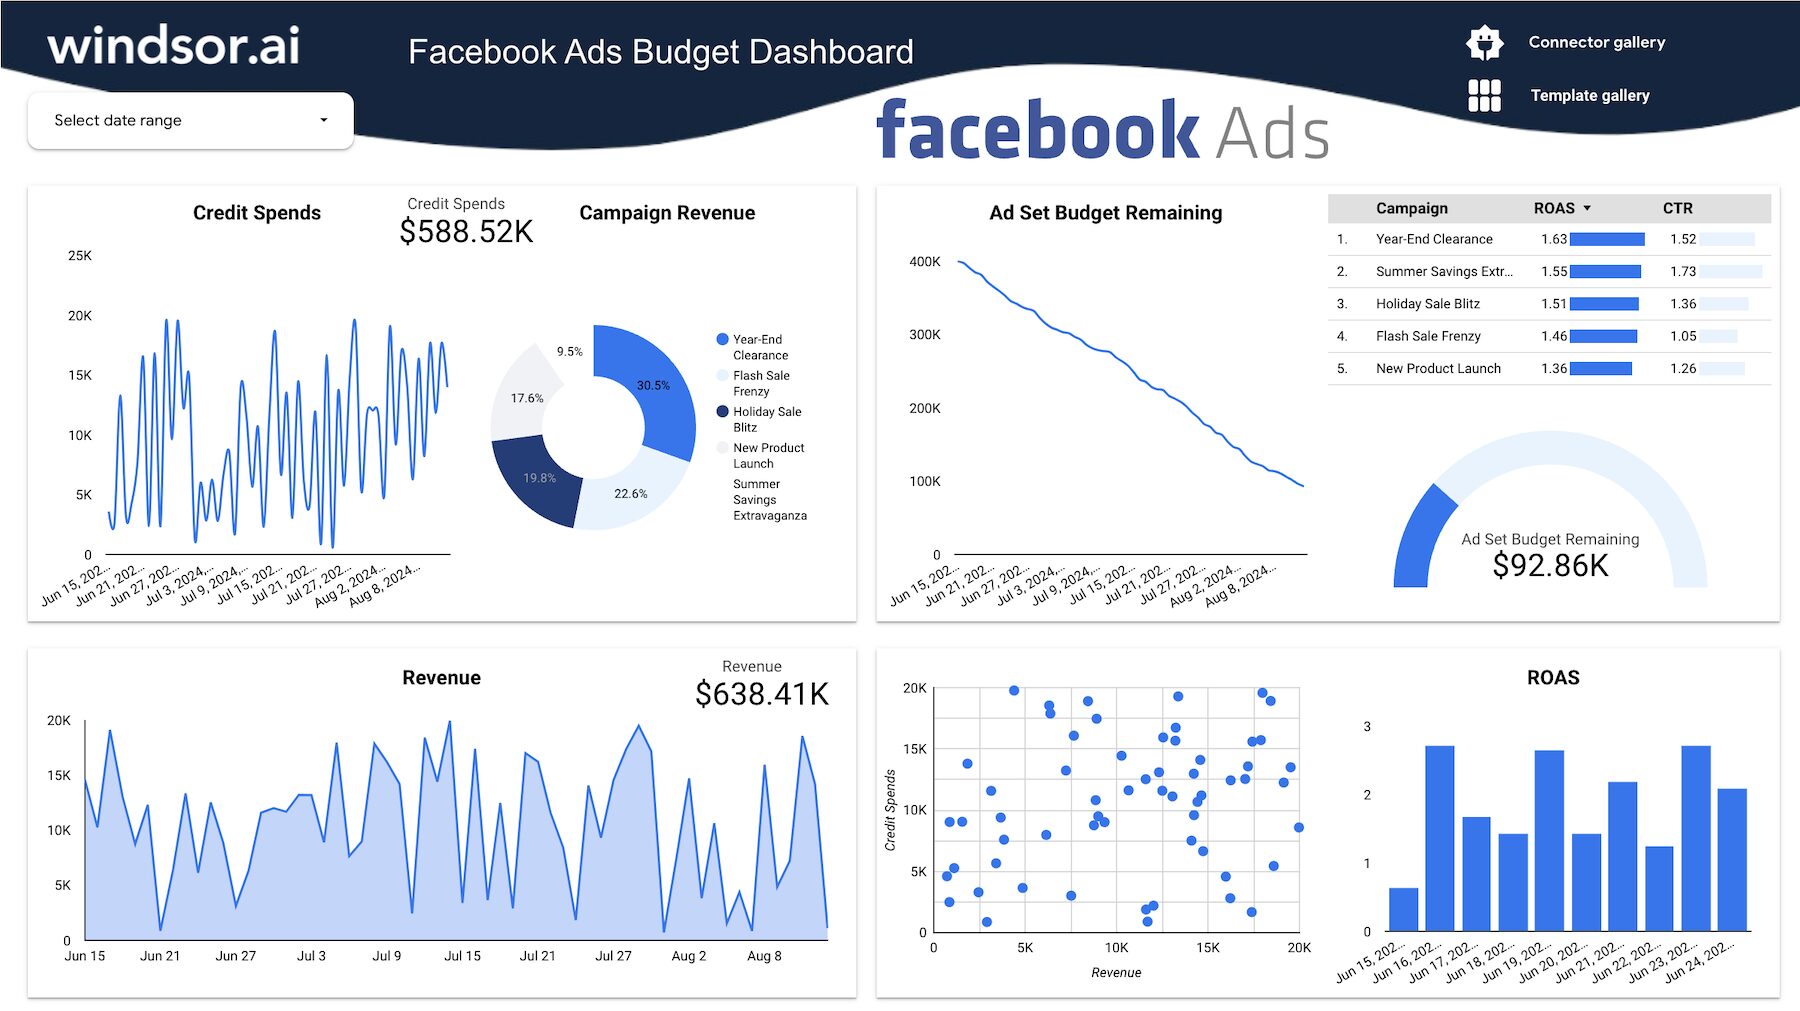
Automate your ads budget analytics using the actual Facebook Ads budget dashboard template for Looker Studio that Windsor.ai uses to optimize its marketing spending.| windsor.ai
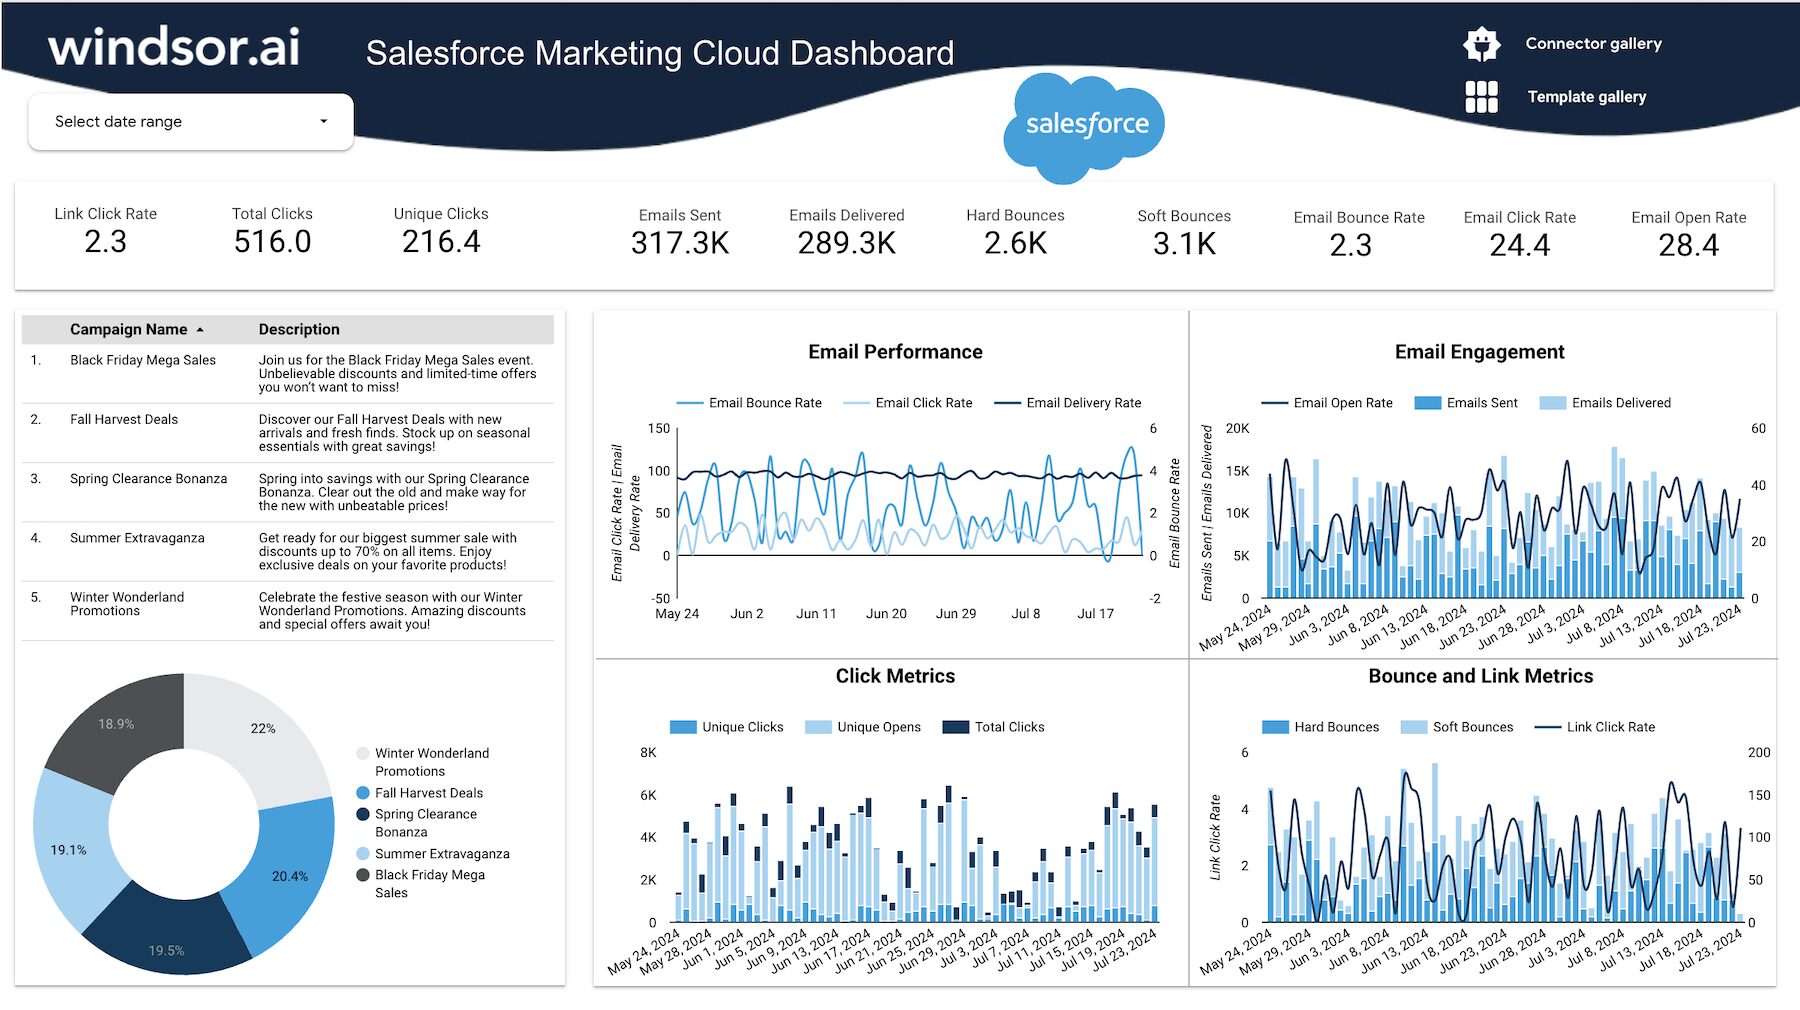
Automate Salesforce Marketing Cloud analytics by connecting your Salesforce account to the free Looker Studio dashboard reporting template created by Windsor.ai.| windsor.ai

Hi all, A fun data art style blog this week. This idea was heavily inspired from The Flerlage Twins btw. You can check out their blog here. It was written 5 years ago now and still works perfectly …| CJ Mayes
Hi all, I don’t say this lightly…. this might be one of my favourite technical guest blogs I’ve ever had the chance to host on the site. I got to connect with Matt on a whim through sending him a message on Tableau Public, after Zach Bowders has tweeted about his work. Fast forward, Matt […]| CJ Mayes
Annotating scatterplots in R. Drawing polygons around point clusters using base functions and R packages ggplot, ggalt and ggforce.| rmf
A step-by-step guide to data preparation and plotting of simple, neat and elegant heatmaps in R using base graphics and ggplot2.| rmf
Circos plots are popular for displaying huge amounts of data in a relatively small visual space. This is especially relevant for genomic data. This post explores creating Circos-style genomic data plots in R using R package circlize.| rmf
Create an interactive calendar plot in R using Shiny.| rmf
