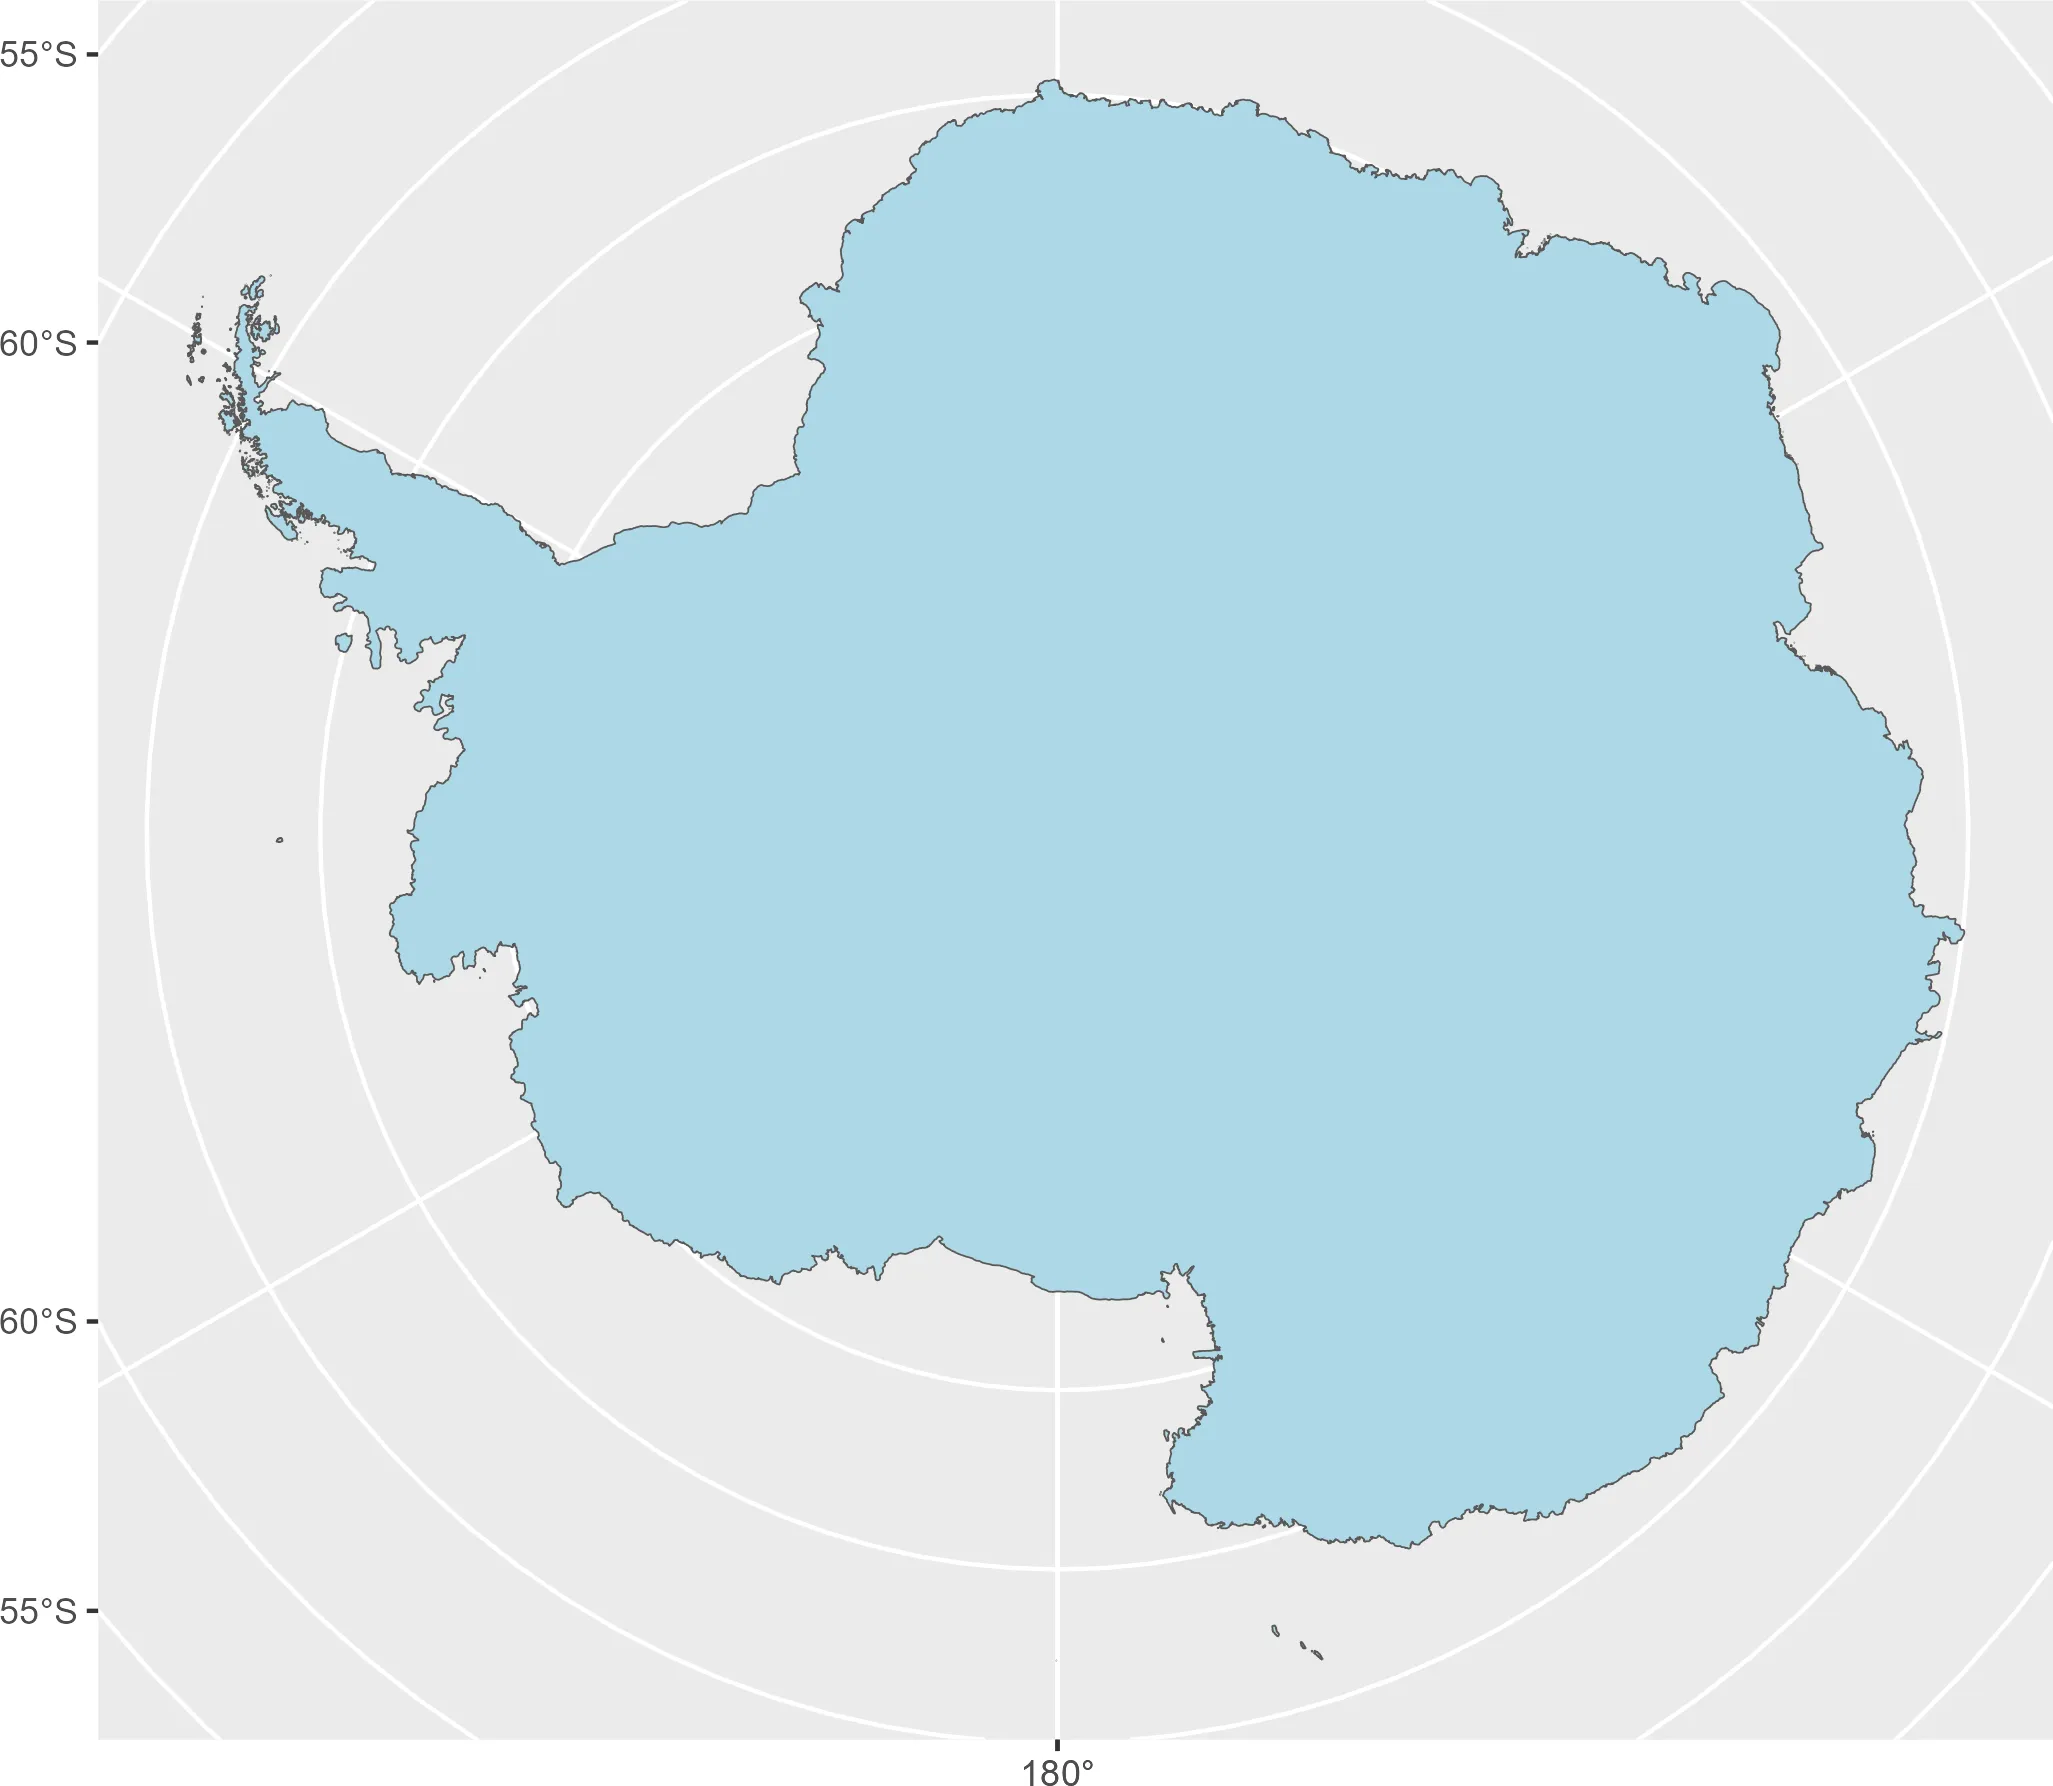
Mapping Antarctica | One world
Cool maps from the South Pole - Creating maps with R is usually straightforward, but representations thatcross the International DateLine...| One world | Projects, maps and coding
Cool maps from the South Pole - Creating maps with R is usually straightforward, but representations thatcross the International DateLine...| One world | Projects, maps and coding
So, you build a great predictive model. Now what? MLOps is hard. Deploying a model involves different tools, skills, and risks than model development. This dooms some data science projects to die on their creator’s hard drive. Tools like dbt and SQLMesh entered the scene to solve a similar problem for data analysts. These tools offer an opinionatee frameowrk for organizing multiple related SQL scripts into fully tested, orchestrated, and version conotrolled projects. Data analysts can deliv...| Emily Riederer
I just wrapped up my first useR conference since Brussels in 2017, and it was just the best. The #rstats community is one of a kind and it was delightful seeing old friends and hearing about all of the amazing things folks are building. Yesterday morning Davis Vaughan & I whipped up a last minute shiny app to help us facilitate Q&As after sessions we were chairing and I ended up ditching my original talk today and writing one about that instead 🙃 🧰 tools used: Claude, Positron, RStudio,...|
Data science stakeholder communication is hard. The typical explanation of this is to parody data scientists as “too technical” to communicate with their audiences. But I’ve always found it unsatisfying to believe that “being technical” makes it too challenging to connect with the 0.1% of the population so similar to ourselves that we all happen to work in the same organization. Instead, I believe communication is rarely taught intentionally and, worse, is modeled poorly by educatio...| Emily Riederer
This analysis was made possible by the mdr R package, which used data originally compiled by Sam_Badi on Reddit. The data consists of all elevator dings in the Severance episodes along with the episode number, time stamp, pitch of the ding, and the action associated. Examining the plot below, we see across all dings the G is associated with both innie and outies going to sleep, the C# is consistently associated with both innies and outies waking up. (Spoiler: There is one notable exception, a...|
This analysis was made possible by the mdr R package, which used data originally compiled by the Severance wiki. Here, we create a little sentiment profile for each episode, binning them in three minute increments and calculating the AFINN average sentiment score in each. library(tidytext)library(mdr)library(tidyverse)df <- transcripts |>mutate(timestamp_seconds =as.numeric(timestamp), bin =floor(timestamp_seconds /180) *180) |>left_join(episodes, by =c("season", "episode"))df |>mutate(id = g...|
In this analysis, I use my mdr R package, which used data originally compiled by the Severance wiki. For each episode we count the number of words each of the four main characters (Mark, Helly, Dylan, and Irving) speak for in each minute and visualize them below. Click on the tabs to switch episodes. library(tidyverse)library(tidytext)library(ggiraph)library(mdr)make_plot <-function(input) {data <- transcripts |>mutate(speaker =case_when(grepl("Cobel", speaker) ~"Cobel", speaker =="Mark W"~"M...|
I thought it’d be fun to celebrate spooky season with a little stats punny plot. We’re going to turn a normal distribution into a paranormal distribution! HA! Ok first let’s get some packages. library(tidyverse)library(tweenr)library(gganimate) Now let’s generate our Normal data: We’re doing this twice in the data frame because we need to have the same number of data points as the paranormal data, which has a little wiggly bottom. n <-100x_top <-seq(-1.5, 1.5, length.out = n)y_top <...|

Do you know the Bonne projection? - Do you know the Bonne Projection? This is a very special one, as...| One world | Projects, maps and coding
Photo credit to the inimitable Allison Horst About a year ago, I wrote the original version of Python Rgonomics to help fellow former R users who were entering into the world of python. The general point of the article was that new python tooling (e.g. polars versus pandas) has evolved to a point where there are tools that remain truly performant and pythonic while still having a more similar user experience for those coming from the R world. I also discussed this at posit::conf(2025). Ironi...| Emily Riederer
This book is designed to provide a range of examples of how to extend the functionality of your R Markdown documents. As a cookbook, this guide is recommended to new or intermediate R Markdown users who desire to enhance the efficiency of using R Markdown and also explore the power of R Markdown. Read online at https://bookdown.org/yihui/rmarkdown-cookbook/| www.emilyriederer.com
Quick Links Abstract Slides Video Slides Video Post - Python Rgonomics Post - Advanced polars versus dplyr Warning Tooling changes quickly. Since this talk occured, Astral’s uv project has come out as a very strong contender to replace pyenv, pdm, and more of the devtools part of a python stack. Data science languages are increasingly interoperable with advances like Arrow, Quarto, and Posit Connect. But data scientists are not. Learning the basic syntax of a new language is easy, but relea...| Emily Riederer
In a previous blog post, I looked at how to connect desktop-based Visual Studio Code to a Google Cloud Virtual machine; today, it’s how to do the same using a virtual machine running on Microsoft’s Azure platform. Setting Up There are two pieces to this puzzle: Visual Studio Code and the Azure Cloud Platform. First, grab Visual Studio Code for your local computer (ie your non-cloud computer) and whatever extensions you fancy, but you’ll need the remote explorer (SSH) at a minimum. You...| Arthur Turrell
I was recently asked to give a talk at No. 10 Downing Street on the topic of data science with impact and, in this post, I’m going to share some of what I said in that talk. The context for being asked is that the folks in 10DS, the Downing Street data team, are perhaps the most obsessed with having impact of any data science team I’ve met–so even though they’re the real experts on this topic, they’re very sensibly reaching out to others to see if there is anything extra they can l...| Arthur Turrell
debkeepr is now—finally—on CRAN with version 0.1.1! debkeepr integrates non-decimal currencies that use tripartite or tetrapartite systems into the methodologies of Digital Humanities and the practices of reproducible research. The package makes it possible for historical non-decimal currencies, such as the tripartite system of pounds, shillings, and pence (£465 12s. 8d.), to behave like decimalized values through the implementation of the deb_lsd, deb_tetra, and deb_decimal vector types...| A Rogue Historian
Last night, the 17th of November, 2022, I, like so many others, was rather gleefully, but also sadly, doom scrolling through Twitter as Elon Musk seemed to be rocketing the social network into the ground at amazing speed. It seemed a good time to heed the warning that so many had put out about downloading your twitter data: your tweets, those you follow, your followers, and maybe the Twitter lists that you have created or followed. I knew that much of this could be done with the rtweet packag...| A Rogue Historian
Note: The API for debkeepr described in this post has been deprecated. For the new API, see the debkeepr website and the blog post announcing debkeepr’s release on CRAN. You can now install the released version of debkeepr from CRAN or the development version on GitHub: # Install CRAN releaseinstall.packages("debkeepr")# Install development version# install.packages("pak")pak::pak("jessesadler/debkeepr") --- After an extensive period of iteration and a long but rewarding process of learning...| A Rogue Historian
In 1569 the Flemish cartographer and mathematician Gerardus Mercator published a new world map under the title “New and more complete representation of the terrestrial globe properly adapted for use in navigation.” The title of the map points to Mercator’s main claim for its usefulness, which he expounded upon in the map’s legends. Mercator presented his map as not only an accurate representation of the known world, but also as a particularly useful map for the purposes of navigation....| A Rogue Historian
The previous post provided an introduction to the sp and sf packages and how they represent spatial data in R. There I discussed the creation of Spatial and sf objects from data with longitude and latitude values and the process of making maps with the two packages. In this post I will provide further background for the sf package by going into the details of the structure of sf objects and explaining how the package implements the Simple Features open standard. It is certainly not necessary ...| A Rogue Historian
The geographic visualization of data makes up one of the major branches of the Digital Humanities toolkit. There are a plethora of tools that can visualize geographic information from full-scale GIS applications such as ArcGIS and QGIS to web-based tools like Google maps to any number of programing languages. There are advantages and disadvantages to these different types of tools. Using a command-line interface has a steep learning curve, but it has the benefit of enabling approaches to anal...| A Rogue Historian
Over a wide range of fields network analysis has become an increasingly popular tool for scholars to deal with the complexity of the interrelationships between actors of all sorts. The promise of network analysis is the placement of significance on the relationships between actors, rather than seeing actors as isolated entities. The emphasis on complexity, along with the creation of a variety of algorithms to measure various aspects of networks, makes network analysis a central tool for digit...| A Rogue Historian
In the previous post I discussed some reasons to use R instead of Excel to analyze and visualize data and provided a brief introduction to the R programming language. That post used an example of letters sent to the sixteenth-century merchant Daniel van der Meulen in 1585. One aspect missing from the analysis was a geographical visualization of the data. This post will provide an introduction to geocoding and mapping location data using the ggmap package for R, which enables the creation of m...| A Rogue Historian
Quantitative research often begins with the humble process of counting. Historical documents are never as plentiful as a historian would wish, but counting words, material objects, court cases, etc. can lead to a better understanding of the sources and the subject under study. When beginning the process of counting, the first instinct is to open a spreadsheet. The end result might be the production of tables and charts created in the very same spreadsheet document. In this post, I want to sho...| A Rogue Historian
Necesito para estar sentado, un arbolito en este descampado (Desarraigo, Extremoduro) From time to time I come back to experiment with this stunning photograph of Boris Karloff as Frankenstein's monster. I have done several of them previously: from decomposing it into Voronoi regions, to draw it as a single line portrait using an algorithm to| Fronkonstin
He himself could hear the harmony of the Universe, and understood the music of the spheres, and the stars which move in concert with them, and which we cannot hear because of the limitations of our weak nature (Porphyry, Life of Pythagoras) I love legends. The life of Pythagoras is riddled with them: from the … Continue reading The Music of the Spheres→ The post The Music of the Spheres first appeared on Fronkonstin.| Fronkonstin
The Moonies are up on their mountain, the lunatics have taken over the asylum, waiting on the rapture (The Daily Mail, Radiohead) I have not write any post lately, maybe because I have been quite busy with other unexpected project or maybe because I am going through a deep creative crisis. Whatever the reason, I … Continue reading The Mondrianomies→ The post The Mondrianomies first appeared on Fronkonstin.| Fronkonstin
On candy stripe legs the Spiderman comes, softly through the shadow of the evening sun (Lullaby, The Cure) Cellular automata are an inmense source of artistical images. Today, I experimented with Cyclic automata, which are ruled with these simple rules: Create a grid of cells. Give a state to each cell randomly; states a numbers … Continue reading Neighborhoods: Experimenting with Cyclic Cellular Automata→ The post Neighborhoods: Experimenting with Cyclic Cellular Automata first appeared ...| Fronkonstin
Spinning on that dizzy edge (Just Like Heaven, The Cure) This post talks about a generative system called Physarum model, which simulates the evolution of a colony of extremely simple organisms that, under certain environmental conditions, result into complex behaviors. Apart from the scientific interest of the topic, this model produce impressive images like this … Continue reading Abstractions→ The post Abstractions first appeared on Fronkonstin.| Fronkonstin
Ooh, see the fire is sweepin’Our very street todayBurns like a red coal carpetMad bull lost its way(Gimme Shelter, The Rolling Stones) After following this easy tutorial, you will be able to create tiled images from a photograph. You may want to use your own portrait or some other as I did. I use geom_tile: … Continue reading Monsters→ The post Monsters first appeared on Fronkonstin.| Fronkonstin
Sin patria ni banderas, ahora vivo a mi manera; y es que me siento extranjero fuera de tus agujeros (Tercer movimiento: Lo de dentro, Extremoduro) The technique I experimented with in this post is an endless source to obtain amazing images. It is called reaction-diffusion and simulates the evolution of a system where several substances … Continue reading Reaction Diffusion→ The post Reaction Diffusion first appeared on Fronkonstin.| Fronkonstin
Mathematics, rightly viewed, possesses not only truth, but supreme beauty (Bertrand Russell) You have a pentagon defined by its five vertex. Now, follow these steps: Step 0: take a point inside the pentagon (it can be its center if you want to do it easy). Keep this point in a safe place. Step 1: choose … Continue reading The Chaos Game: an experiment about fractals, recursivity and creative coding→ The post The Chaos Game: an experiment about fractals, recursivity and creative coding fir...| Fronkonstin
Y otra vez me arranco despacito, al sentir que nada necesito (Locura transitoria, Extremoduro) One of my favorite sites in the Internet is algorithmic botany . It’s always a source of inspiration for me. I recently discovered there the space colonization algorithm, concretely in this paper. Originally, the algorithm was developed to simulate leaf venation … Continue reading Colonizing Franky→ The post Colonizing Franky first appeared on Fronkonstin.| Fronkonstin
Here we are going to look at several diagnostic plots are helpful when attempting to answer a causal question. They can be used to visualize the target population, balance, and treatment effect heterogeneity. Setup I’ve simulated data to demonstrate the utility of the various plots. In each simulation, we have four pre-treatment variables: var1, var2, var3, and var4, a treatment, t, and an outcome y. I have also fit a propensity score model for each and calculated ATE, ATT, and overlap weig...|
To celebrate the 40th anniversary of the paper The Central Role of the Propensity Score in Observational Studies for Causal Effects published in Biometrika in 1983, the journal Observational Studies had a special issue highlighting the methods in the paper and developed since. This led us to take a closer look at this seminal paper, and in doing so we noticed mention of a visual diagnostic tool that we haven’t see used often but might be useful for exploring potential treatment effect heter...|
After my previous post about missing data, Kathy asked on Twitter whether two wrong models (the imputation model + the outcome model) would be better than one (the outcome model alone). Without doing any of the math, I’d guess the assumption of correctly spec the model also has a bigger impact in the CC analysis. You need correct spec in MI, twice, but trade off that potential bias for higher prec. This is a great question! I am going to investigate via a small simulation (so the answer cou...|
Here is the scenario: You are trying to predict some outcome, , and some of your predictors have missing data. Will doing a complete case analysis give you unbiased results? What additional information do you need before deciding? For some reason, when I tried to answer this question, my first instinct was to try to decide whether the data were missing at random, but it turns out, this might not be the right first question! Why? Complete case analysis will give us unbiased estimates even if t...|
We have migrated our blog from Hugo to Quarto! Here are a few quick tips that made the transition a bit smoother. 1. Setting up a Quarto website It is super easy to set up a Quarto website. To get the basic template, you can run the following in your terminal: quarto create-project mysite --type website You can find lots of details about how to customize your site in the Quarto Docs. The rest of this post will cover a few things that made the transition smooth for us. 2. Moving .Rmd files fro...|
The tipr R package has some new features! And a new and improved API! What is tipr tipr is an R package that allows you to conduct sensitivity analyses for unmeasured confounders. Why might you want to do that? Well, as it turns out, the assumption of “no unmeasured confounders” is integral to any estimation of a causal effect. This assumption is untestable, so often the best we can do is examine how far off our estimates would be should an unmeasured confounder exists, hence sensitivity ...|
There was a recent email thread in the IsoStat listserv about a cool visualization that recently came out in the New York Times showing COVID-19 cases over time. This sparked a discussion about whether this was possible to recreate in R with ggplot, so of course I gave it a try! library(tidycensus)library(tidyverse)library(geofacet)library(zoo) The plot shows cases per 100,000 by state, so I first needed to pull population data. To do that I used the tidycensus package. (If you don’t have a...|
Photo credit to David Clode on Unsplash In the past few weeks, I’ve been writing about a stack of tools and specific packages like polars that may help R users feel “at home” when working in python due to similiar ergonomics. However, one common snag in switching languages is ramping up on common “recipes” for higher-level workflows (e.g. how to build a sklearn modeling pipeline) but missing a languages’s fundamentals that make writing glue code feel smooth (and dare I say pleasa...| Emily Riederer
Photo credit to Hans-Jurgen Mager on Unsplash A few weeks ago, I shared some recommended modern python tools and libraries that I believe have the most similar ergonomics for R (specifically tidyverse) converts. This post expands on that one with a focus on the polars library. At the surface level, all data wrangling libraries have roughly the same functionality. Operations like selecting existing columns and making new ones, subsetting and ordering rows, and summarzing results is tablestakes...| Emily Riederer
Photo credit to the inimitable Allison Horst Interoperability was a key theme in open-source data languages in 2023. Ongoing innovations in Arrow (a language-agnostic in-memory standard for data storage), growing adoption of Quarto (the language-agnostic heir apparent to R Markdown), and even pandas creator Wes McKinney joining Posit (the language-agnostic rebranding of RStudio) all illustrate the ongoing investment in breaking down barriers between different programming languages and paradig...| Emily Riederer
url_video: “” Quick Links Abstract Slides Video At Coalesce for dbt user audience: Slides Video At posit::conf for R user audience: Slides Video - posit::conf for R User Audience coming soon! Post - Column Name Contracts Post - Column Name Contracts in dbt Post - Column Name Contracts with dbtplyr Complex software systems make performance guarantees through documentation and unit tests, and they communicate these to users with conscientious interface design. However, published data tables...| Emily Riederer
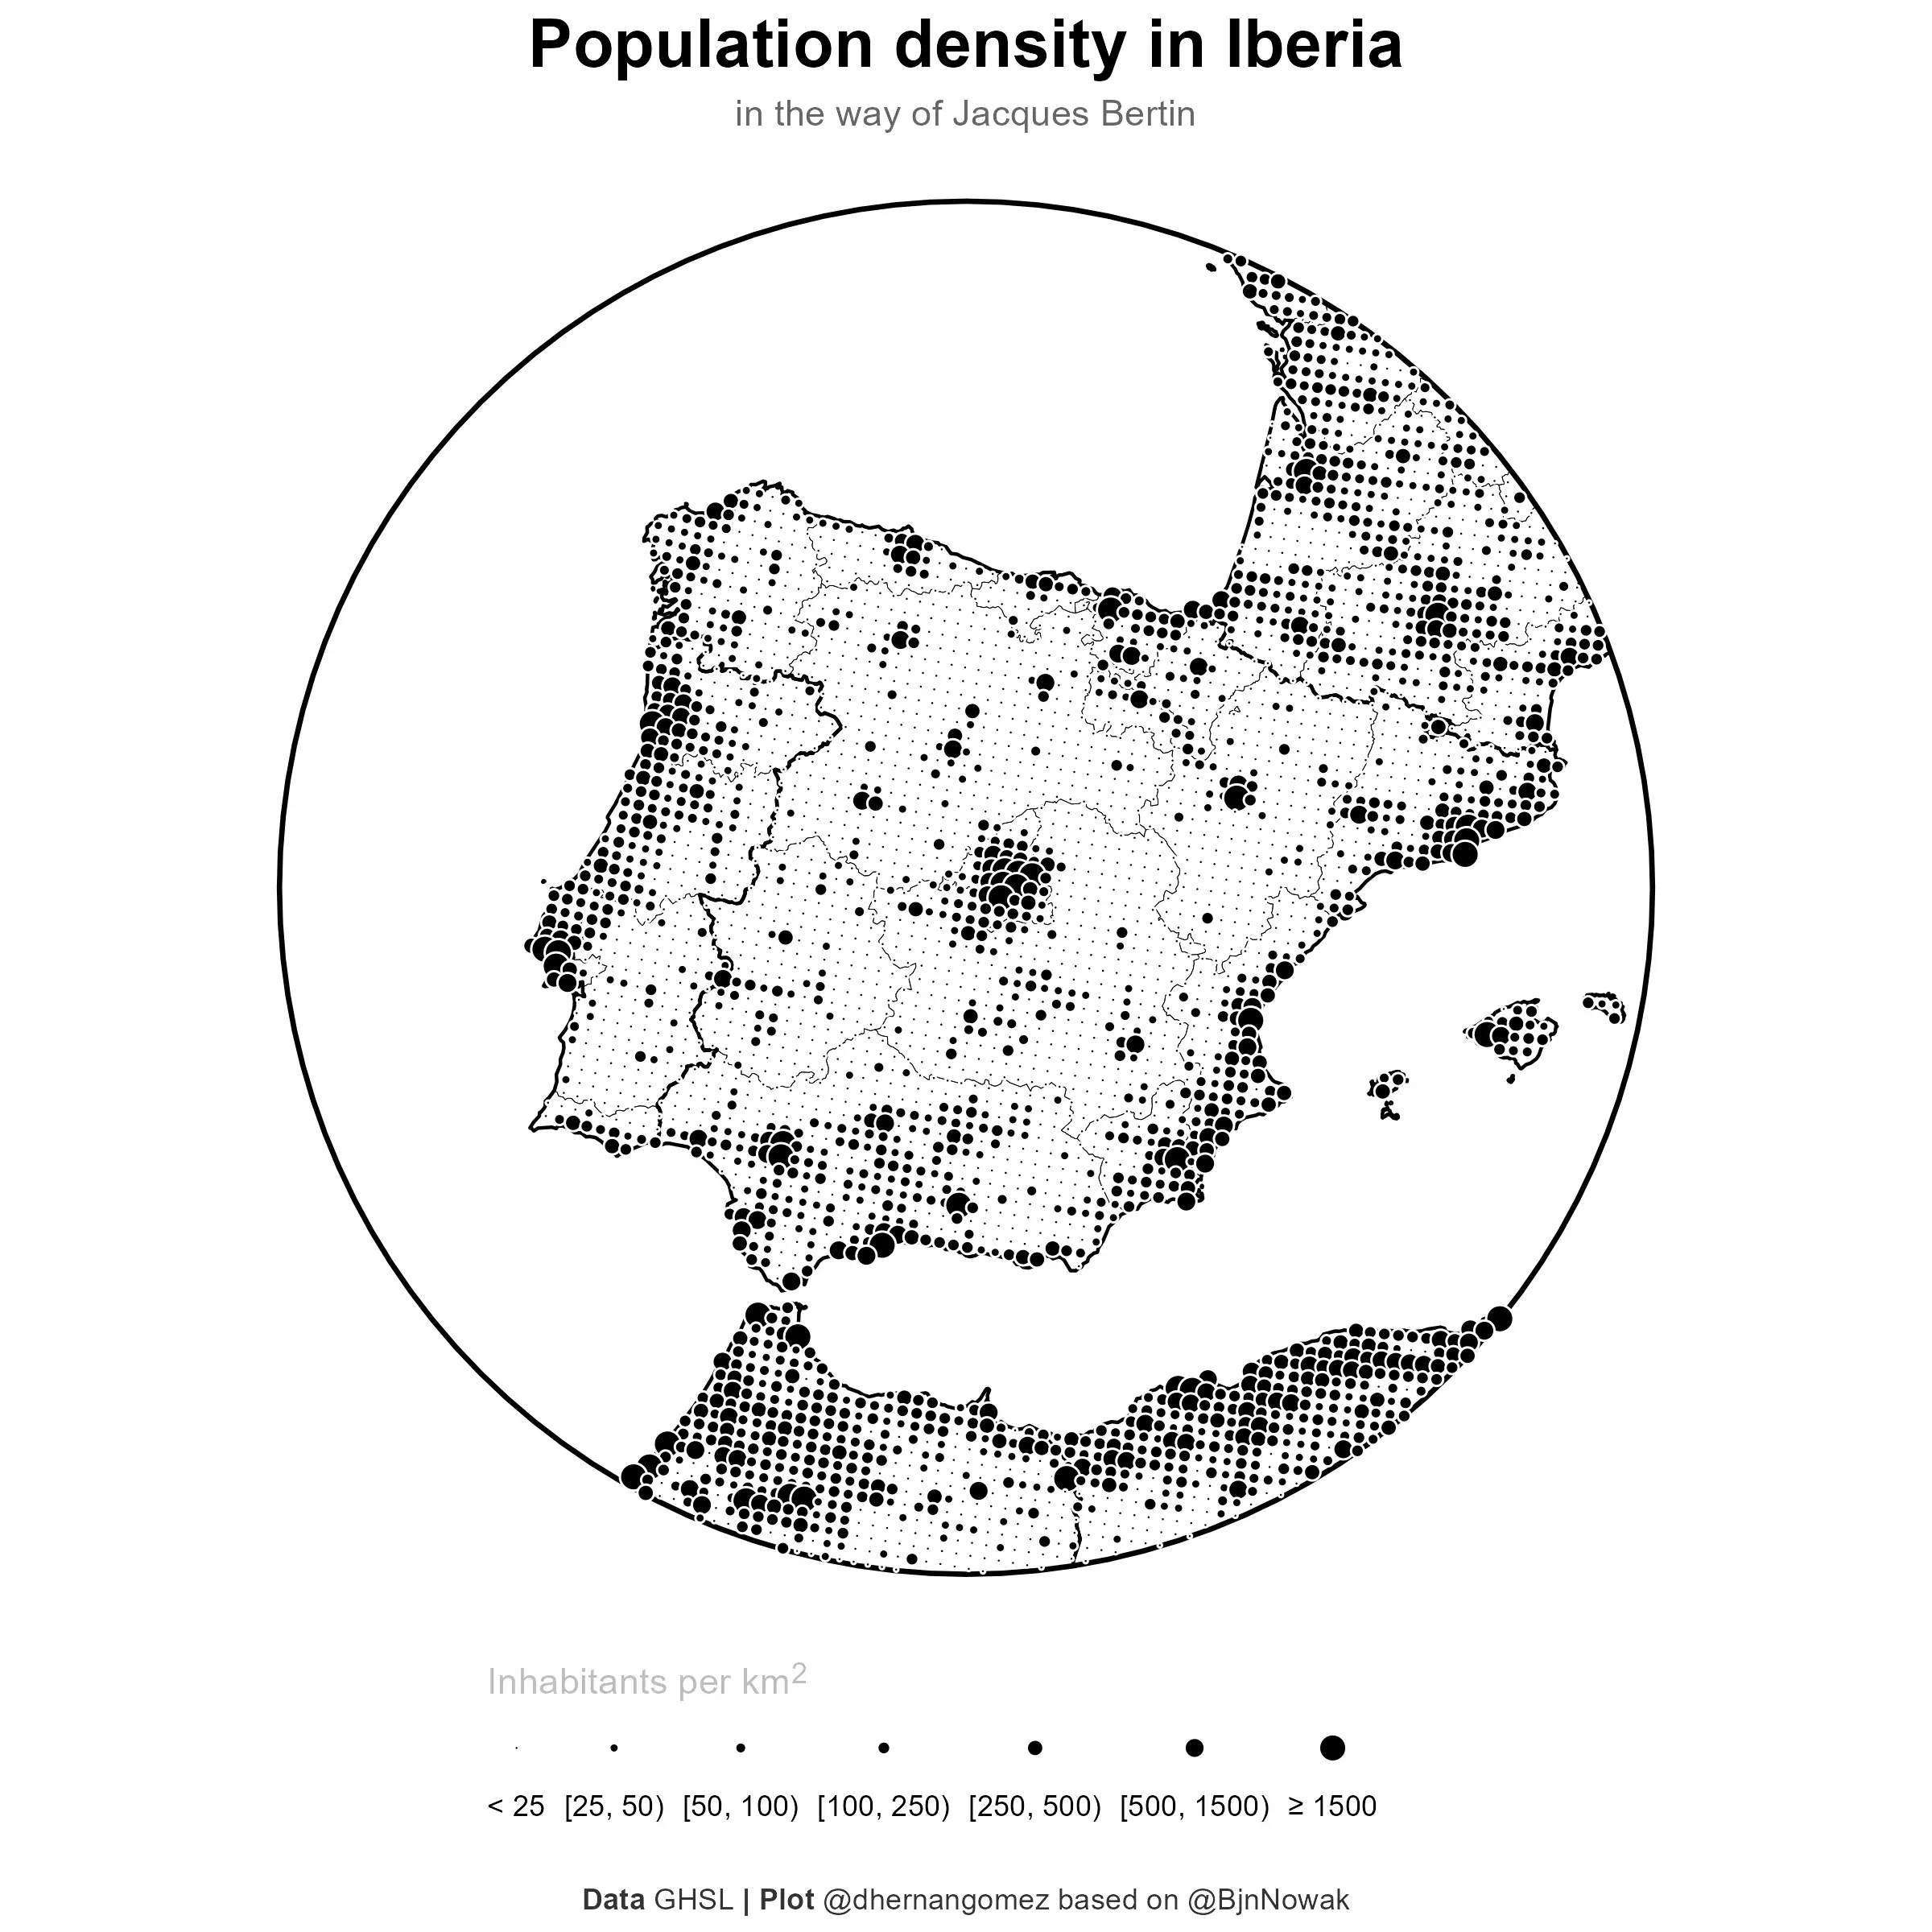
Bertin's dot density maps with R and GHSL - Another way to represent demographics on a map.| One world | Projects, maps and coding

Creating Star Map Visualizations Based on Location and Date - A couple of weeks ago I was doing my daily...| One world | Projects, maps and coding
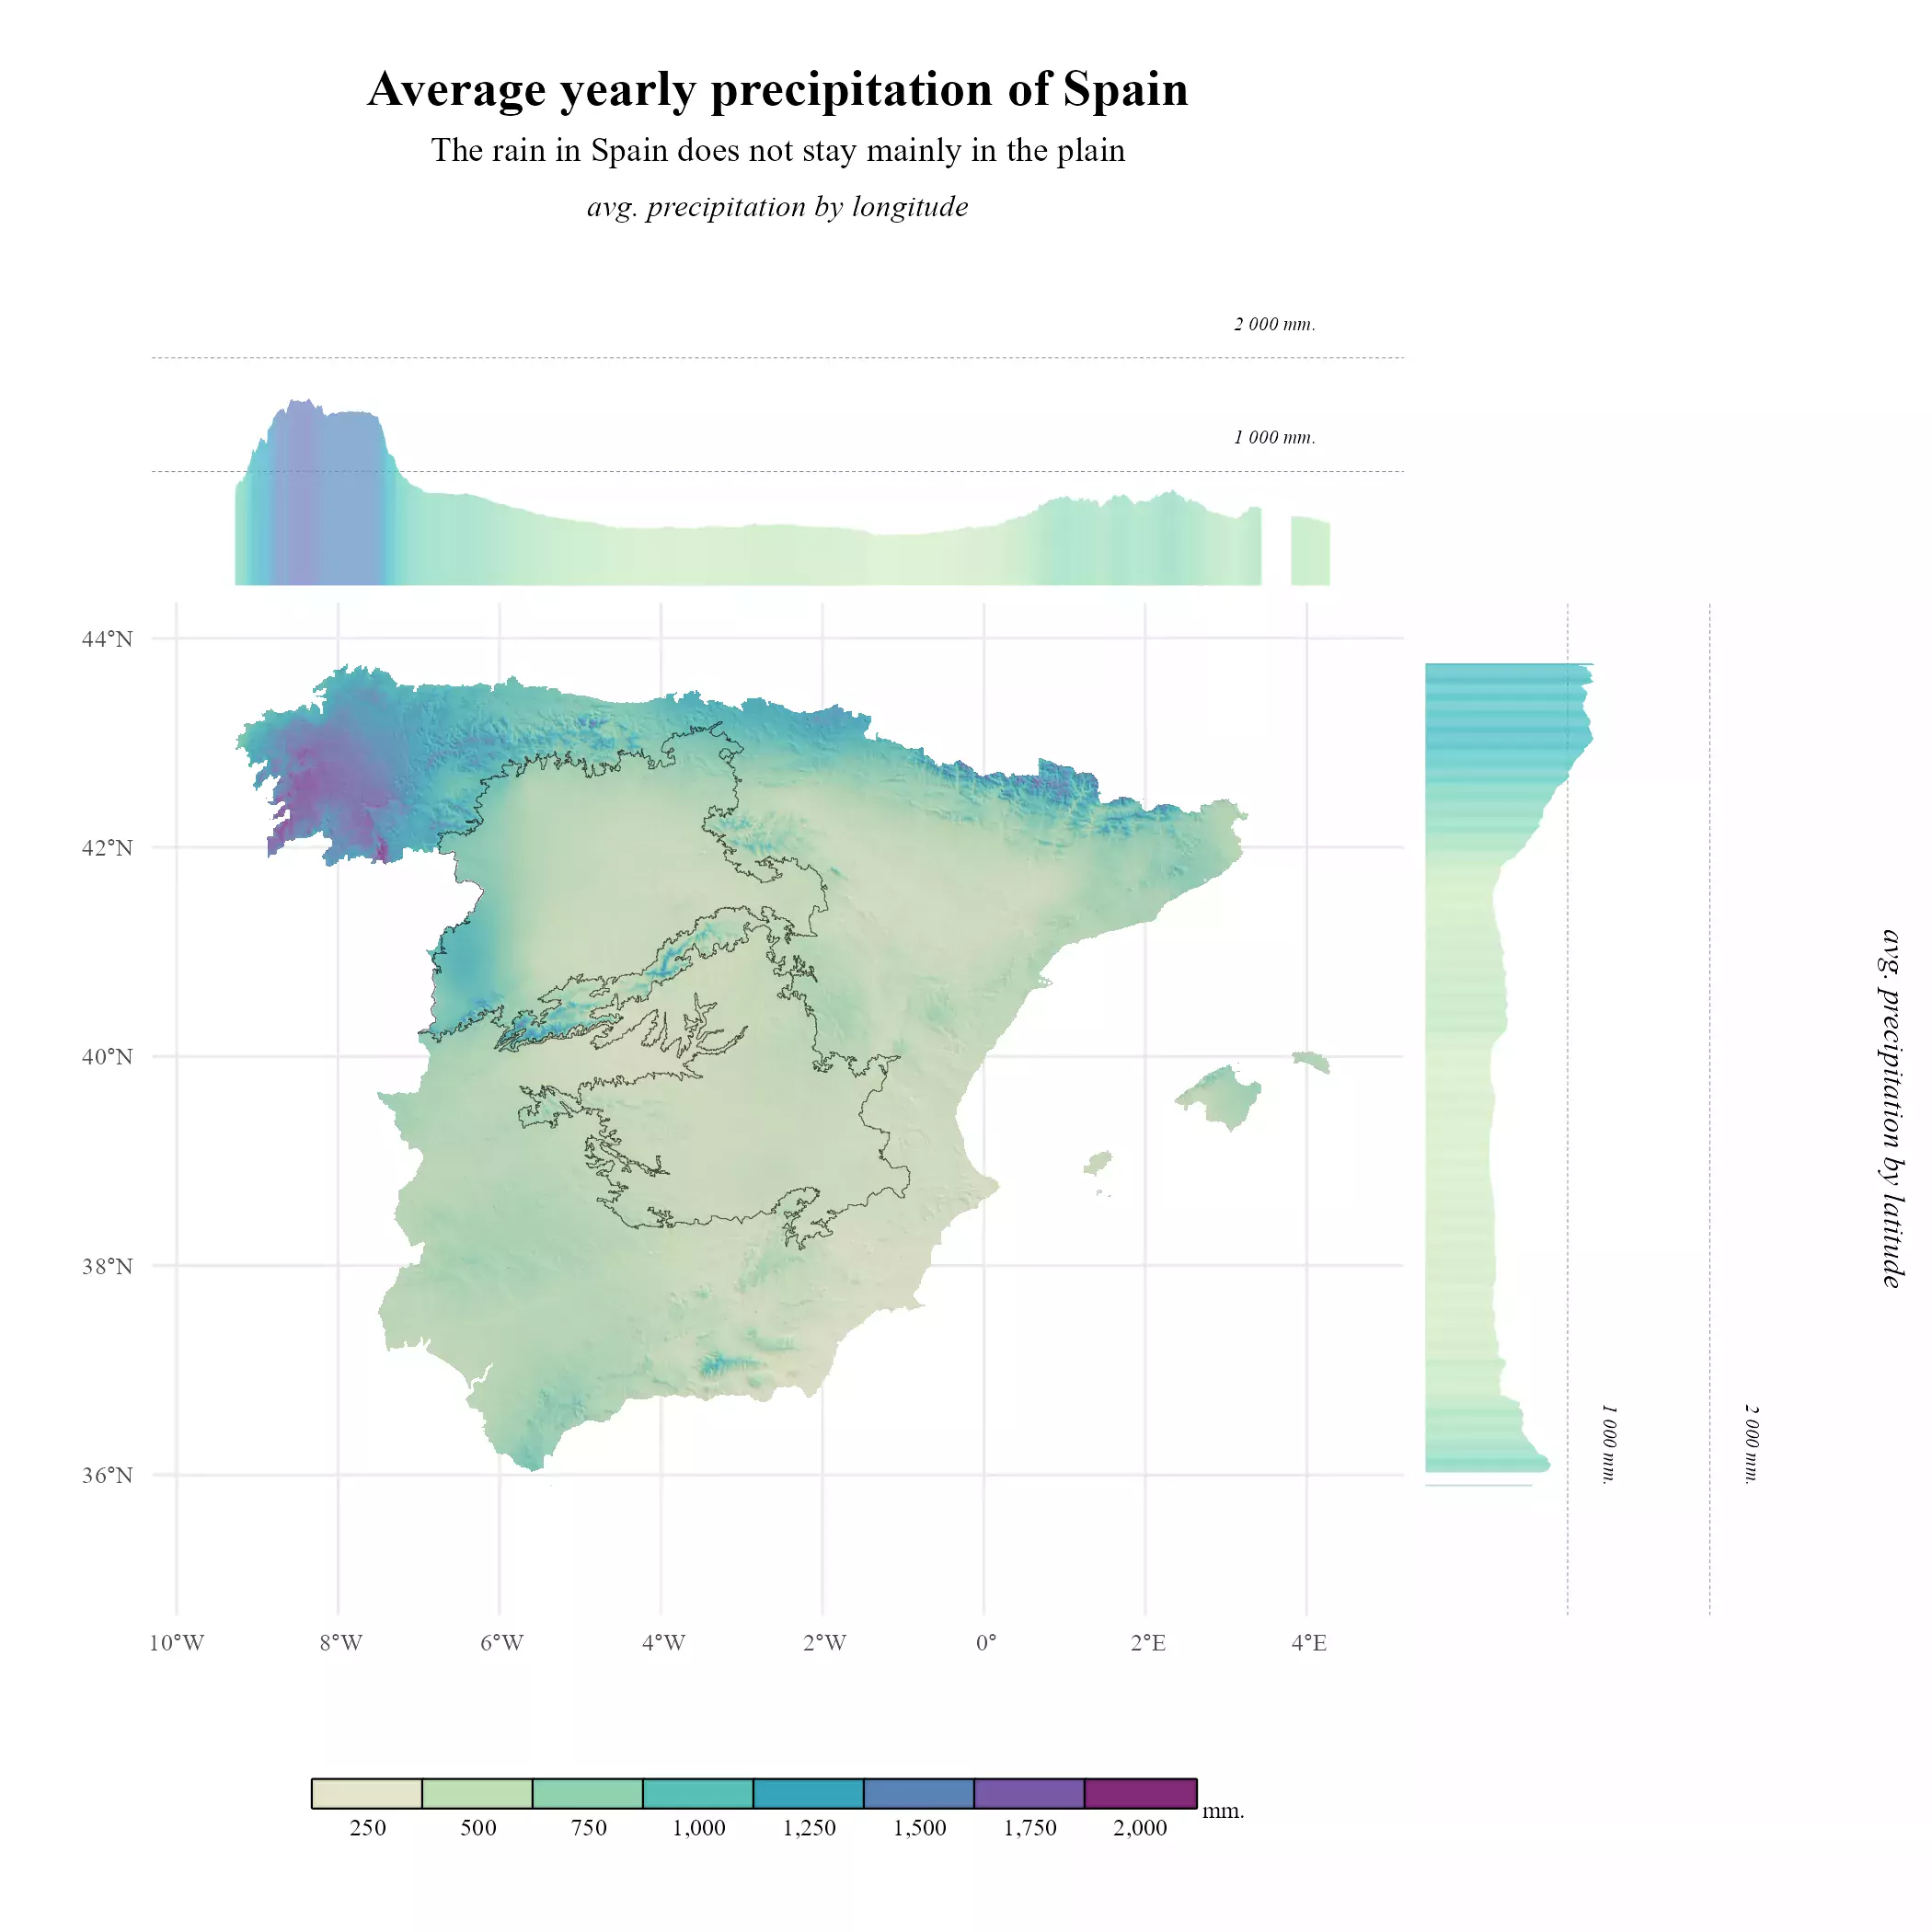
The rain in Spain does not stay mainly in the plain - Add marginal plots to a SpatRaster map on...| One world | Projects, maps and coding
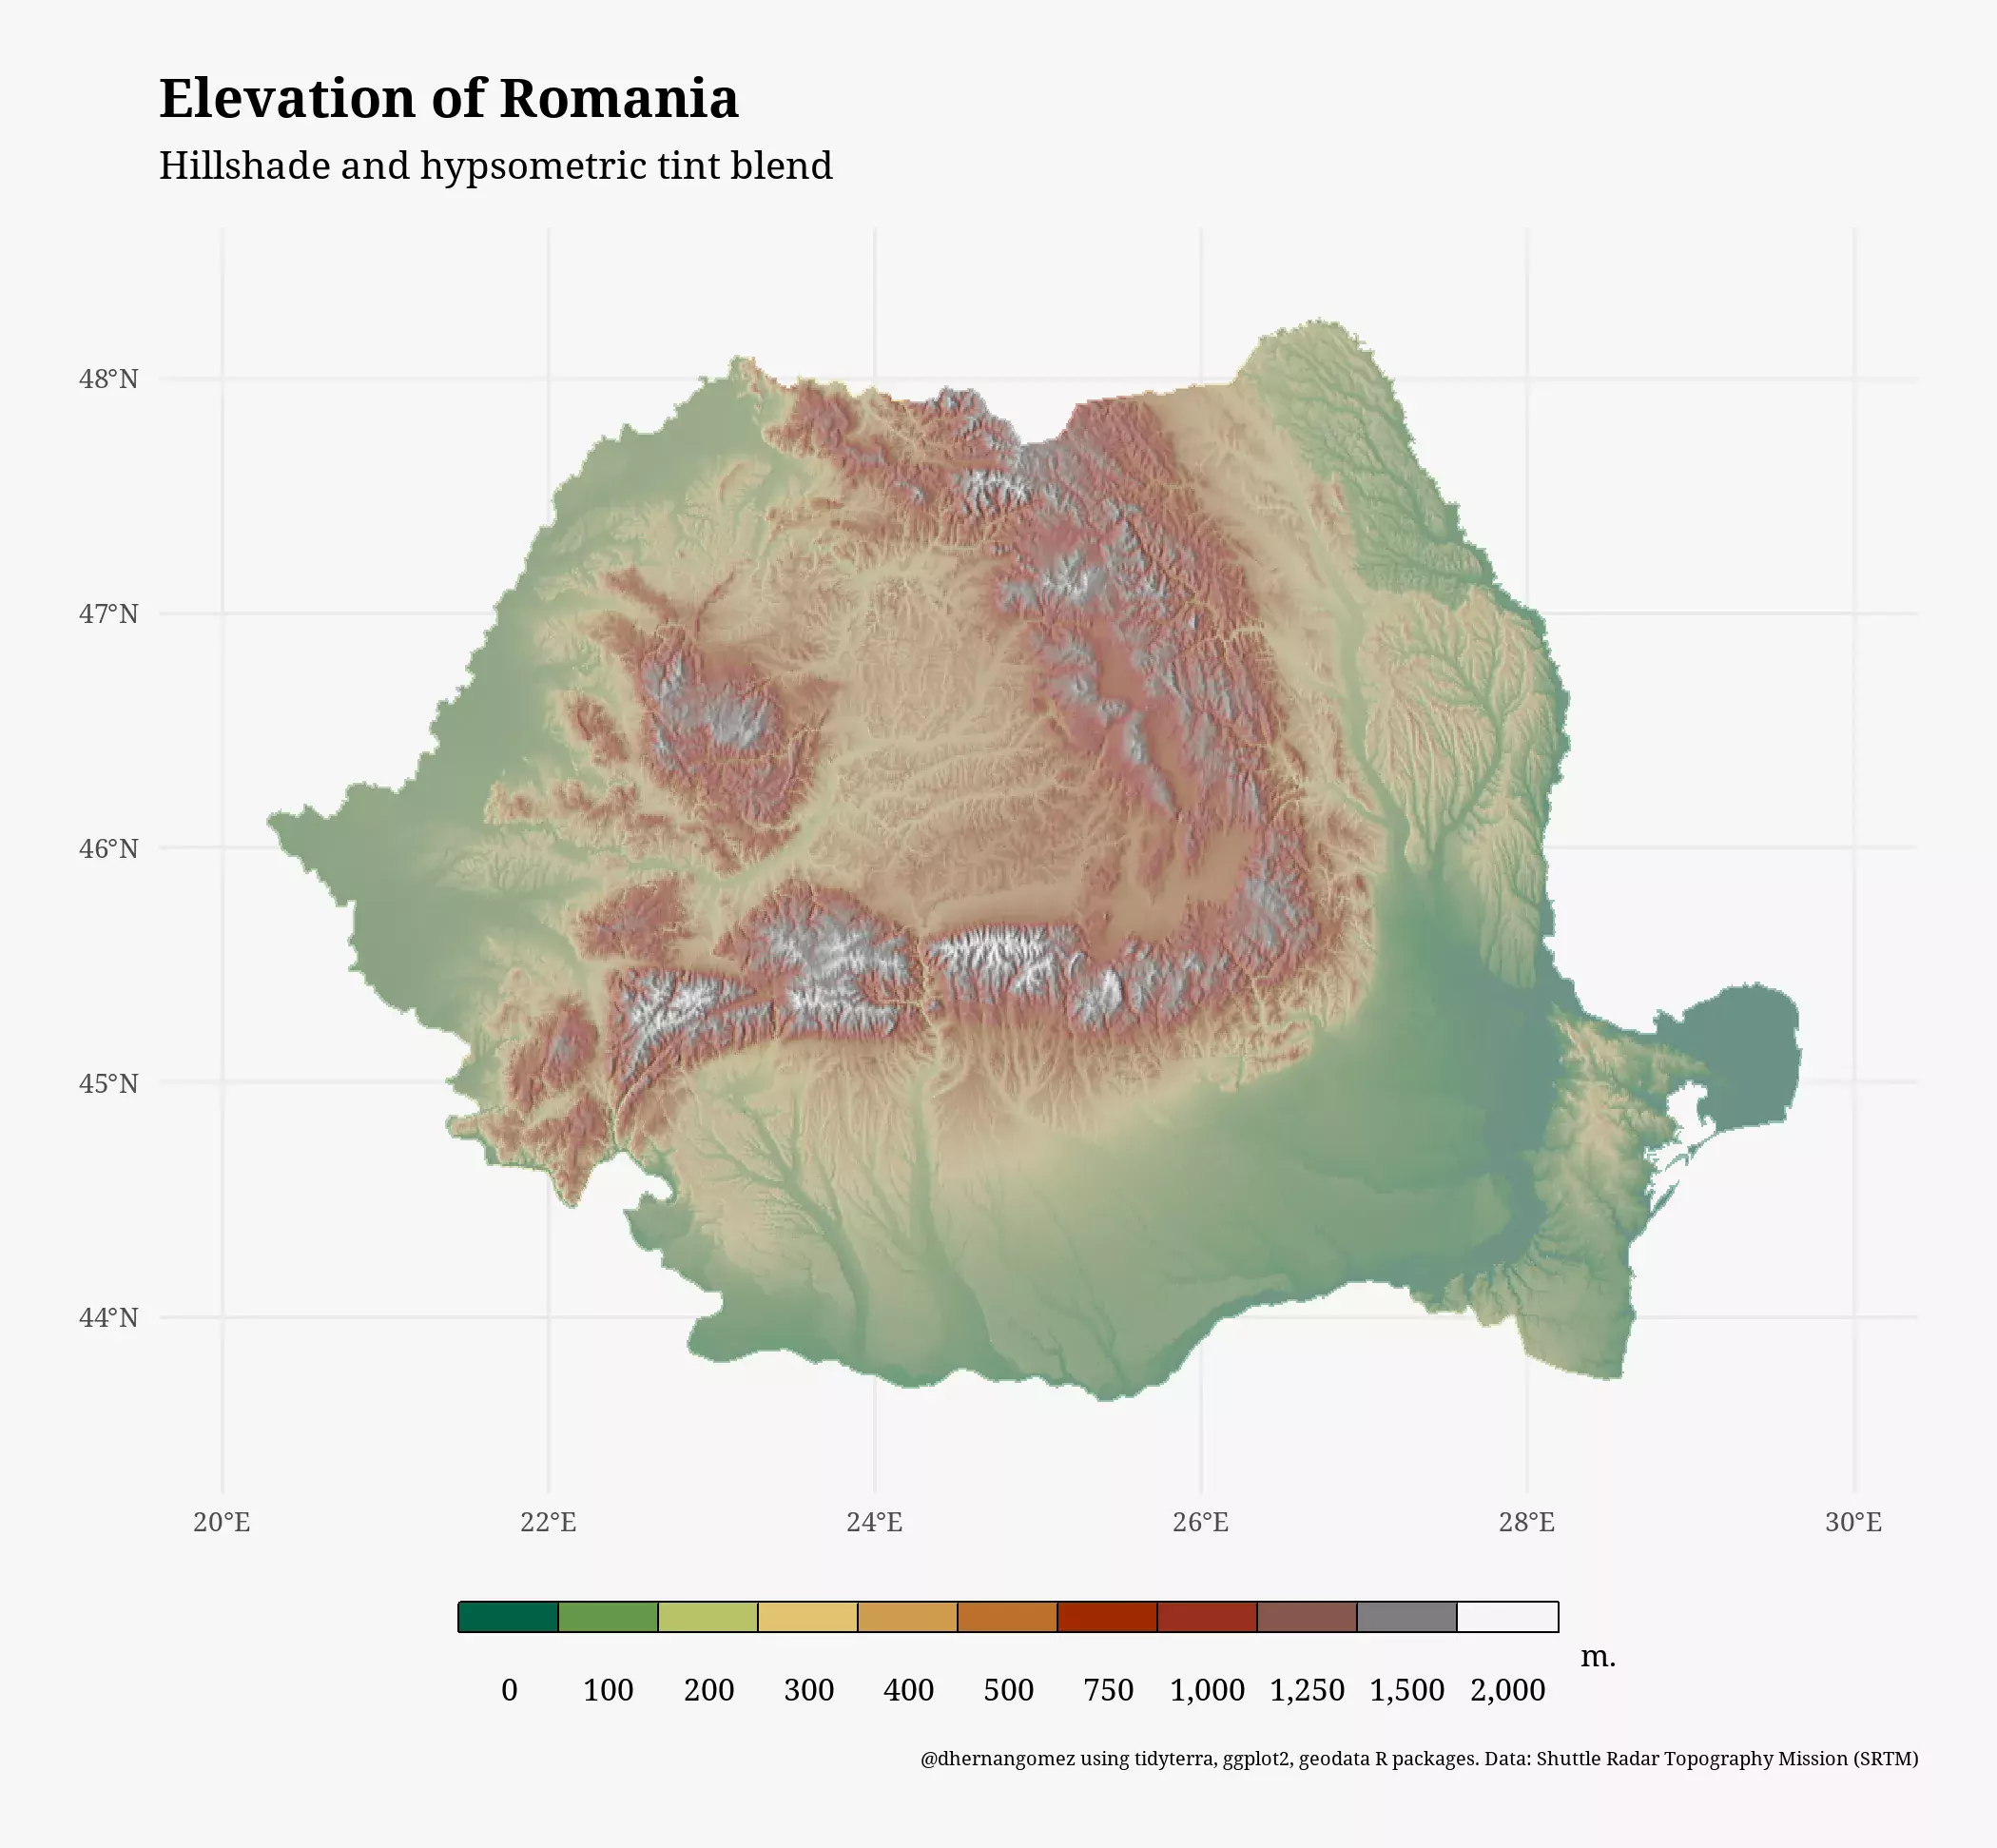
How to overlay SpatRasters - Using shadow effects on relief mappings is a very common technique, that allows to produce...| One world | Projects, maps and coding
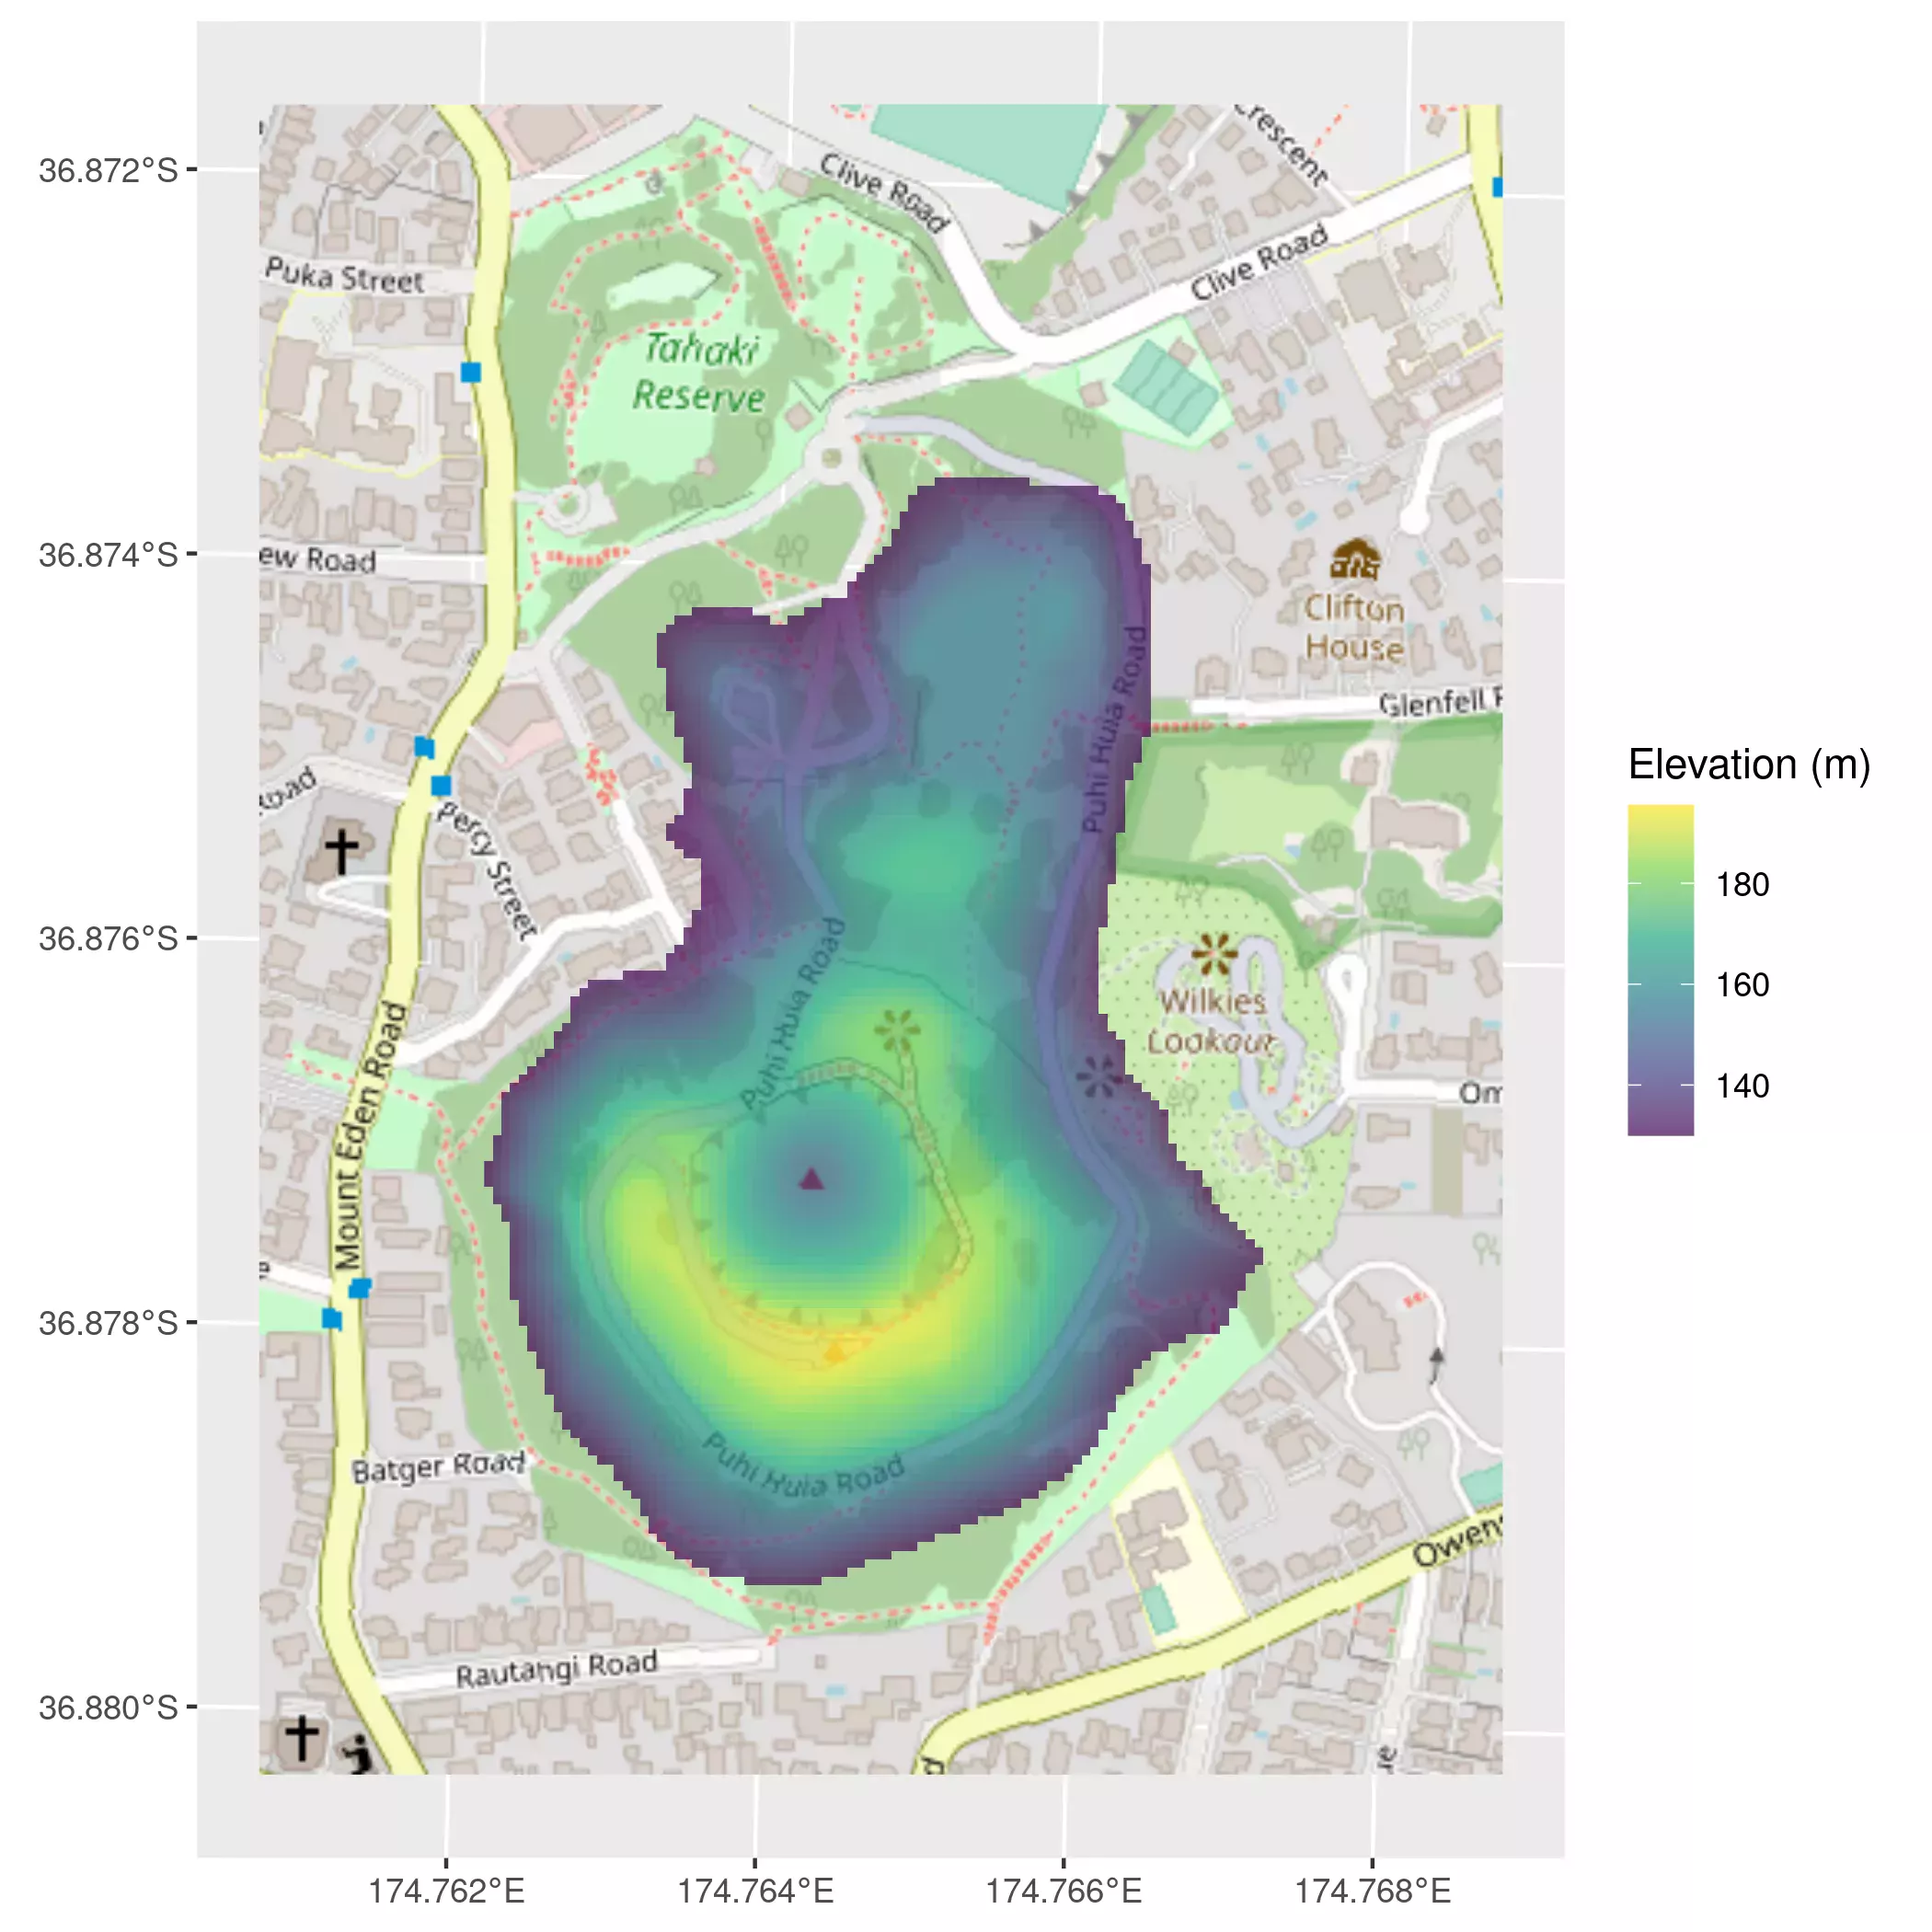
Easily work and ggplot SpatRasters - tidyterra provides tidyverse methods for terra objects and geom functions for plotting with ggplot2....| One world | Projects, maps and coding

Joyplot elevation maps with ggridges and terra - Create ridgelines (AKA joyplots) of territories using elevation data with R, sf,...| One world | Projects, maps and coding
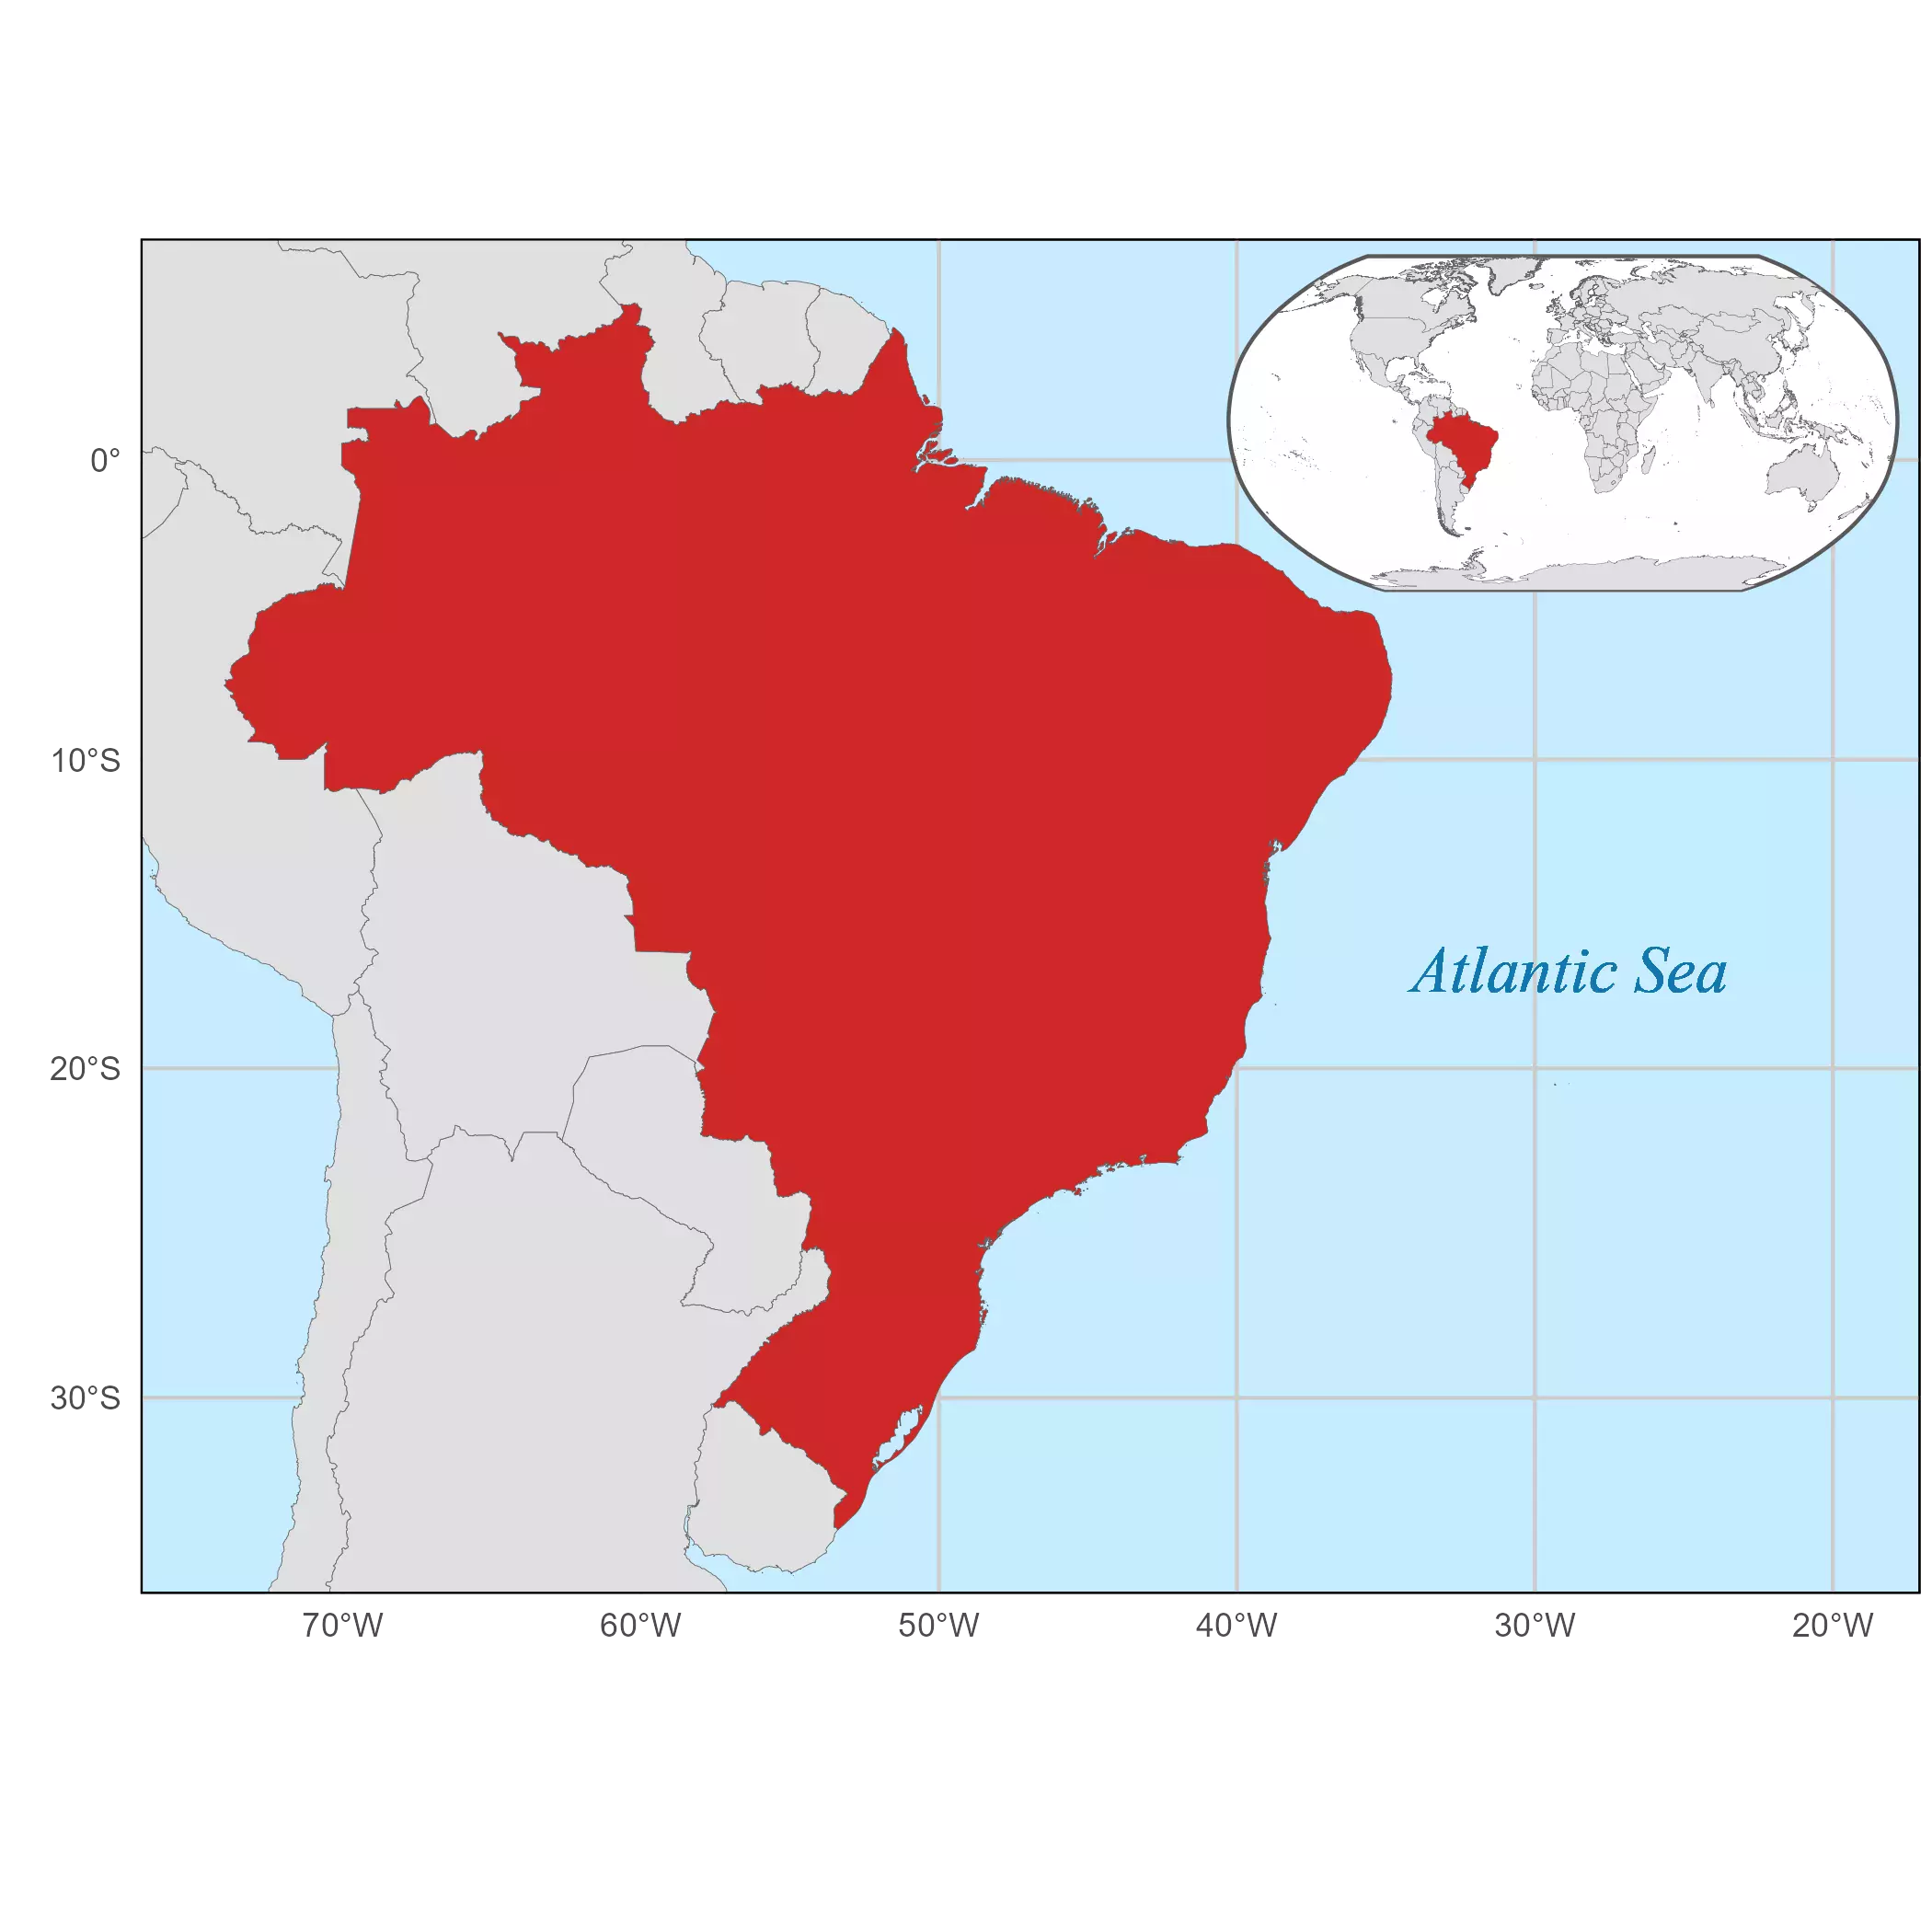
A map on a map - A common challenge when creating maps is how to include an inset map on...| One world | Projects, maps and coding
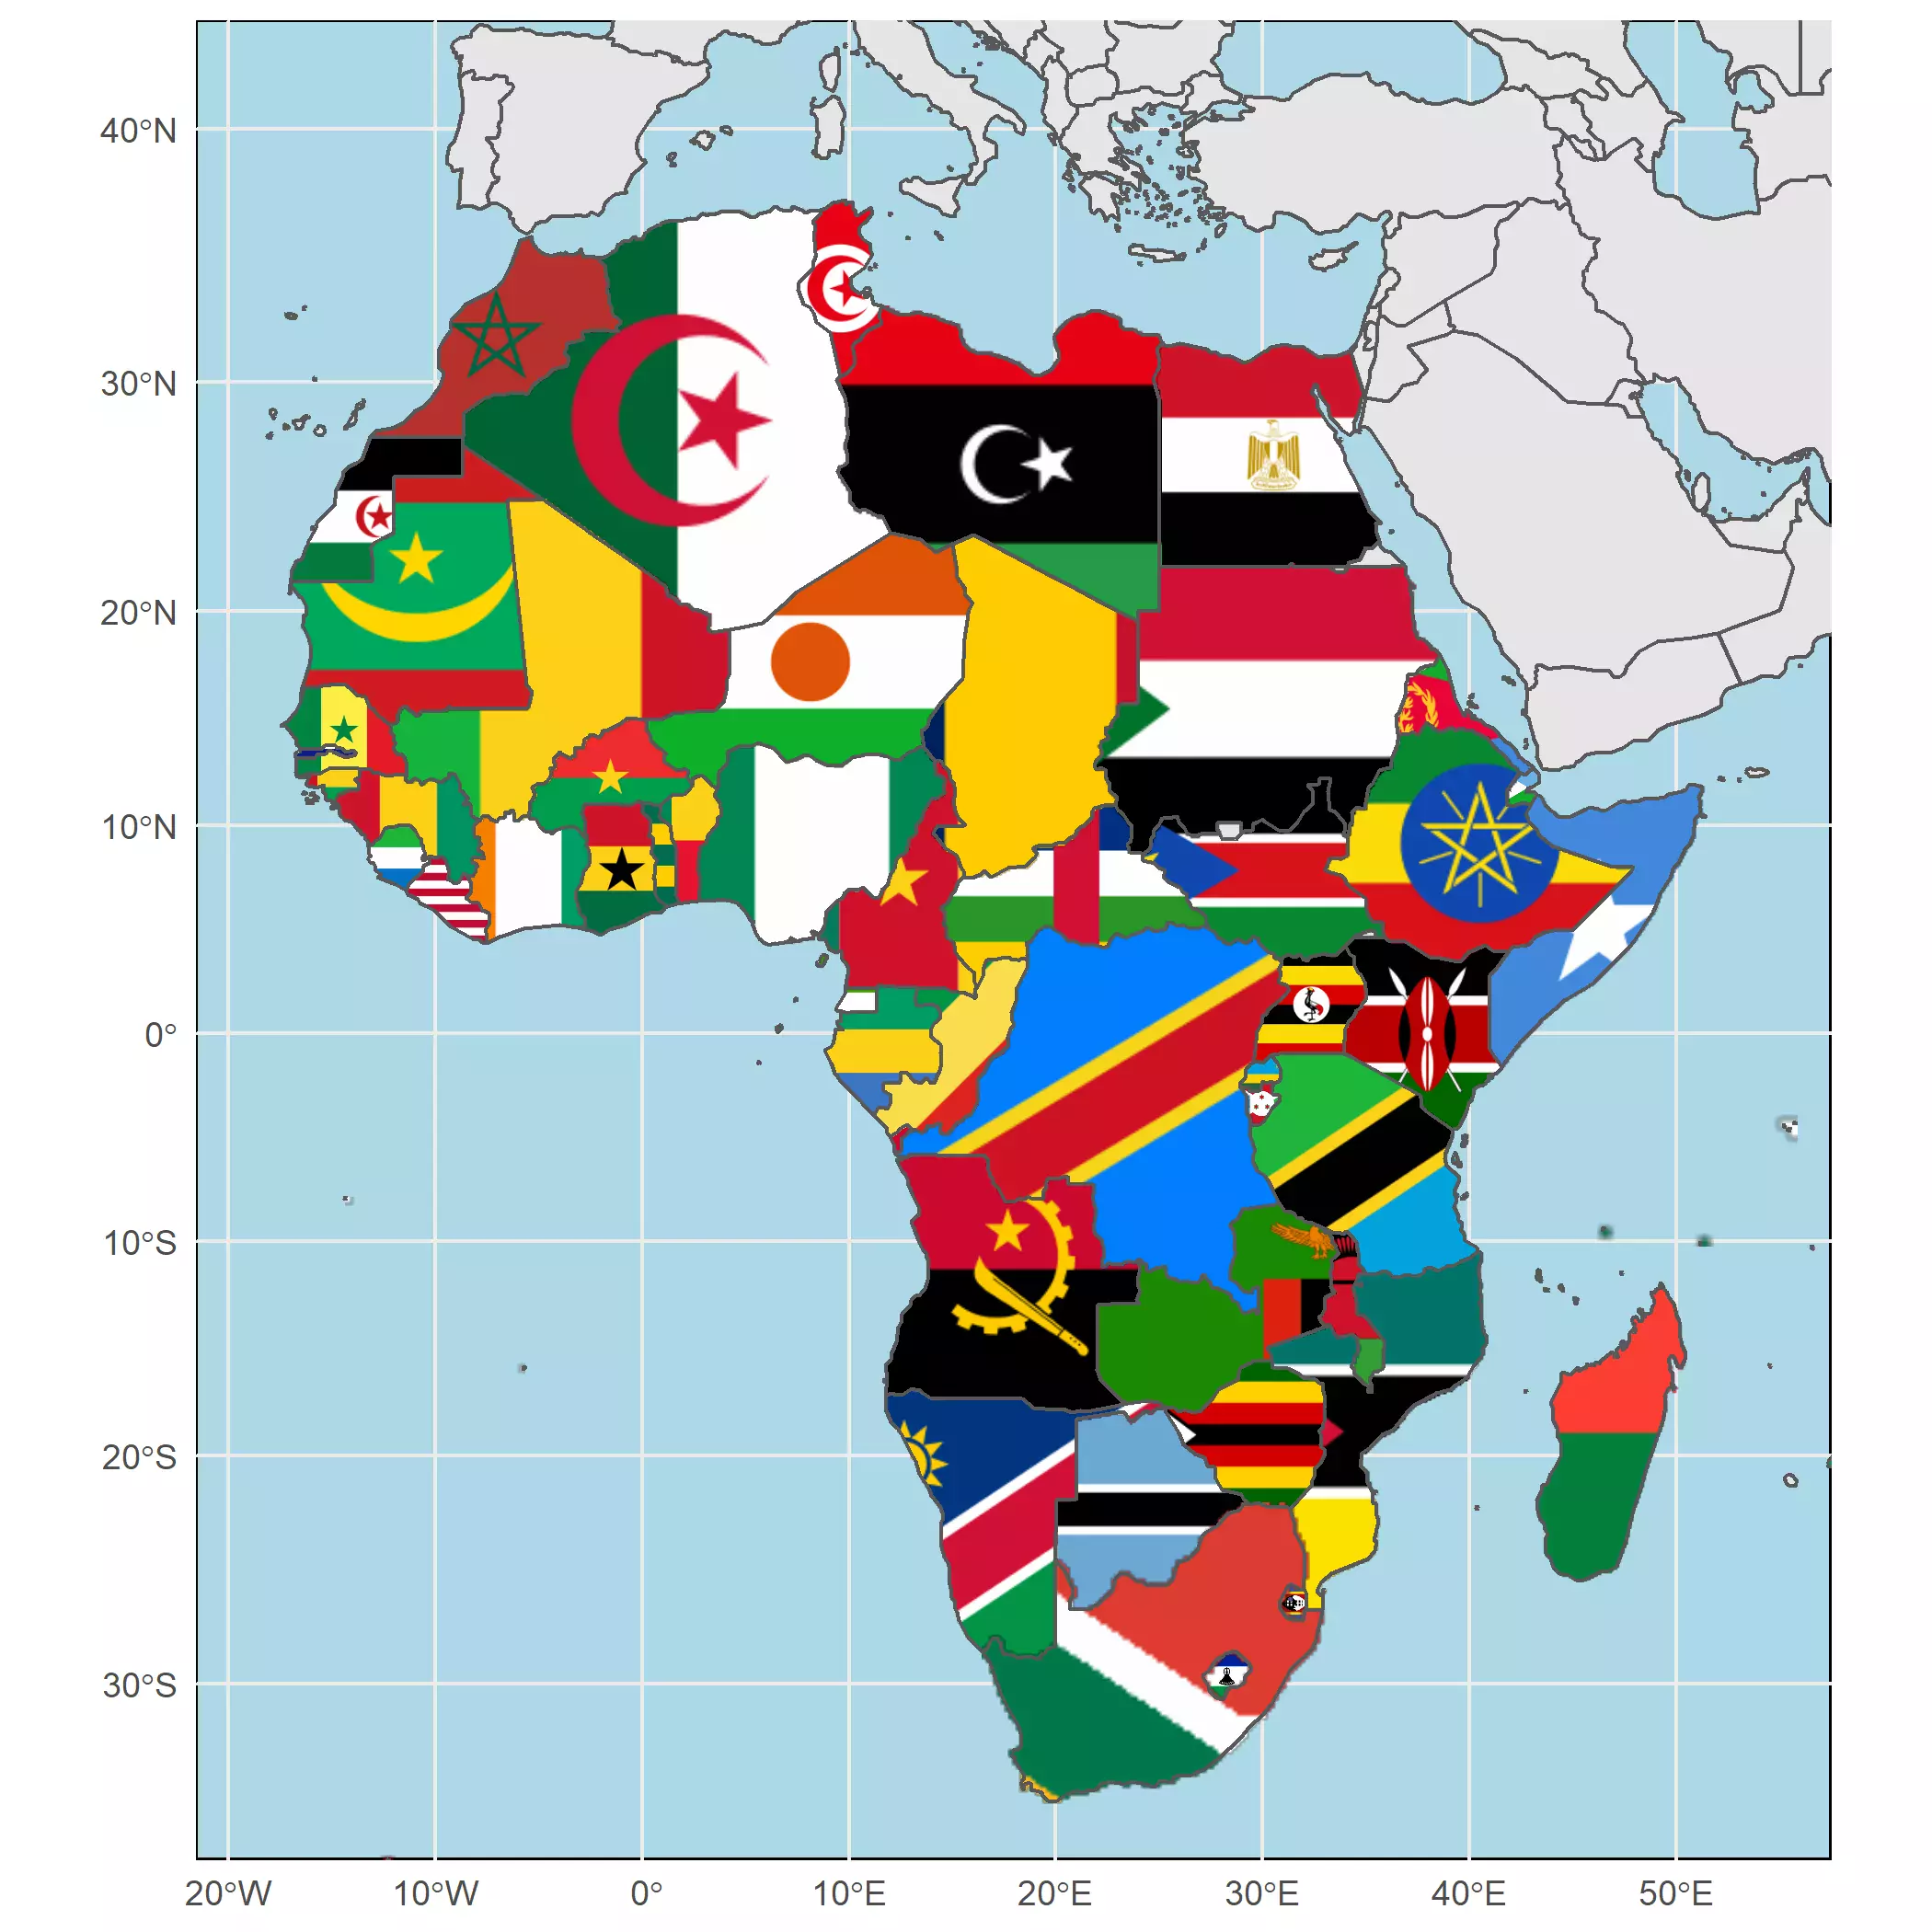
Any picture as a basemap - On 27 Jan. 2022 my package rasterpic was accepted on CRAN (Hooray!!). This package...| One world | Projects, maps and coding
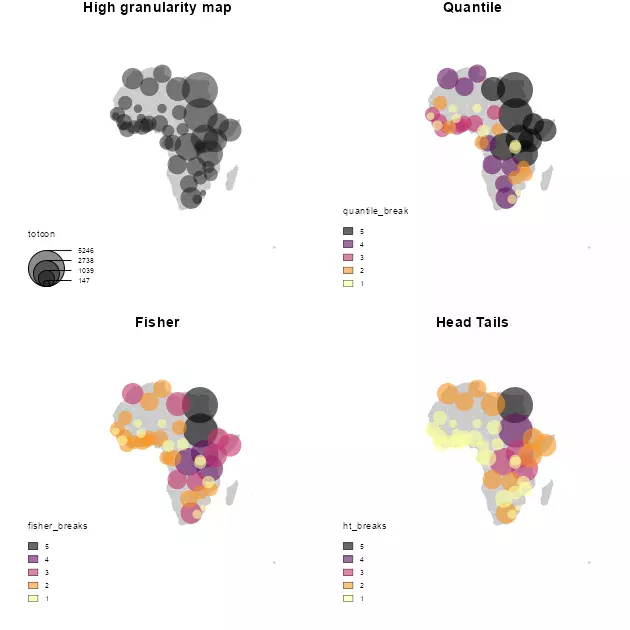
There are far more ordinary people (say, 80 percent) than extraordinary people (say, 20 percent); this is often characterized by...| One world | Projects, maps and coding
Vignette of the package expansion - Introduction| One world | Projects, maps and coding
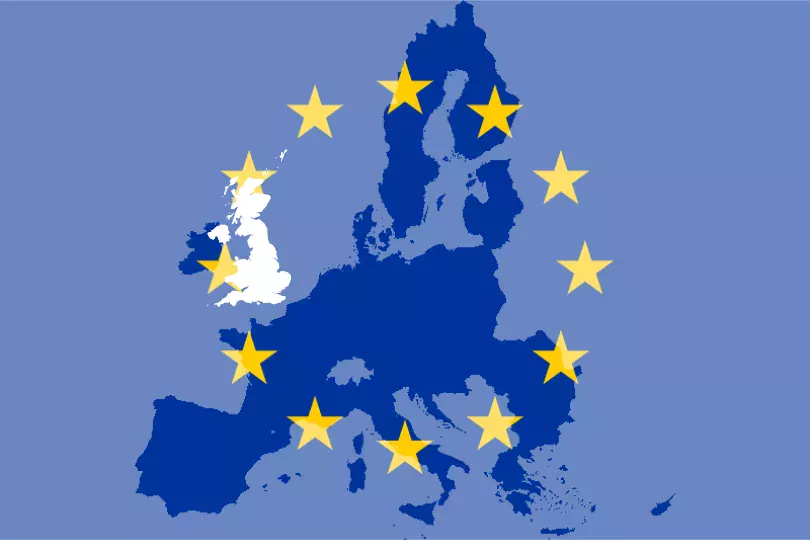
Brexit and the consequences - This is just a super-quick post regarding Brexit. Leaving apart economical, political and social considerations,...| One world | Projects, maps and coding
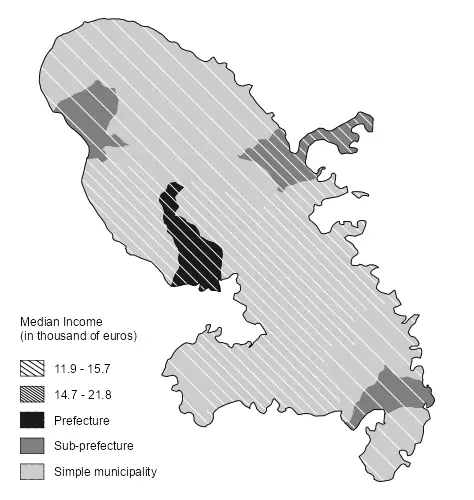
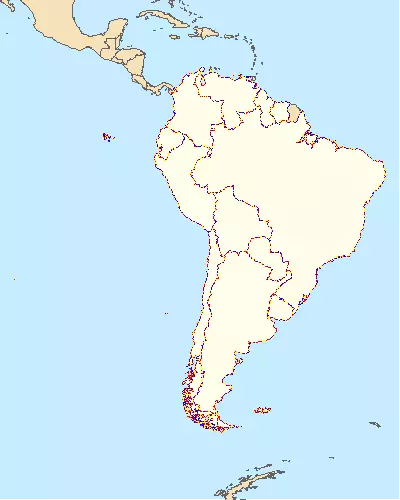
A solution for b/w and academic maps. - Updated 17 february 2020: All these pieces of work are already available...| One world | Projects, maps and coding

An alternative using plot() - How to place an inset map in R? There are many solutions out there using...| One world | Projects, maps and coding
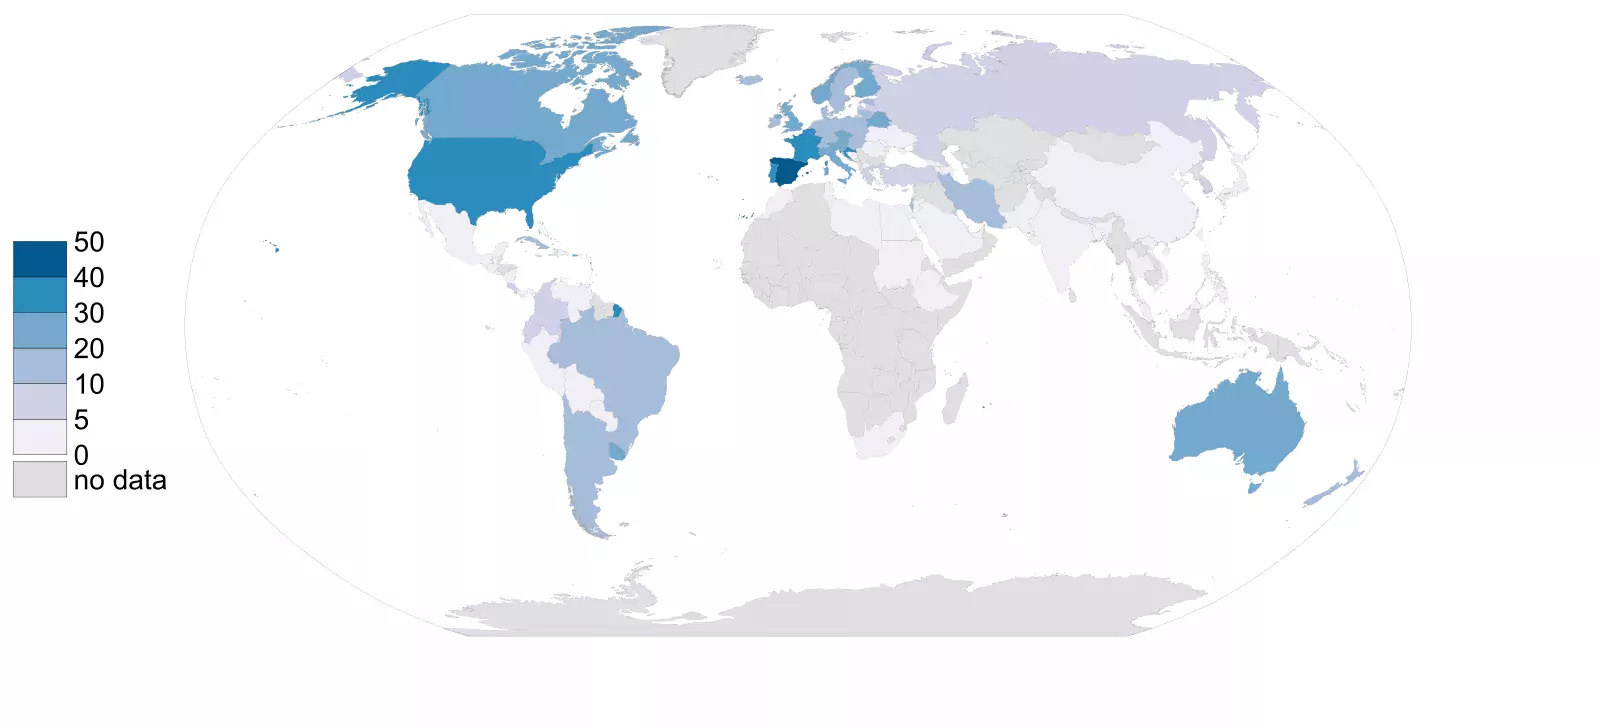
A choropleth map with R - This is a quick post on how to create a map as per the...| One world | Projects, maps and coding

Put a picture on your map - Want to use a flag (or any *.png file) as a background of...| One world | Projects, maps and coding
Awesome simplified maps with R - Sometimes you want to produce maps with special layouts. I specially like maps with...| One world | Projects, maps and coding
Make it work in 6 steps - a short tutorial - Recently I have been struggling when trying to embed...| One world | Projects, maps and coding
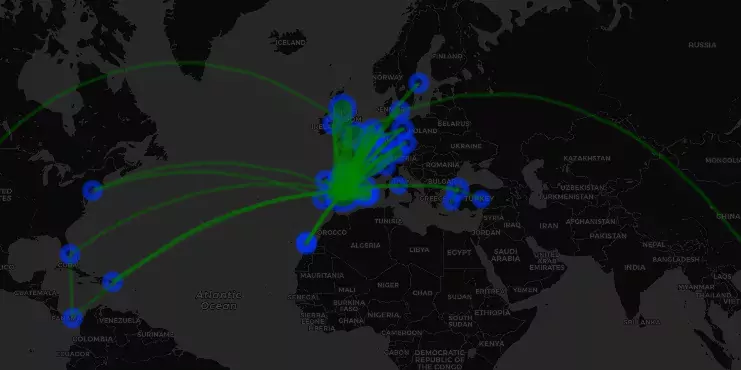
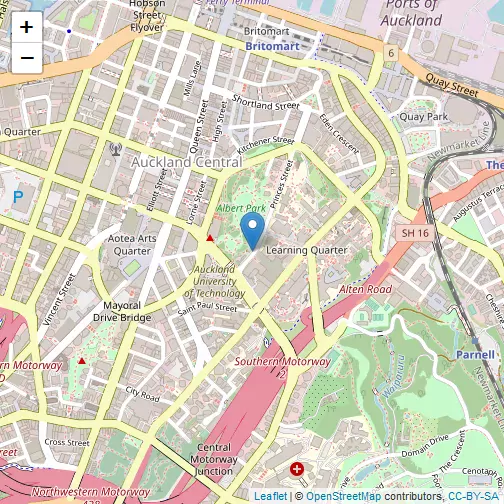
A leaflet map with the places I have flown - This is a very personal post, where I just show...| One world | Projects, maps and coding
User-defined function using sf package - This post introduces a used-defined function used for casting sf objects of class LINESTRING...| One world | Projects, maps and coding
vignette of the CountryCodes project - This vignette is an example of use of the database provided in the Github...| One world | Projects, maps and coding
