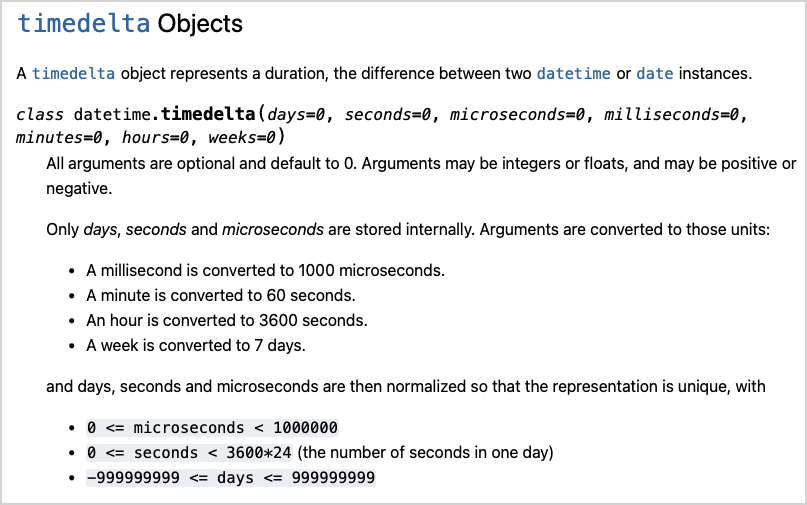
MP 152: But the timedelta implementation in Python is correct. In many projects, timestamps are just a bit of metadata you might look at once in a while when troubleshooting. But sometimes, timestamps are a critical piece of information. If you handle them right, your project works. If you don't,| Mostly Python
FlameGraphs are superawesome. If you've never heard of FlameGraphs and want to dive straight in the deep end, you should run off and check out the many many good resources provided by Brendan Greg in his one stop shop page here. This post will give a quick intro and some samples to get you started with collecting profiles for all JVMs everywhere. I'm taking a slightly different tack then Brendan in presenting the topic, so if it turns out my explanations suck you should see if his make more s...| Psychosomatic, Lobotomy, Saw
So, going on from my whingy post on safepoint bias, where does one go to get their profiling kicks? One option would be to use an OpenJDK internal API call AsyncGetCallTrace to facilitate non-safepoint collection of stack traces.| Psychosomatic, Lobotomy, Saw
This post builds on the basis of a previous post on safepoints. If you've not read it you might feel lost and confused. If you have read it, and still feel lost and confused, and you are certain this feeling is related to the matter at hand (as opposed to an existential crisis), please ask away.| Psychosomatic, Lobotomy, Saw
{This post assumes some familiarity with JMH. For more JMH related content start at the new and improved JMH Resources Page and branch out from there!}| Psychosomatic, Lobotomy, Saw
A Puzzling Performance Puzzler Spoiler Alert Two points before getting into this. First, my apologies to all those that sent me their solution that I wasn’t able to respond to. Second, I’d encourage you to make your own attempt at this puzzle before reading any further. What follows is my solution so don’t read any further. Spoiler alert, solution about to start. Last warning, now onto my solution. The Puzzler On the surface, the puzzle appears quite trivial, take a method (from a large...| Random Notes and Cheat Sheets
In my last article I wrote about some tooltip optimization to reduce the start time of the Unreal Editor by 2-5 seconds. Turns out people do really care about their editor start time. So much that …| Larst Of Us
With the increasing importance of GPU computing, having a robust and familiar C standard library becomes a valuable asset for developers. The LLVM project is actively working to provide this foundation, as a solid libc implementation enables more complex libraries to be developed for and used on GPUs.| The LLVM Project Blog
Introduction If you ever wanted to profile your Python code on PyPy, you probably came across VMProf — a statistical profiler for PyPy. VMProf's console output can already give some insights into wher| PyPy
A very common side effect of working as a programmer is the constant frustration of not having source code access to all the software you use. Bugs, problems or missing features in your own work ca…| Larst Of Us
The ESP32 is very capable but even the most capable of devices can get overwhelmed when using it extensively, so how can we find out what is taking so long or which function should we optimize to make things even better?| Dror Gluska
In this new series of posts, I will share walkthroughs of debugging sessions I had to do at work to solve real-life problems, in the hope that both the process and the lessons learned will be useful to others working in the Scala ecosystem. The probl...| Pierre Ricadat's Tech Blog
Introduction There are many time-based statistical profilers around (like VMProf or py-spy just to name a few). They allow the user to pick a trade-off between profiling precision and runtime overhead| PyPy
There has been some recent chat once again on the Wikibase telegram groups around importing, and the best approach to import a large amount of data into a Wikibase instance. 2 years ago I started a little GitHub project aimed at profiling the speed of loading using the action API, and various settings, DB versions…| addshore
Introduction There are many time-based statistical profilers around (like VMProf or py-spy just to name a few). They allow the user to pick a trade-off between profiling precision and runtime overhead. On the other hand there are memory profilers such as memray. They can be handy for finding leaks or for discovering functions that allocate a lot of memory. Memory profilers typlically save every single allocation a program does. This results in precise profiling, but larger overhead. In this p...| PyPy
A while ago I came across an interesting and very readable paper titled “COZ Finding Code that Counts with Causal Profiling” that was presented at SOSP 2015 (and was recipient of a Best Paper Award). This post is my attempt to provide an introduction to Causal Profiling for anyone who doesn’t want to go through the entire paper.| Performance is a Feature!
Segger SystemView and Percepio Tracealyzer have been the de-facto standard for visualizing embedded system behavior for the past few years, While Segger has been able to only visualize a single core, Percepio pricing is prohibitive to the hobbyist, last but not least is the toem Impulse which requires eclipse and some people have an aversion to that as well.| Dror Gluska
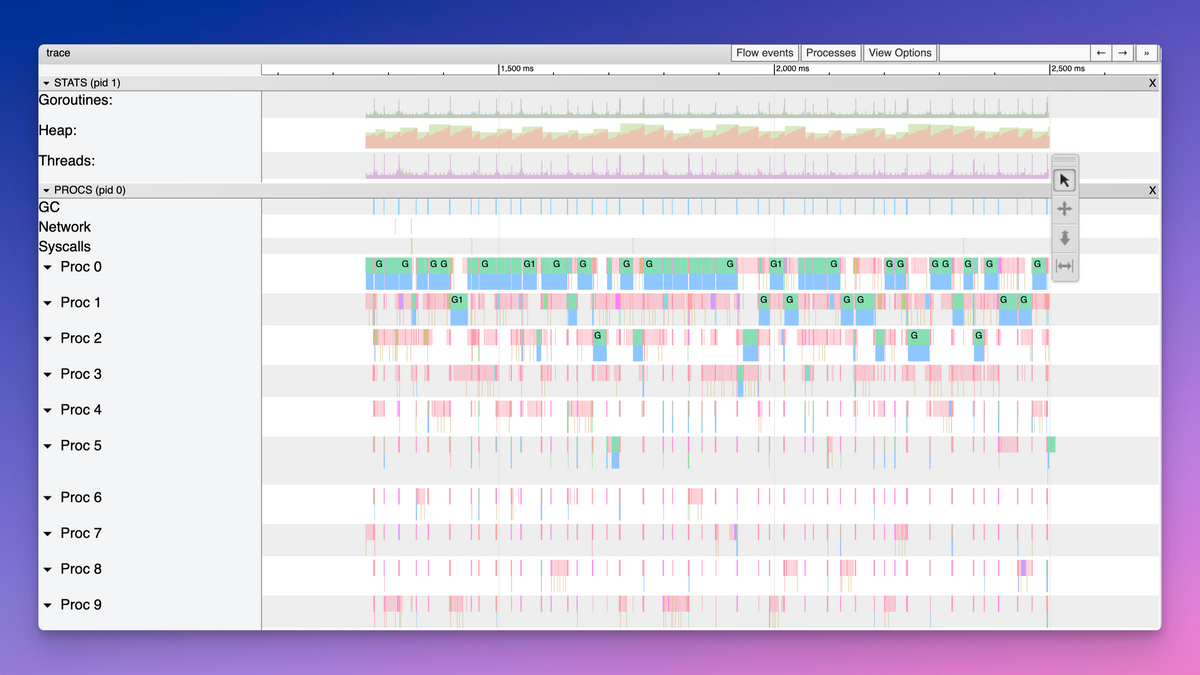
How fast can you Go? Today I will explore how profiling tools can help us make a Go program run faster. If you expected an inspirational think piece on personal development, well, perhaps another day :-) Like many Pythonistas, I have been frustrated by Python’s relatively slow runtime. The promise of fast execution is a key reason for learning Go. The other key reason would be goroutines, but we won’t encounter them today. So I set out to read The Go Programming Language. Of course, there...| Fractal Ideas
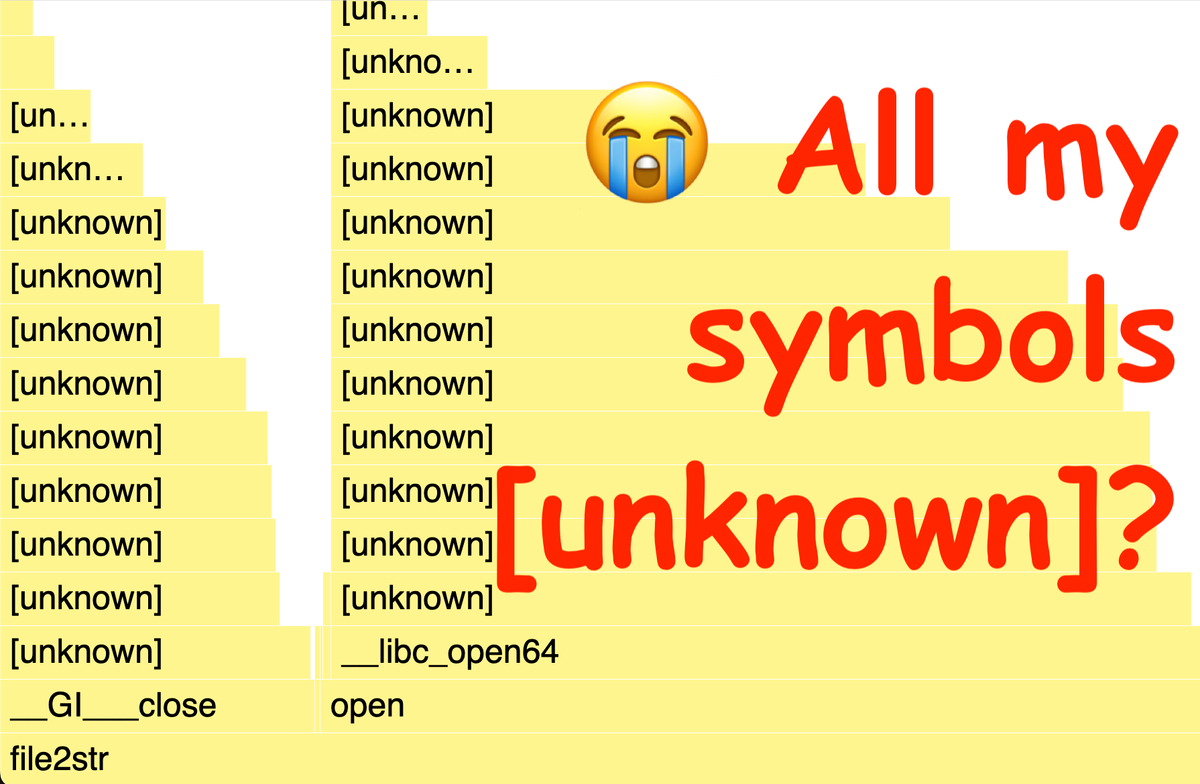
How to take performance profiles of Ubuntu/Debian apps (the ones from apt-get) so you can see full stack symbols, even in the kernel, without root.| Mark Hansen's Blog
Those who have read some of my previous performance-focused blog posts will know that I use the dotMemory product from JetBrains when working on code optimisations. In this post, I want to demonstrate a really handy, but somewhat underutilised feature, to automate the collection of snapshots in a repeatable way. I use these steps quite […] The post Automating Memory Profiling with the JetBrains dotMemory Profiler API appeared first on Steve Gordon - Code with Steve. --- Automating Memory Pr...| Steve Gordon – Code with Steve
Sometimes it just happens. You have a bloated Java application at your hand and it does not perform well. You may have built this application yourself or just got it as it is now. It doesn't matter, thing is - you do not have a slightest idea what is wrong here.| Alexey Ragozin
In part 1, we discussed the design of time measurement within the Firefox Performance Monitor. Despite the intuition, the Performance Monitor had neither the same set of objectives as the Gecko Profiler, nor the same set of constraints, and we ended up picking a design that was not a sampling profiler. In particular, instead of […]| Il y a du thé renversé au bord de la table
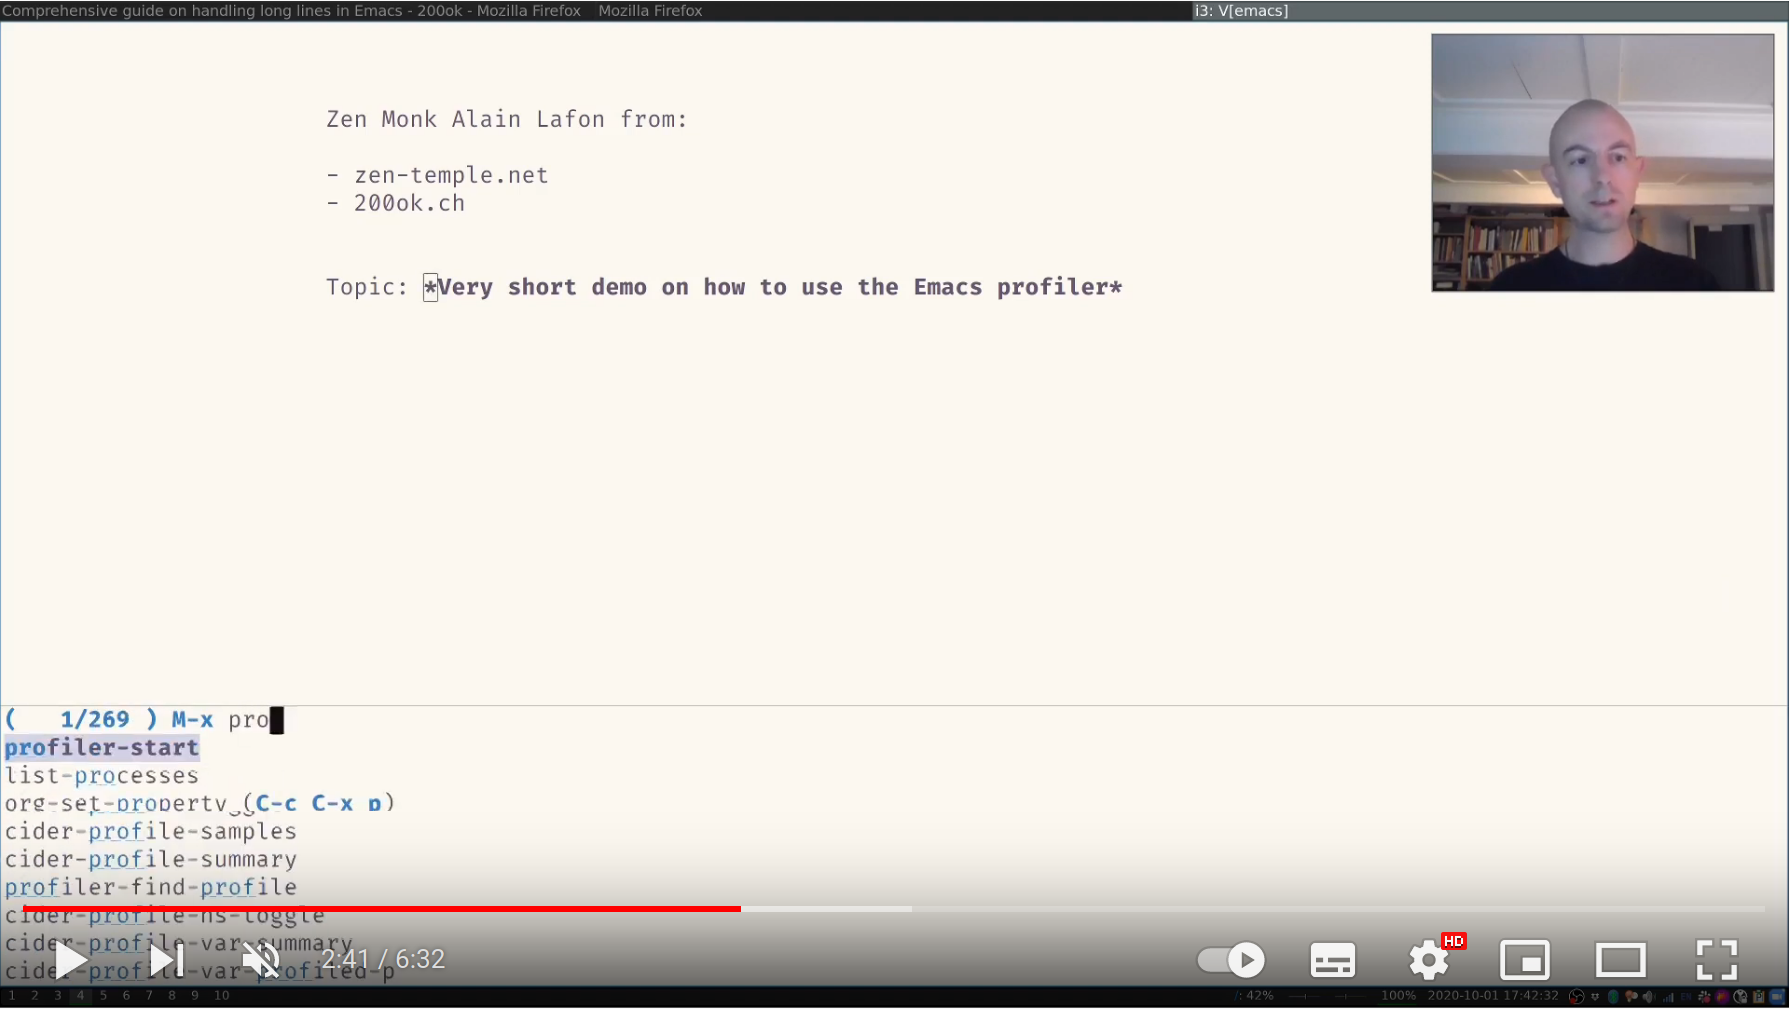
Whenever Emacs feels slow, or you want to check out just how big the impact of something is RAM or CPU wise, then you can use the built-in Emacs profiler. This is a very basic introduction on how to get started with it.| 200ok.ch
How do you almost 2x your application’s performance with zero code changes? Read on to find out! This is a repost of a blog I originally wrote on prodfiler.com on October 4th 2021. Prodfiler was acquired by Elastic is is now the Elastic Universal Profiler. In this post I will walk through how we can […]| Sean Heelan's Blog
Raw pointers in C/C++ open up entire classes of error that are practically unimaginable in higher level languages. So why does anybody use them at all? Unfortunately, it’s impossible to write a profiler without getting close to some of the sharp edges of unsafe memory. The async-profiler code base contains a lot of low level tricks, and it’s worth studying how some of them work.| Richard Startin’s Blog
Sampling profilers periodically fetch the stacktrace of the application under observation. Historically, this has been from within the process, in-band, usin...| hondu.co
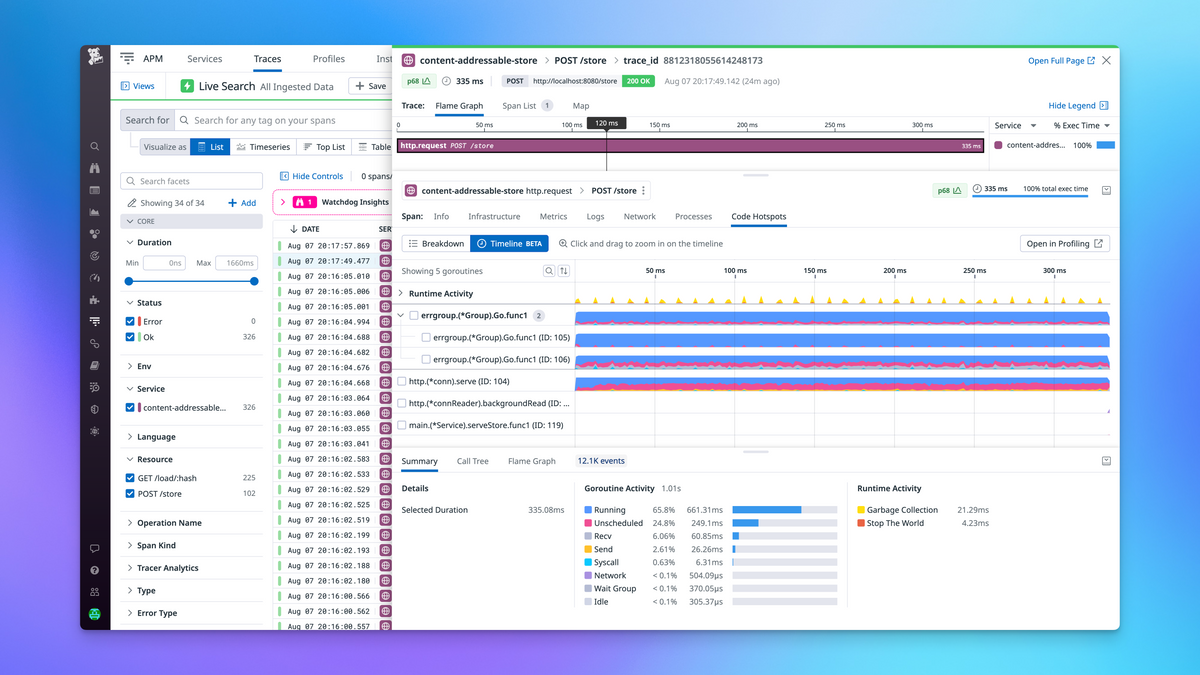
It can be hard to figure out why response times are high in Java applications. In my experience, people either apply a process of elimination to a set of recent commits, or might sometimes use profiles of the system to explain changes in metrics. Making guesses about recent commits can be frustrating for a number of reasons, but mostly because even if you pinpoint the causal change, you still might not know why it was a bad change and are left in limbo. In theory, using a profiler makes root ...| Richard Startin’s Blog
When you open a profile in JMC, it normally takes a few seconds, but there are some profiles that JMC struggles to load. This happens when a profile contains events which violate an assumption made in JMC’s parser: events on the same thread are almost always disjoint in their durations. When JMC parses a JFR file, it splits the events of the same type emitted on the same thread into lanes so that events within a lane are disjoint. JMC can handle overlapping events, but assumes this essentia...| Richard Startin’s Blog
Learn about the upcoming go1.21 performance improvements that reduce the overhead of execution tracing from up to 20% to less than 1% for most applications.| Felix Geisendörfer
On this Valentine's Day Weekend I share the heartbreak that caused my fear of commitment to the 1st CPU Core of any socket (not just core 0).| JabPerf Corp
Few things hinder our productivity like an interruption. The same is true for applications. How can we identify sources of system interrupts?| JabPerf Corp