Looking to move on from InfluxDB? We'll look at the top 5 choices. Whether you're in finance, observability, or IoT, we'll help you find the right solution for the job.| QuestDB Blog
Example code included! Easily migrate from InfluxDB to QuestDB for improved performance, reduced costs and better ease of use with the newly introduced InfluxDB Line Protocol over HTTP. ILP over HTTP enables a seamless, high-performance InfluxDB replacement for your time-series database needs.| QuestDB Blog
近年来,时序数据的增长是 Data Infra 领域一个不容忽视的趋势。这主要得益于万物互联带来的自然时序数据增长,以及软件应用上云和自身复杂化后的可观测性需求。前者可以认为是对联网设备的可观测性,而可观测性主要就建构在设备或应用不断上报的指标和日志等时序数据上。 分析时序数据的演变史几乎是大数据分析演变史的复现,即一开始都是把数据存在关系型数据...| 夜天之书
Azure IoT Operations is the Edge platform for Azure IoT, part of Azure IoT vNext (part of the stack based on the MQTT support for Azure EventGrid Namespaces and Microsoft Fabric Real-Time Intellige…| Sander van de Velde
We recently had solar installed and I wanted to be able to pull stats from the inverter down into InfluxDB so that I could use the metrics to monitor system efficiency as well as for various bits of a| www.bentasker.co.uk
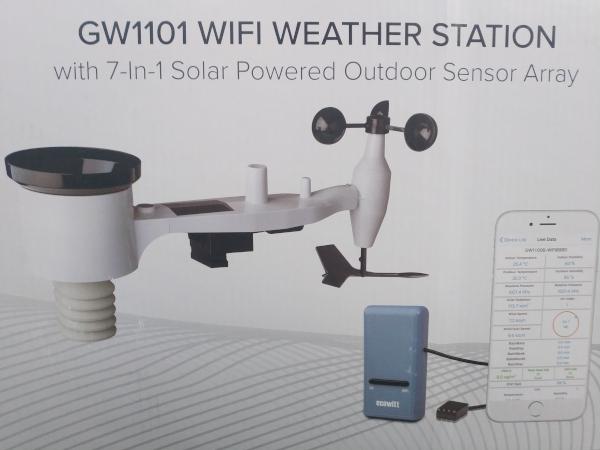
I've put a weather station, but wanted to collect the data locally rather than relying on the supplier's app. As well as writing into InfluxDB, I've been able to implement writing onward to the Met Of| www.bentasker.co.uk
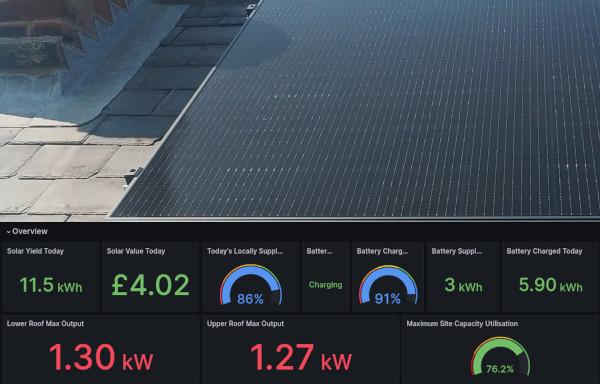
We added a solar install to our house earlier in the year, including a 6kWh battery for storage. I've been working on a dashboard to analyse our path towards break-even, and was quite surprised to see| www.bentasker.co.uk
Last month I found that the break-even period of our solar battery measures in decades, far longer than its useful life. Although it will probably never be possible to optimise enough to correct that,| www.bentasker.co.uk
I've run kubernetes at home for quite some time, but because I was only using it as a sandpit didn't bother setting up monitoring. I've started using it for more productiony stuff though, so I decided| www.bentasker.co.uk
Grafana is a great tool for visualizing data. In this tutorial I’ll be putting annotations, or comments on points of interest overlayed on top of graph panels.| Chris Bergerons Tech Blog
I made a Grafana Dashboard for my Plex system at home. I feed various system telemetry into an influx database as the data source and Plex-Data-Collector for inserting the data from plex. Additionally, I wrote a python script for injecting logs from NZBGet into mysql. I then use Grafana to display the graphs. I really love Grafana and I’ve created several dashboards:| Chris Bergerons Tech Blog
Using Grafana with pfSense Update: 2018/09/13 pfSense has a plugin for telegraf which can be installed from the gui. I recommend this method rather than what I figured out below. I’m leaving these notes for manual installation reference. 2017/12/09 I put this guide together using information from various other blogs. This is current as of December 2017 and using pfSense 2.4.2. For this tutorial, you’ll need your IP or hostname of your influxdb data source and your username and password. T...| Chris Bergerons Tech Blog
Pihole + Grafana + InfluxDB Dashboard I wanted to add the metrics from my ad-blocker, the great Pihole to my executive dashboard. To create the dashboard I used Grafana to display the graphs and InfluxDB a the time-series backend database. I use a simple python script to get the metrics from pihole and record them in influxdb. Grafana makes it easy to render them into a user friendly dashboard. Installing Grafana and Influxdb is beyond the scope of this blog post but here is the scipt that I ...| Chris Bergerons Tech Blog
Grafana + InfluxDB + scripts = Awesome I have many interests and some of them have metrics that are useful or fun to watch. For example, I have investment in Bitcoin so it’s nice to be able to keep an eye on it periodically. I decided to create a graphical “at a glance” dashboard for myself. I chose Grafana as the user interface / front end and InfluxDB a the time-series backend database to store the metrics. I use various scripts and applets to populate the data into Influx and Grafana...| Chris Bergerons Tech Blog