We are debugging one issue with memory usage in Kubernetes Pods, and decided to look at the memory and number of processes on the nodes. The problem is that a Kubernetes Pod with Livekit usually consumes about 2 gigabytes of memory, but sometimes there are spikes of up to 10-11 gigabytes, which causes the Pod… Read More » The post Kubernetes: monitoring processes with process-exporter first appeared on RTFM: Linux, DevOps, and system administration.| RTFM: Linux, DevOps, and system administration
Дебажимо одну проблему з використанням пам’яті в Kubernetes Pods, і вирішили подивитись на пам’ять і кількість процесів на нодах. Сама проблема полягає в тому, що зазвичай Kubernetes Pod з Livekit споживає близько 2 гігабайт пам’яті, але іноді бувають спайки до 10-11 гіг, через що под вбиває...| RTFM: Linux, DevOps та системне адміністрування
Looking to move on from InfluxDB? We'll look at the top 5 choices. Whether you're in finance, observability, or IoT, we'll help you find the right solution for the job.| QuestDB Blog
Understand how sum_over_time() aggregates metrics in Prometheus, handles gaps, and why step size and staleness can affect accuracy.| Last9 Blog: Exploring the Realm of Monitoring, Observability, and Reliability...
Prometheus Node Exporter is a tried and tested method to make hardware and OS metrics available as a scrapable endpoint to Prometheus server (or other downstream services/TSDB that support the same format). With OpenTelemetry (OTel) gaining more traction/recognition, I learnt that the OTel Collector's Host Metrics Receiver can also be used to expose host level metrics. However, I wondered if it would be able to make parity in terms of the type/number of metrics it is able to expose to downstr...| Technical Scratchpad
Like many users of Prometheus, at work we use labels with AlertManager's routing to make sure the right people get paged when something goes wrong. Prometheus allows you to provide their labels via a number of sources (if I missed any, please reach out and let me know!):| hoelz.ro
Explore the Prometheus design and see which components consume the most resources. Find out why it happens, what affects it, and how you can optimize your setups to get the best performance in monitoring.| blog.palark.com
Hi. This month (and henceforward), the literary updates and the Eikas message will be at societyofepicurus.com. Please check our Twentieth message for the new paperback edition of our Epitome: Epicurean Writings, and also some notes from the discussion we had … Continue reading →| The Autarkist
Introduction Monitoring and alerting are crucial aspects of managing Kubernetes clusters. Prometheus is a powerful open-source monitoring and alerting toolkit that is widely used in Kubernetes environments. This guide explains how to successfully install Prometheus on MicroK8s and solve the common TLS certificate issue that may arise during the process. Prerequisites A working MicroK8s installation. […]| Collabnix
At work, we have a Prometheus metric from our build system named autobuild_build_timestamp that exports the timestamp for the latest build for a given application and Git branch. The process that exports this is stateless, so if it restarts or a new version of it is deployed, we're out of luck if we want to do something like build a dashboard to show the latest builds. One thing we can do is use a range query, but we can also make use of Prometheus' recording rules to provide a nice abstracti...| hoelz.ro
Have you heard the story of the angry deity and the flood? The one where… The post Sounds Familiar: Deucalion and the Greek Flood Myth appeared first on Historic Mysteries.| Historic Mysteries
We are thrilled to announce the release of Stalwart Mail Server version 0.9.1, which comes packed with significant enhancements to our telemetry capabilities. This release marks a major milestone in our ongoing efforts to provide robust and efficient monitoring and logging solutions, ensuring our users can achieve optimal server performance and reliability.| stalw.art
Introduction Containerd is a popular container runtime used in Kubernetes. It serves as the underlying engine responsible for managing low-level tasks, such as creating and managing container sandboxes, starting processes within those sandboxes, and handling image pulling. As Containerd plays a crucial role in the smooth operation of containerized applications, monitoring its performance and health […] The post How to monitor Containerd appeared first on Povilas Versockas.| Povilas Versockas
Introduction PrometheusMissingRuleEvaluations is an alert coming from Prometheus Monitoring Mixin. Monitoring Mixins are a bundle of Grafana Dashboards, Prometheus Alerts, and Recording rules. Check out my Getting Started With Monitoring Mixins blog post to learn more about Monitoring Mixins. You typically get this alert automatically if you use kube-prometheus-stack or kube-prometheus solutions. Typically, the configuration for the […] The post How to fix Prometheus Missing Rule Evaluati...| Povilas Versockas
Introduction Kubelet is a Node daemon that registers itself with the Kubernetes API Server and manages Pods for that Node. It’s important to know that, Kubelet works in terms of Pods rather than Deployments or Containers. It watches the Pods assigned to it and ensures they are healthy and running. There are many things Kubelet […] The post How to monitor Kubelet appeared first on Povilas Versockas.| Povilas Versockas
What are Kubernetes Controllers? Kubernetes Controllers are designed to manage the lifecycle of certain resources, like Deployments and Services. They are responsible for keeping the cluster’s desired state in sync with its actual state. For example, the following code snippet shows a simple Controller loop: Note: this example is taken from the following documentation. So the […] The post A Technique To Monitor Kubernetes Controller Latency appeared first on Povilas Versockas.| Povilas Versockas
Introduction The Four Golden Signals and the RED method are fantastic for monitoring user-facing request-driven services. But how do you apply The Four Golden Signals to non-request-driven services, such as – Kubernetes Controllers? What are Kubernetes Controllers? Kubernetes Controllers are designed to manage the lifecycle of certain resources, like Deployments and Services. They are responsible for […] The post How to monitor Kubernetes Controllers appeared first on Povilas Versockas.| Povilas Versockas
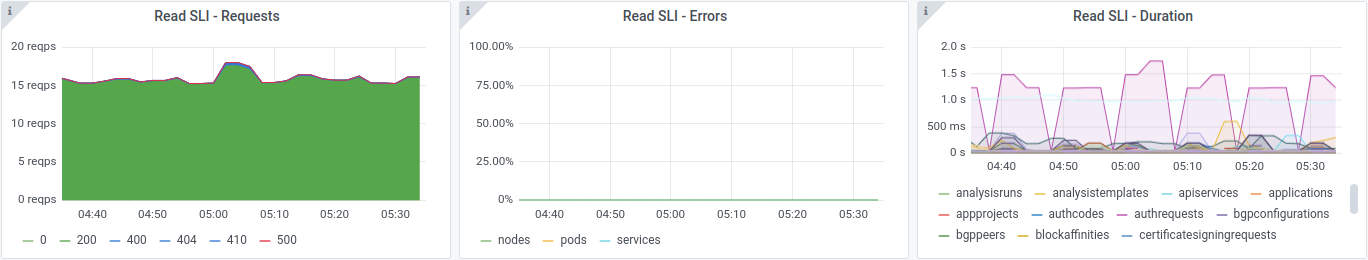
This is a complete guide to Kubernetes API Server SLO Alerts. In this new guide, you’ll learn: Kubernetes official Service Level Objectives (SLOs). What are Error Budgets? How to turn Error Budgets into alerts? What are Multiwindow, Multi-Burn-Rate alerts? What is this KubeAPIErrorBudget alert? Mixin’s Kubernetes API Server SLO alerts. Lots more. Kubernetes Service Level […]| Povilas Versockas
HorizontalPodAutoscaler (HPA) allow you to dynamically scale the replica count of your Deployment based on basic CPU/memory resource metrics from the metrics-server. If you want scaling based on more advanced scenarios and you are already using the Prometheus stack, the prometheus-adapter provides this enhancement. The prometheus-adapter takes basic Prometheus metrics, and then synthesizes custom API ... Kubernetes: HorizontalPodAutoscaler evaluation based on Prometheus metric| fabianlee.org
A few months ago, I was pairing with my coworker Graham on a Grafana dashboard, and we ran into a pitfall I thought it'd be nice to share. We were trying to create a dashboard that would show how many changes happened to a database table between points on the graph, and we were getting some mysterious results!| hoelz.ro
When it comes to monitoring tools in the last while, Prometheus is definitely hard to miss. It has quickly risen to be top of the class, with overwhelming adoption from the community and integrations with all the major pieces of the Cloud Native puzzle. Throughout this blog series, we will be learning the basics of Prometheus and how Prometheus fits within a service-oriented architecture. This first post the series will cover the main concepts used in Prometheus: metrics and labels.| Pierre Vincent
Evolution of Alerting and Incident Management: Navigating Chaos in a Remote Work Era. From Desk Huddles to Digital Collaboration and how we adapted.| karlstoney.com
For a while, I have been looking for a smokeping alternative for latency monitoring from different servers spread around. While smokeping has survived well over time, in 2023 it feels like an outdated package, with limited options, lacks federation etc. This post from Karan Sharma / Zerodha on “Monitoring my home network” was exciting. His setup included a telegraph agent on a local server, Prometheus to scrap data and Grafana to draw latency data. I explored doing the same but in a distr...| Personal blog of Anurag Bhatia
In this article, we will be looking into how we can monitor our Spring Boot application using Grafana. We would be looking into the whole setup and create a simple dashboard to view some metrics.| RefactorFirst
Prometheus est une solution de supervision créée par Soundcloud en 2012 et open-sourcée en 2015. C'est un incontournable qui se démarque via l'intégration à de nombreux services tiers non supportés nativement.| Une tasse de café
Tonight I was introduced to a Deluge exporter for Prometheus so I figured I’d whip up a quick dashboard for visualizing the metrics. Deluge Dashboard is a very simple way to display Deluge torrent metrics. It uses the deluge exporter to populate a Prometheus data source. The panels in this dashboard can be copied into more comprehensive dashboards for a single pane of glass view of your network transfers or it can be used as a standalone glanceboard. You can install the dashboard from the G...| Chris Bergerons Tech Blog
Showing Webcal Calendar Events in Grafana 2020-02-12, 02:00 en iCalendar Webcal Calendar Grafana Prometheus Python I'm running a Grafana at home, with a dashboard giving me an overview over my day. It contains information like public transport departures or the guest WiFi's password. But the most…| s3lph.me
Bringing Swiss Public Transport Departures to Grafana 2020-02-05, 02:26 de en SBB Public Transport Open Data Grafana Prometheus Update: The API endpoint used here has been deprecated, and a new endpoint is available. The updated script can be found on Gitlab. The Swiss Railways (SBB) provide a…| s3lph.me
SBB-Abfahrtszeiten in Grafana anzeigen 2020-02-05, 02:26 de en SBB Public Transport Open Data Grafana Prometheus Update: Der hier verwendete API-Endpunkt ist veraltet und wurde durch einen neuen Endpunkt ersetzt. Das aktualisierte Skript liegt auf Gitlab. Die SBB bieten unter…| s3lph.me
Monitoring Freifunk Nodes With Prometheus 2020-02-05, 01:36 de en Freifunk Monitoring Prometheus Updated 2020-03-07: We now collect the number of connected clients as well as whether the node is online. We recently installed a Freifunk node from Freifunk Dreiländereck (FF3L) in our hackerspace.…| s3lph.me
Freifunkknoten mit Prometheus überwachen 2020-02-05, 01:36 de en Freifunk Monitoring Prometheus Aktualisiert 2020-03-07: Wir erfassen inzwischen, zusätzlich zur Verfügbarkeit der Node, wieviele aktuell verbunden sind. Wir haben in unserem Hackerspace neulich einen Freifunk-Knoten von Freifunk…| s3lph.me
Last year I bought myself a ThinkPad X1 Yoga to use as my personal laptop - I've been pretty happy with it so far, but there's one problem I've run into that I've noticed a lot more lately - the laptop will sometimes wake up while the lid is closed, go back to sleep, and then repeat that whole process every few minutes. This can't be good for the hardware, so I dug into this issue and wanted to share my findings with anyone who's having the same problem running Linux on this laptop!| hoelz.ro
For monitoring the Arch Linux infrastructure we've moved on from Zabbix to Prometheus as it fits more into our infrastructure is code goal. This required some research into how we could achieve the same monitoring with Prometheus. Our Zabbix setup monitored Host, MySQL, Borg and Arch Linux related metrics. For …| Jelly's blog
This article will go over what Prometheus exporters are, how to properly find and utilize prebuilt exporters, and tips, examples, and considerations when building your own exporters.| last9.io