This blog posts shows how to utilize Large Language Model (LLM) «Function Calling» with the Raku package “LLM::Functions”, which supports high level LLM function calling via llm-synthes…| Raku for Prediction
An elaborate interactive network visualization showing how top contributors to a certain GitHub repository are connected to the (other) repos that they have made commits to| Visual Cinnamon
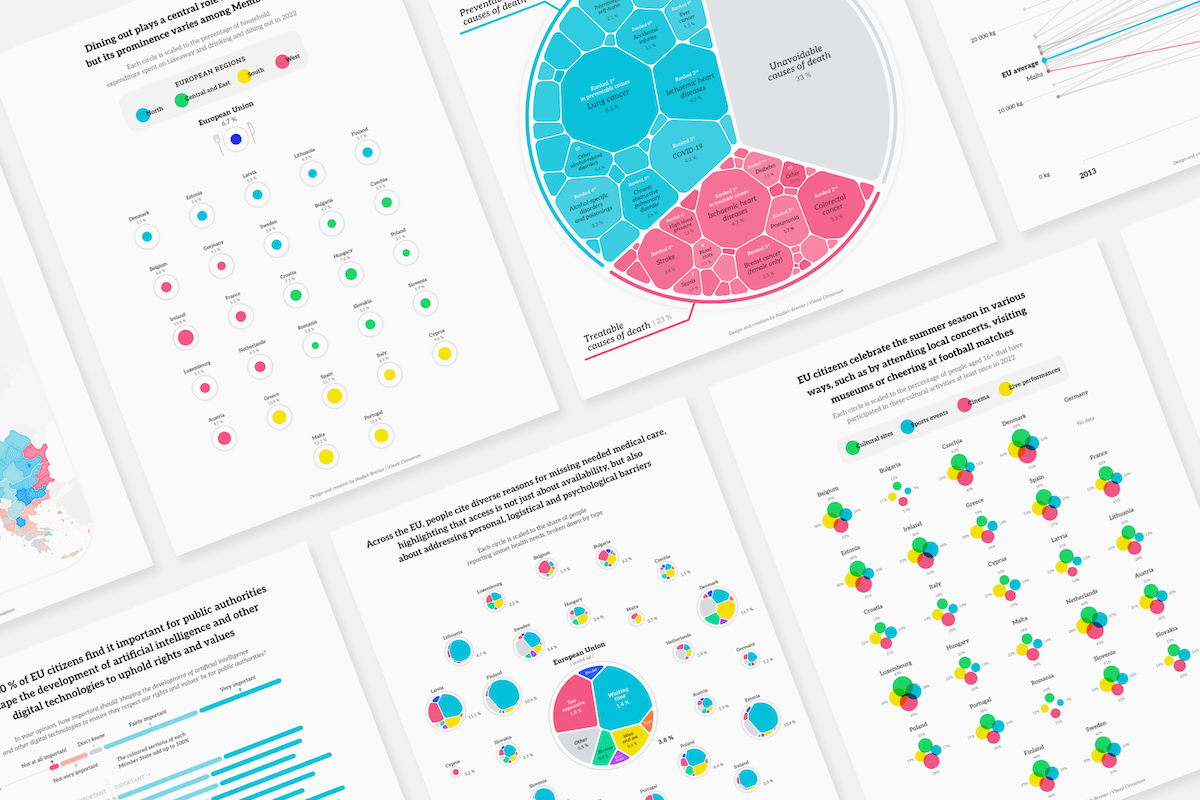
A collection of six pieces created for the Global Diet Quality Score (GDQS) project of Intake, visualizing the data of over 80,000 individuals| Visual Cinnamon
In this blog post, we explore some neat examples of graph computations using Raku. These examples are designed to be concise, straightforward, and compelling, showcasing the capabilities of Raku an…| Raku for Prediction
Creating an interactive data visualization for IHRA to show the historic holocaust sites, what threats they face, and what solutions could help| Visual Cinnamon
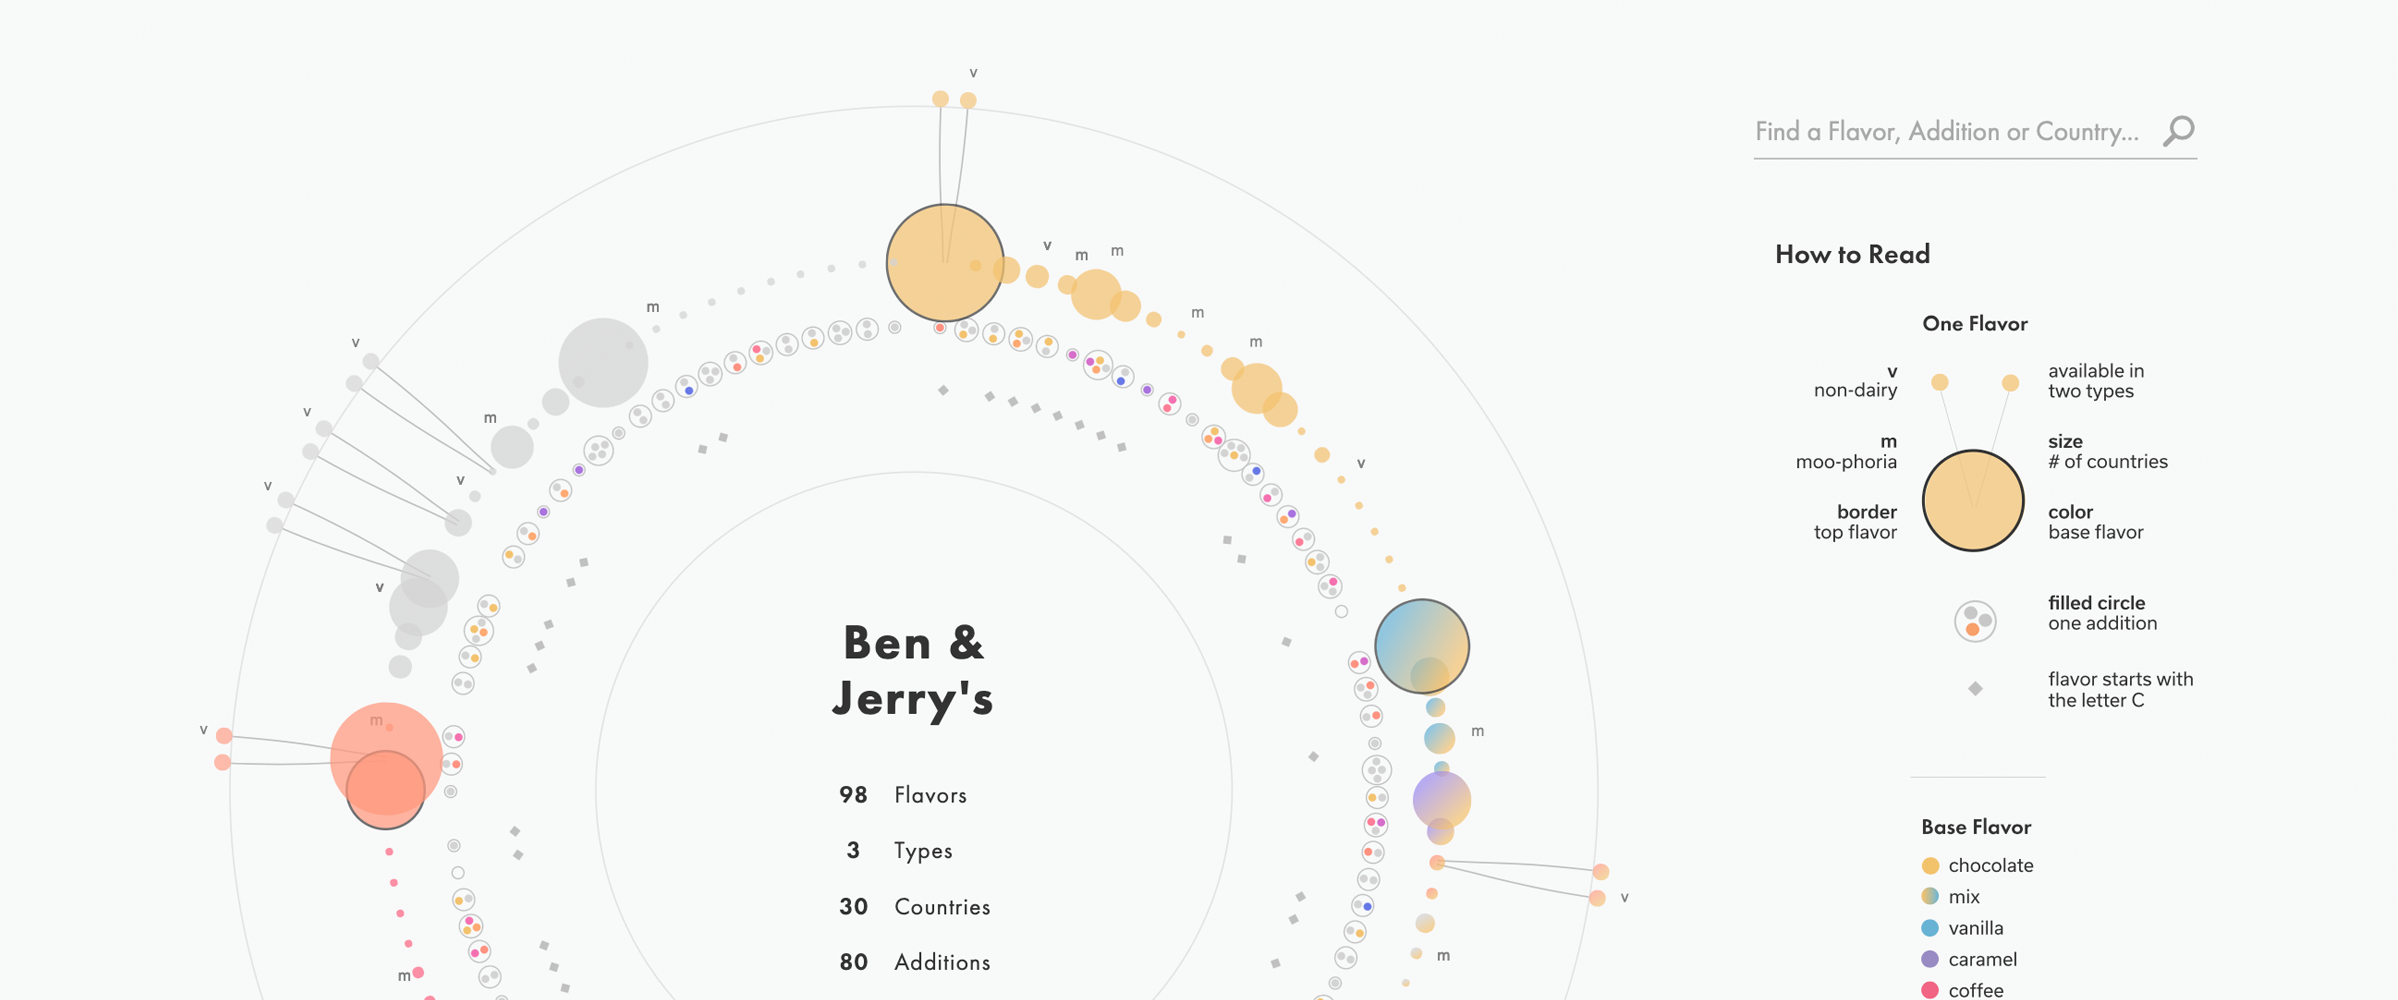
October 1, 2020 • Collaboration with Hesham Eissa As two frequent ice cream consumers in different countries, with different preferences, we were curious to know more about our favorite ice cream brand, Ben & Jerry's. We wanted to know how our options in the U.S. and U.K. differed and what we were missing out on by only buying our favorite flavors. To answer these questions we collected the necessary data, including consuming 35 pints of ice cream ourselves. This light hearted visualization...| Lindsey Poulter
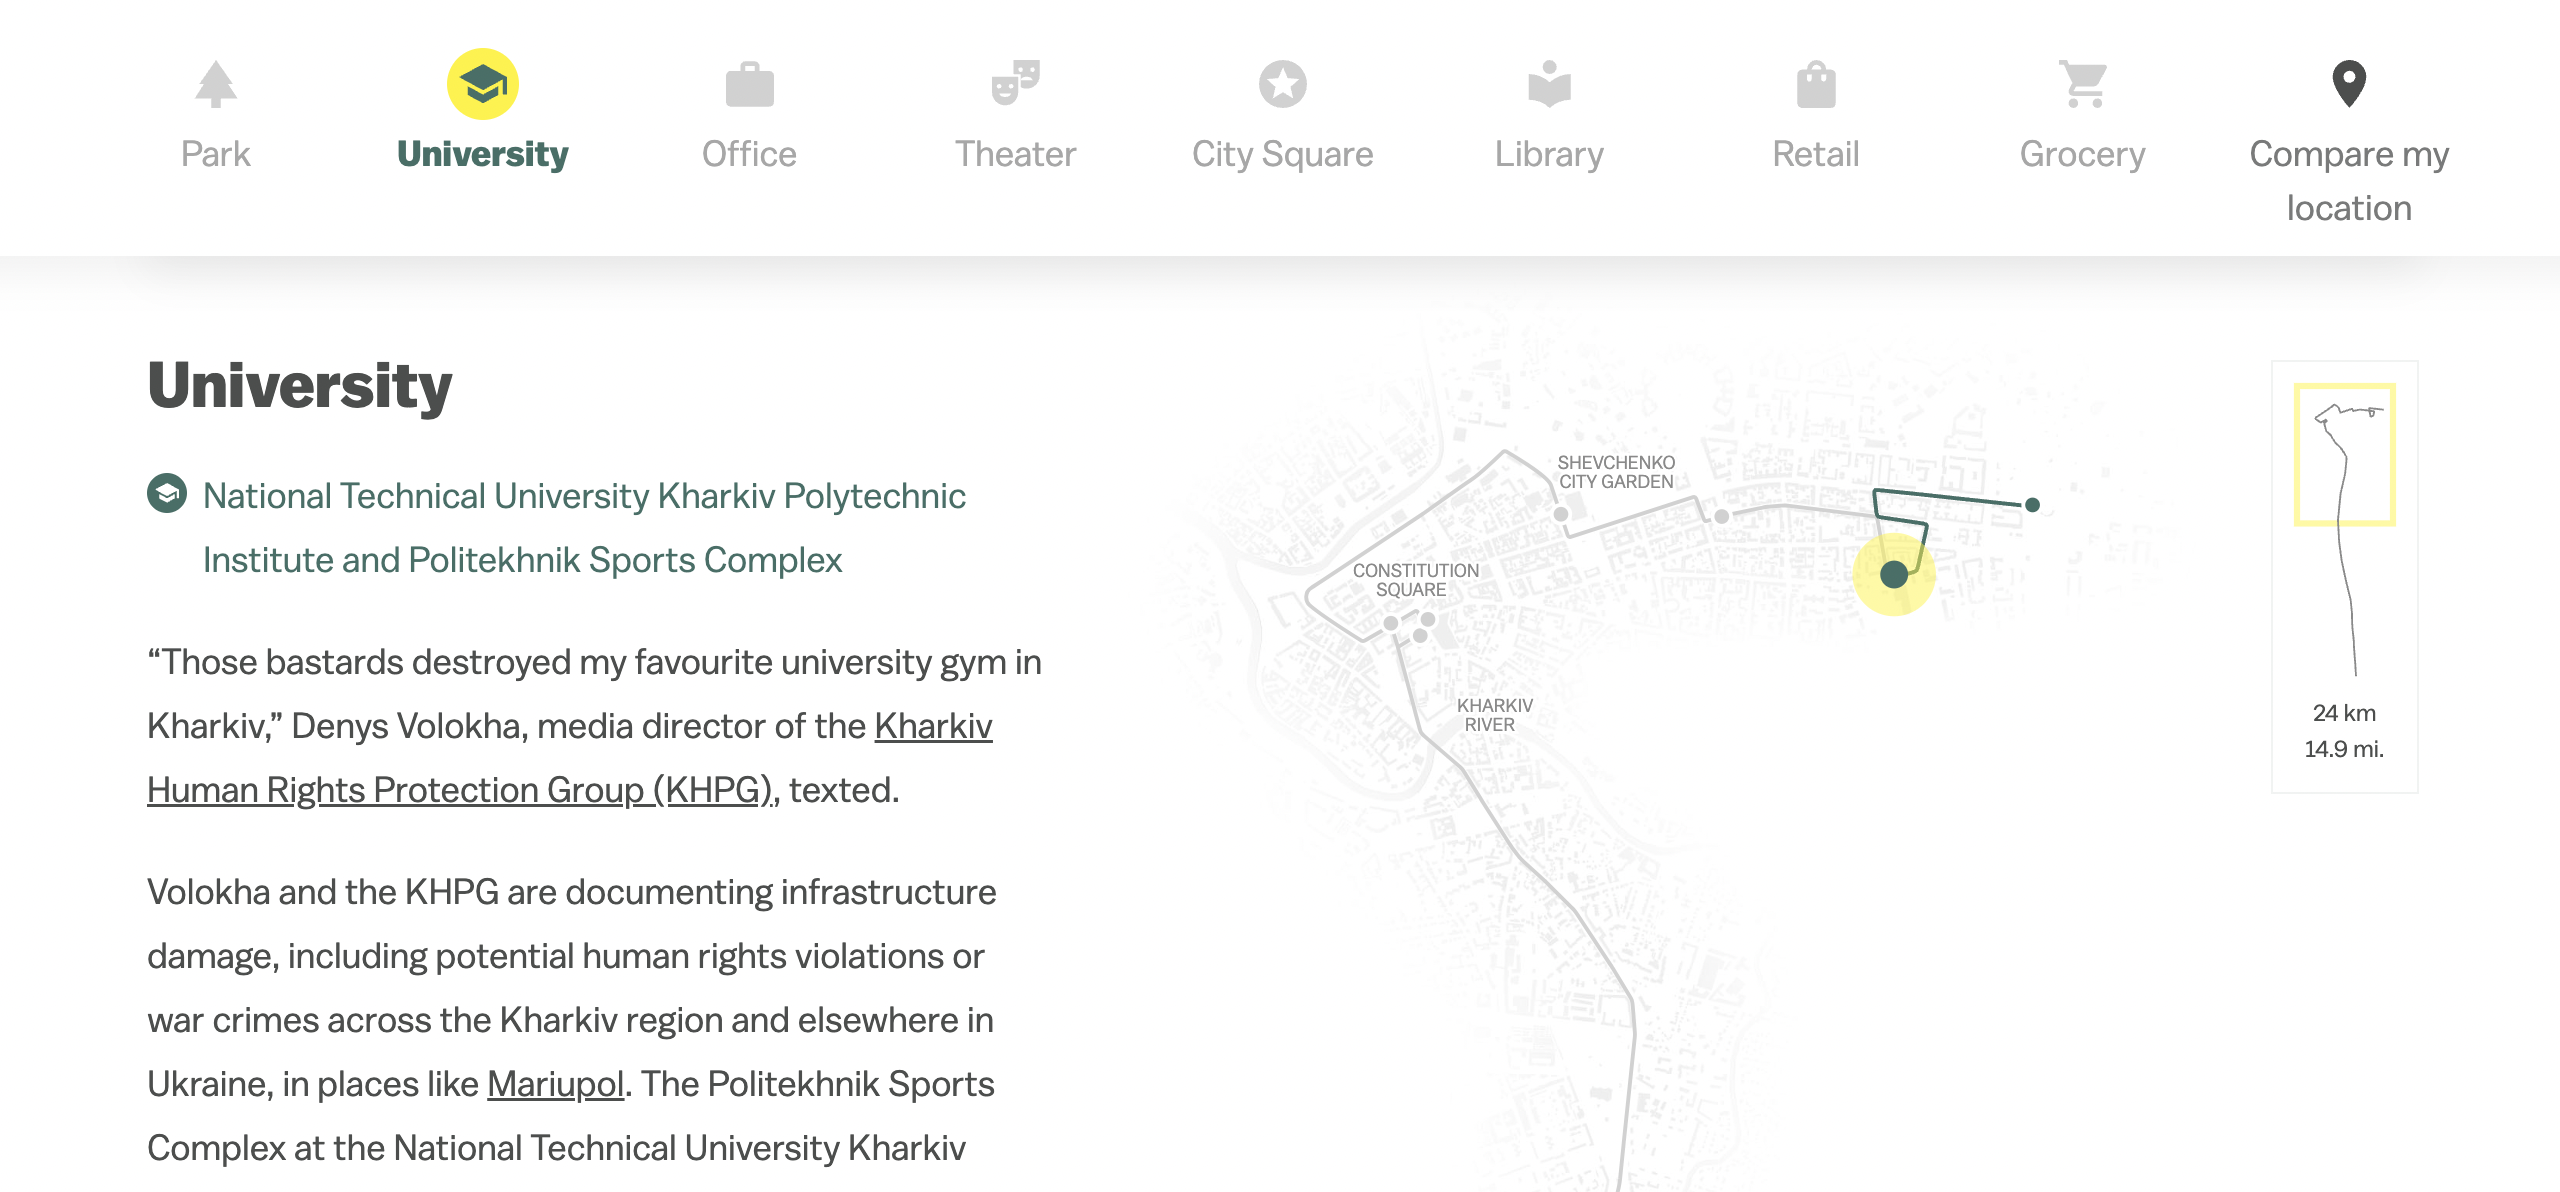
May 10, 2023 • In partnership with Polygraph Vox and Polygraph created the story and design. They engaged Hesham Eissa and me as collaborators to consult on the story as well as develop it from start to finish. From the piece: "[we] traced a route through Kharkiv, parts of which were heavily bombarded. It was an effort to document the before and after, not just of the physical space, but of how war has — and hasn't — transformed these places and the people tied to them" VIEW PROJECT| Lindsey Poulter
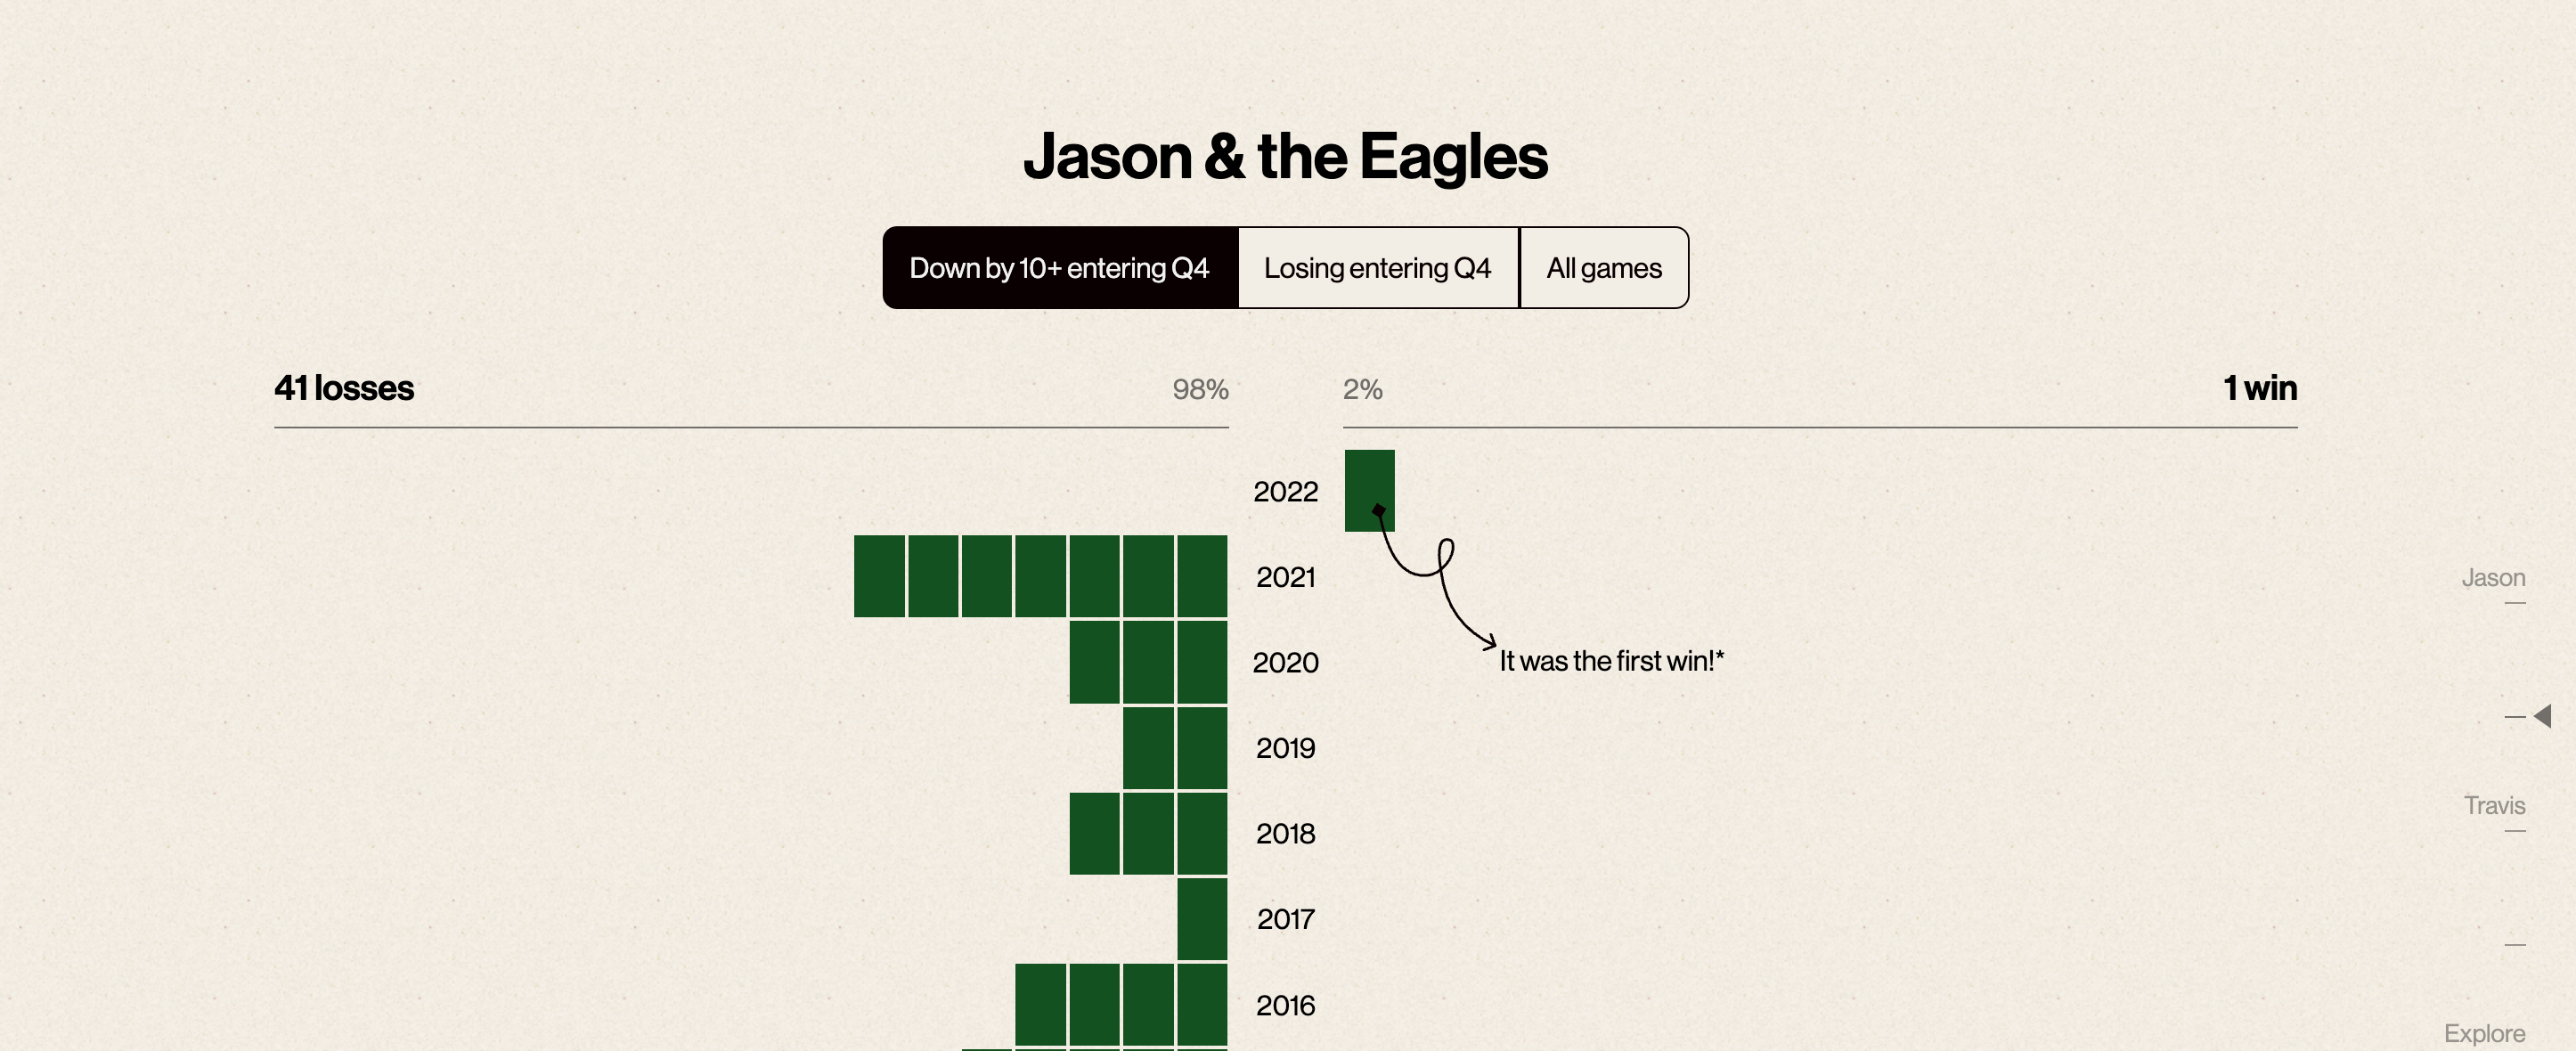
April 18, 2023 On the New Heights Podcast, Jason Kelce said "We just had our first double-digit comeback win in the 4th quarter in my entire career" to which his brother, Travis Kelce, said "Shut up that is not a real stat". This visualization analyzes all of the fourth quarter comebacks throughout both of their careers and determines if it is a real stat. Recognition: Jason Kelce said "This is well done Lindsey, and I must say, much more thorough research to reveal the actual numbers. Very n...| Lindsey Poulter
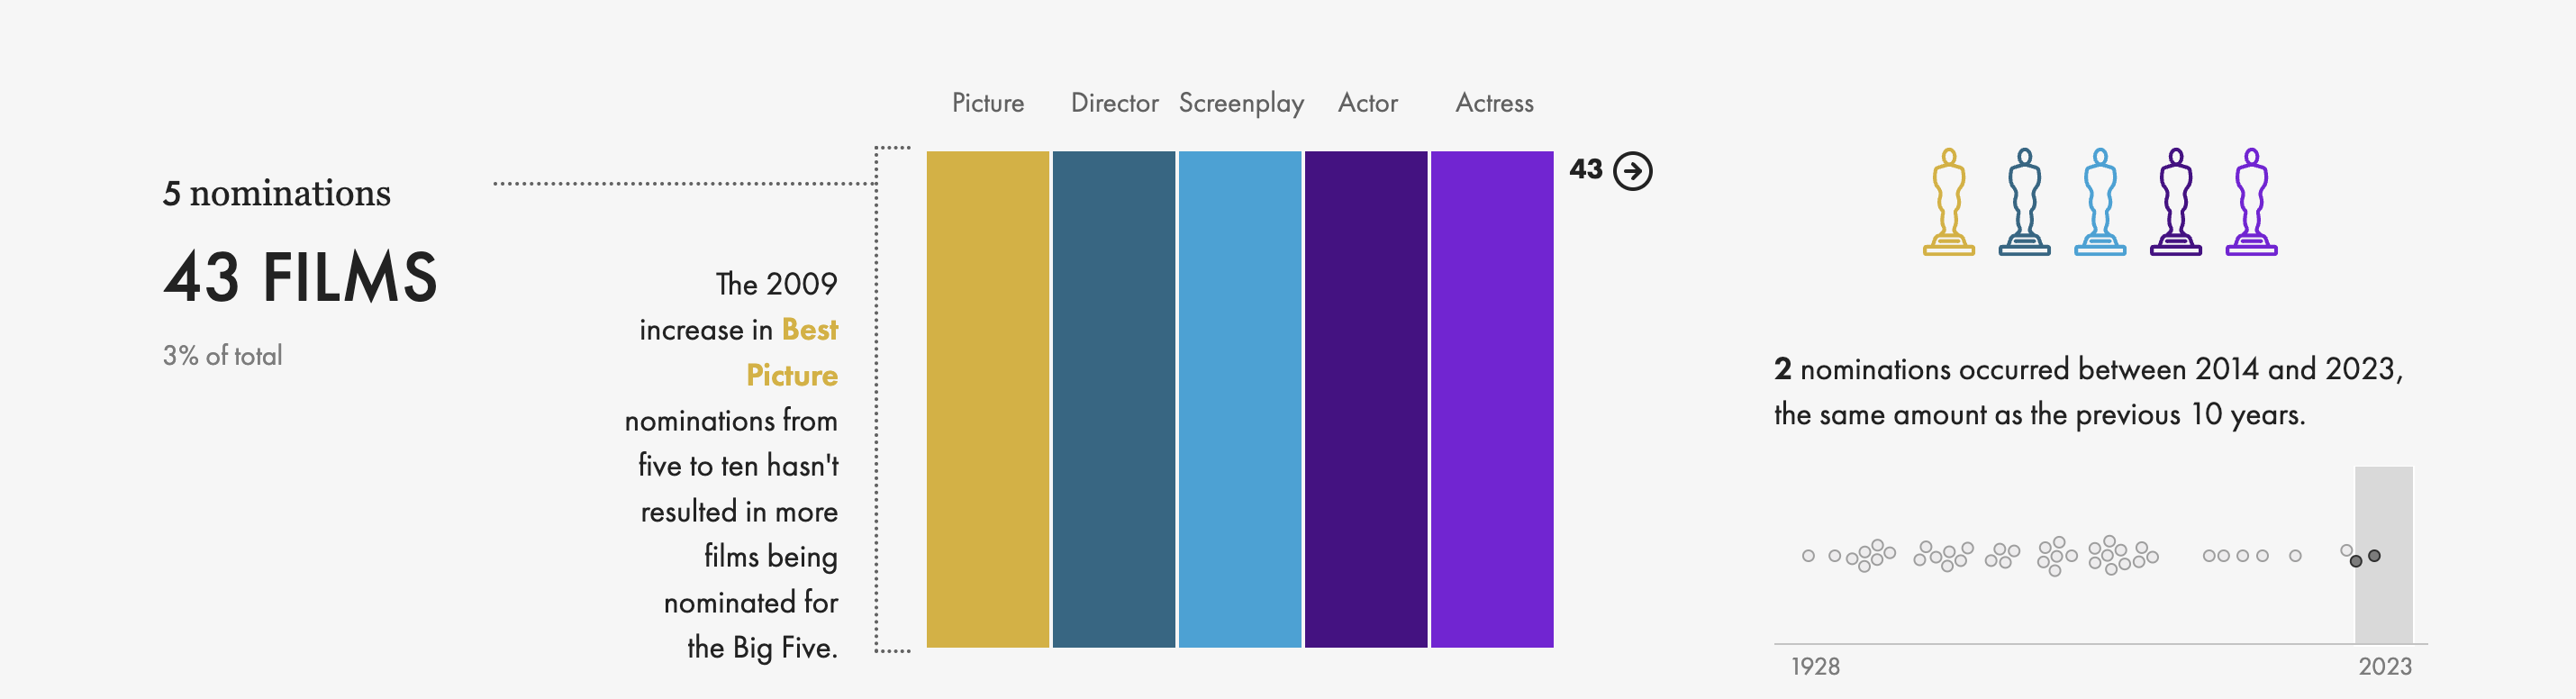
March 11, 2023 Dive into the history of the Big Five Oscar awards - Best Picture, Best Director, Best Screenplay, Best Actor, & Best Actress - and see the most frequent combinations. VIEW PROJECT| Lindsey Poulter
January 28, 2021 • Collaboration with Hesham Eissa It has become a challenge to keep track of the rapidly evolving international response to COVID-19, especially when it comes to travel restrictions and the daily changing regulations. This interactive app is designed to make it easier to visualize who is in lockdown, who has closed borders, which countries have outbound travel bans, recent travel related news, and more! VIEW PROJECT| Lindsey Poulter
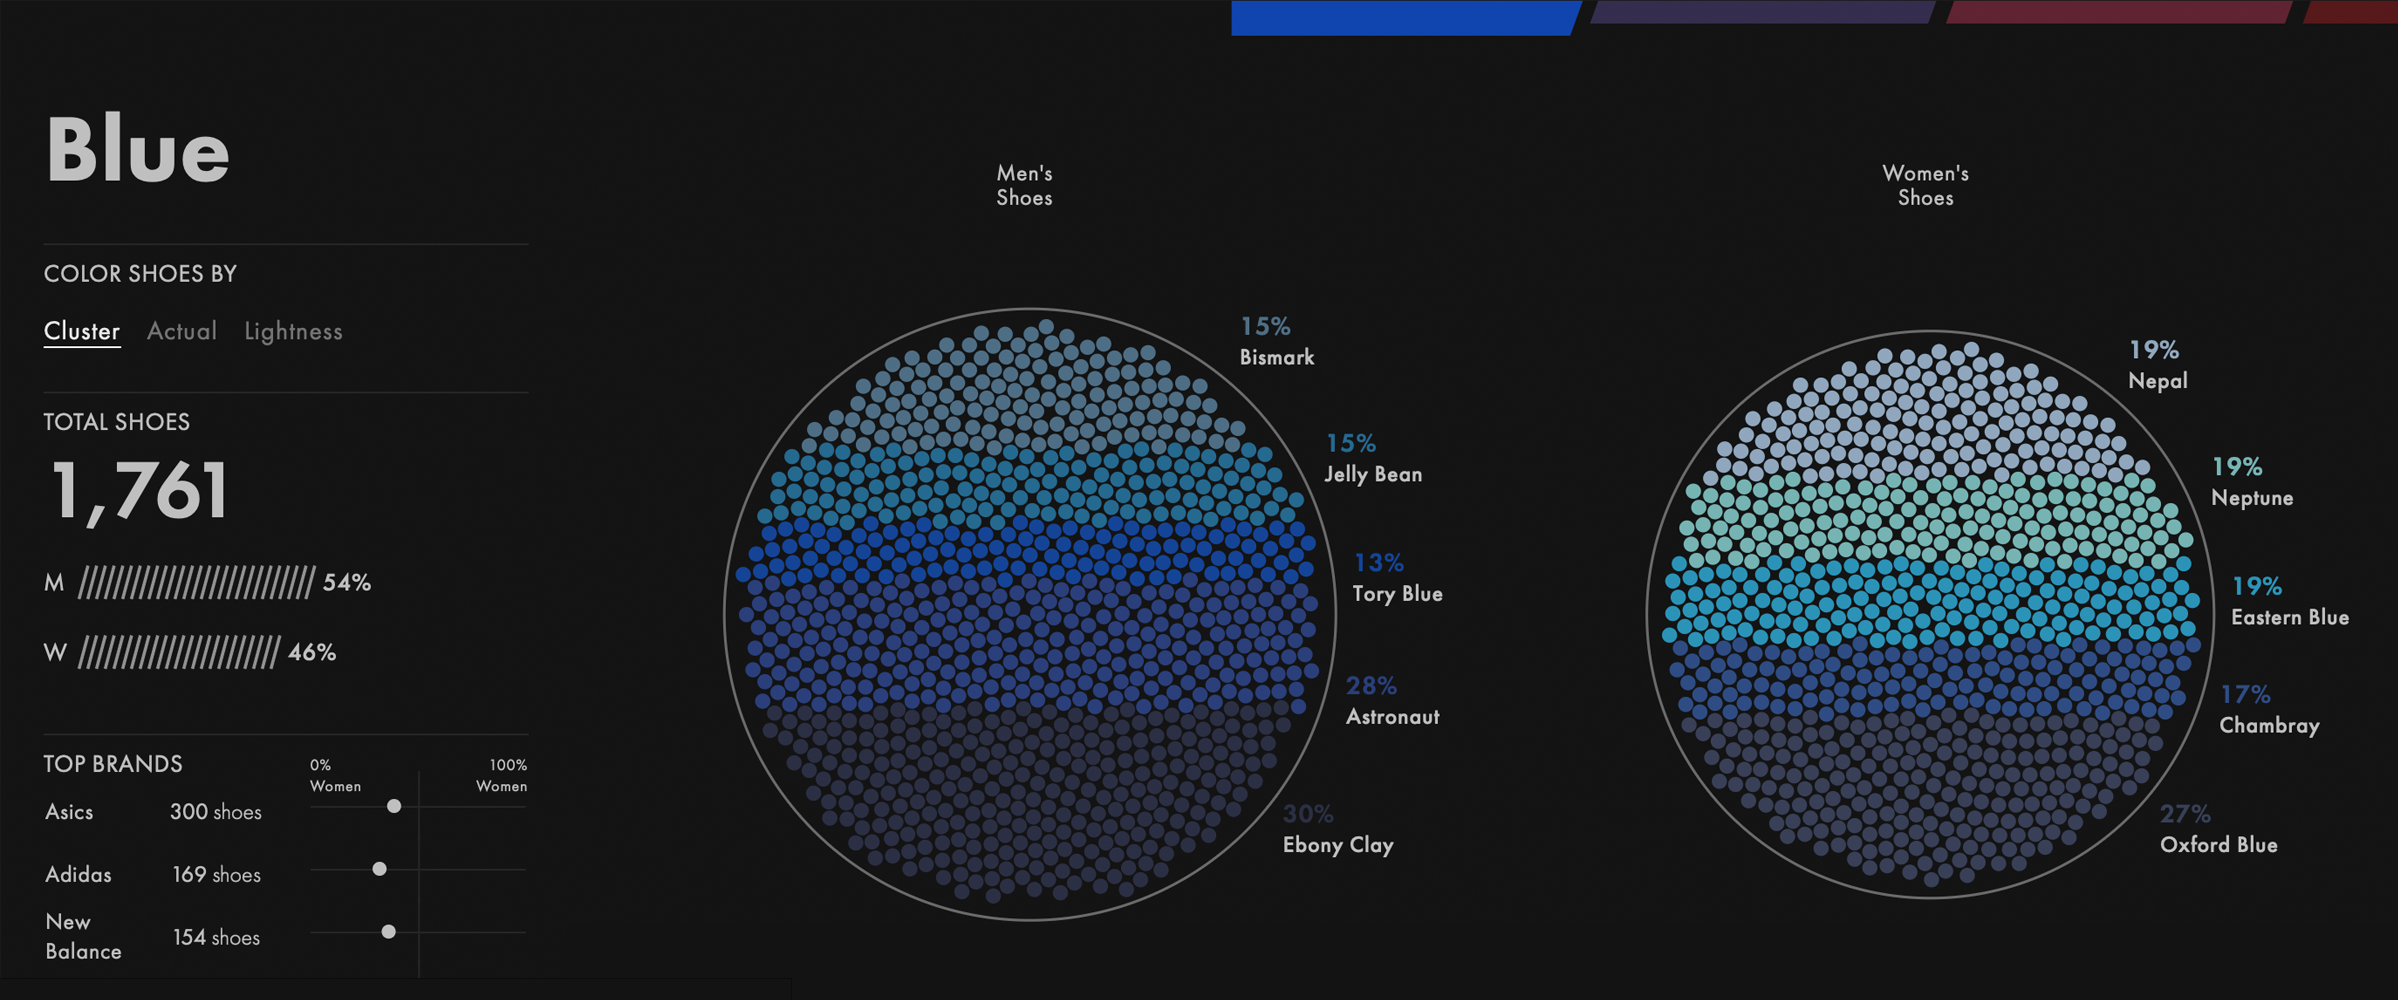
December 2, 2020 • Collaboration with Hesham Eissa Running shoes are available in almost every color and shade, from light blue to neon yellow to dark red (and everything in between). However, this doesn't necessarily mean every color is available to both women and men. But how different are they? To find out, we analyzed the running shoes available on RunRepeat in the US. VIEW PROJECT| Lindsey Poulter
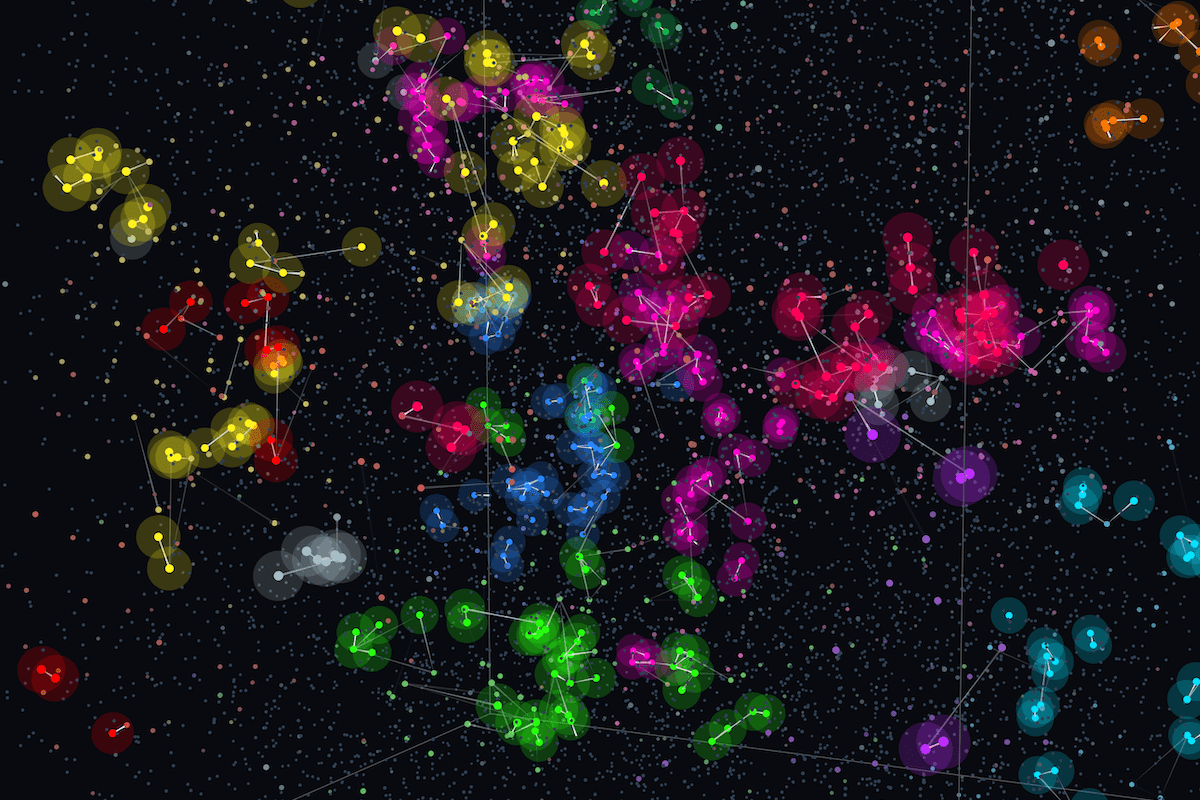
A data art collection revealing how the stars are moving across the eons, through the lens of how our current constellations are pulled apart| Visual Cinnamon