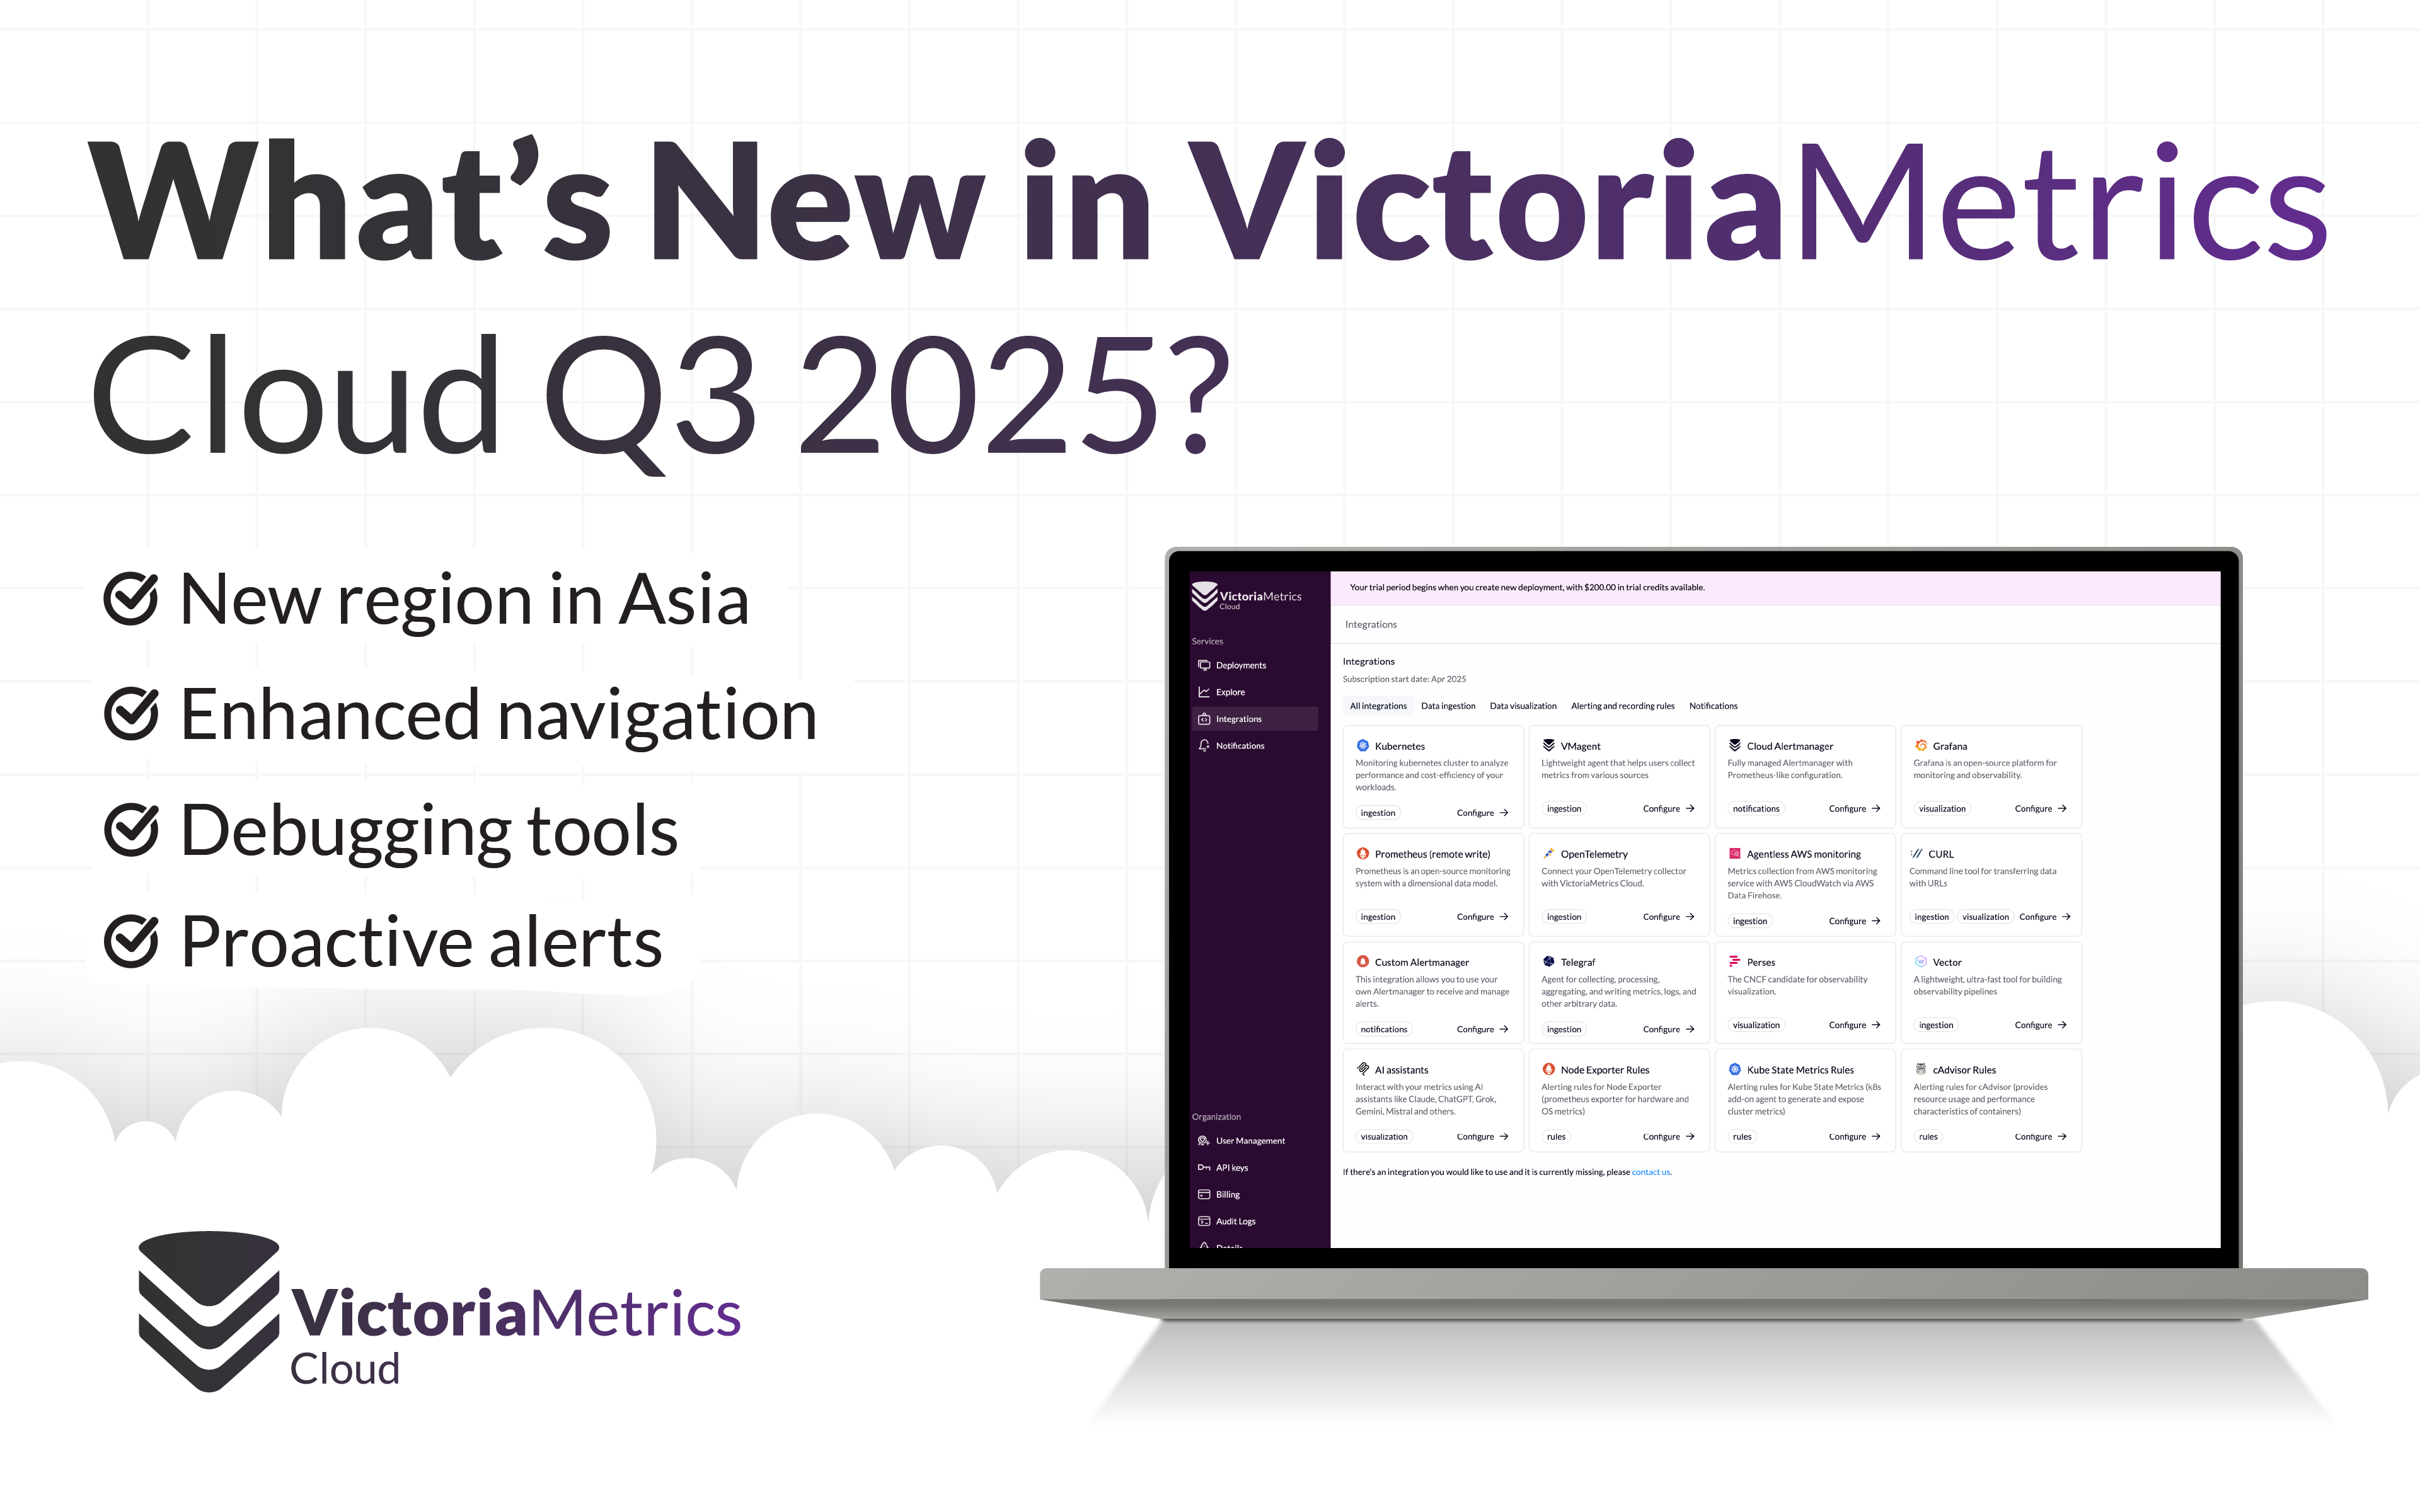
What's New in VictoriaMetrics Cloud Q3 2025? From new region in Asia to proactive alerts
Discover the latest updates in VictoriaMetrics Cloud that make observability smoother, smarter, and more secure.| VictoriaMetrics
Discover the latest updates in VictoriaMetrics Cloud that make observability smoother, smarter, and more secure.| VictoriaMetrics
Confused by IOPS, latency, and throughput? This guide breaks down storage performance metrics so you can pinpoint bottlenecks and understand what really makes storage fast—or slow. The post Understanding Storage Performance Metrics appeared first on Klara Systems.| Klara Systems

Learn how to design and roll out Cilium Network Policies in Kubernetes with this hands-on tutorial. See YAML examples, Hubble flow outputs, deny rules, and troubleshooting tips to secure workloads step by step.| vEducate.co.uk

Last month I dropped a desperate little plea for help in this space, asking people to email me any good advice and/or strong opinions they happened to have on the topic of buying software. I wasn’t…| charity.wtf
Modern SREs face a new kind of challenge: incidents that span multiple domains—cloud, network, and application layers. Ciroos CEO Ronak Desai explains how unified observability, shared ownership, and AI-driven reasoning help teams resolve incidents faster and reduce fatigue in complex, distributed environments. The post Mastering Multi-Domain Complexity in Site Reliability Engineering appeared first on TFiR.| TFiR
What Are OpenTelemetry Metrics? OpenTelemetry metrics are measurements of services performance at runtime. For example, request counts, error rates, memory usage, or latency. Here’s how they compare to logs and traces, which are other types of telemetry data instrumented by OpenTelemetry: With metrics, teams monitor trends and patterns in their system performance. For example: This […]| The Logz.io Blog — DevOps, Logging, Metrics, Tracing, and Security
What’s Launching This Week AI Agent for Dashboards We’re fundamentally changing how teams interact with observability dashboards. Our enhanced AI Agent now doesn’t just analyze your data, it acts as an extension of your team to analyze dashborads for you, extract insights and help you act on these insights. See it in action: You don’t […]| The Logz.io Blog — DevOps, Logging, Metrics, Tracing, and Security
Why LLM Observability Tools Are Essential In 2025 Organizations are adding GenAI to their current and future architectures and product roadmaps, requiring Ops teams to ensure LLMs are accurate, fast, secure and cost-efficient. LLM observability tools directly addresses these needs, helping identify and prevent common LLM errors and issues: LLM observability provides the telemetry data […]| The Logz.io Blog — DevOps, Logging, Metrics, Tracing, and Security
Today, we’re excited to announce new enhanced features in Amazon CloudWatch Application Signals that simplifies how you monitor large-scale distributed applications. Improvements to CloudWatch Application Signals application map automatically discovers and organizes services into groups based on their relationships, with support for custom grouping that aligns with your business perspective. You can now view the […]| Amazon Web Services

From 'Is it up?' to 'We see everything' – 5 monitoring stages to save your sanity (and $50K in outages). Start small, win big!| Kalvad
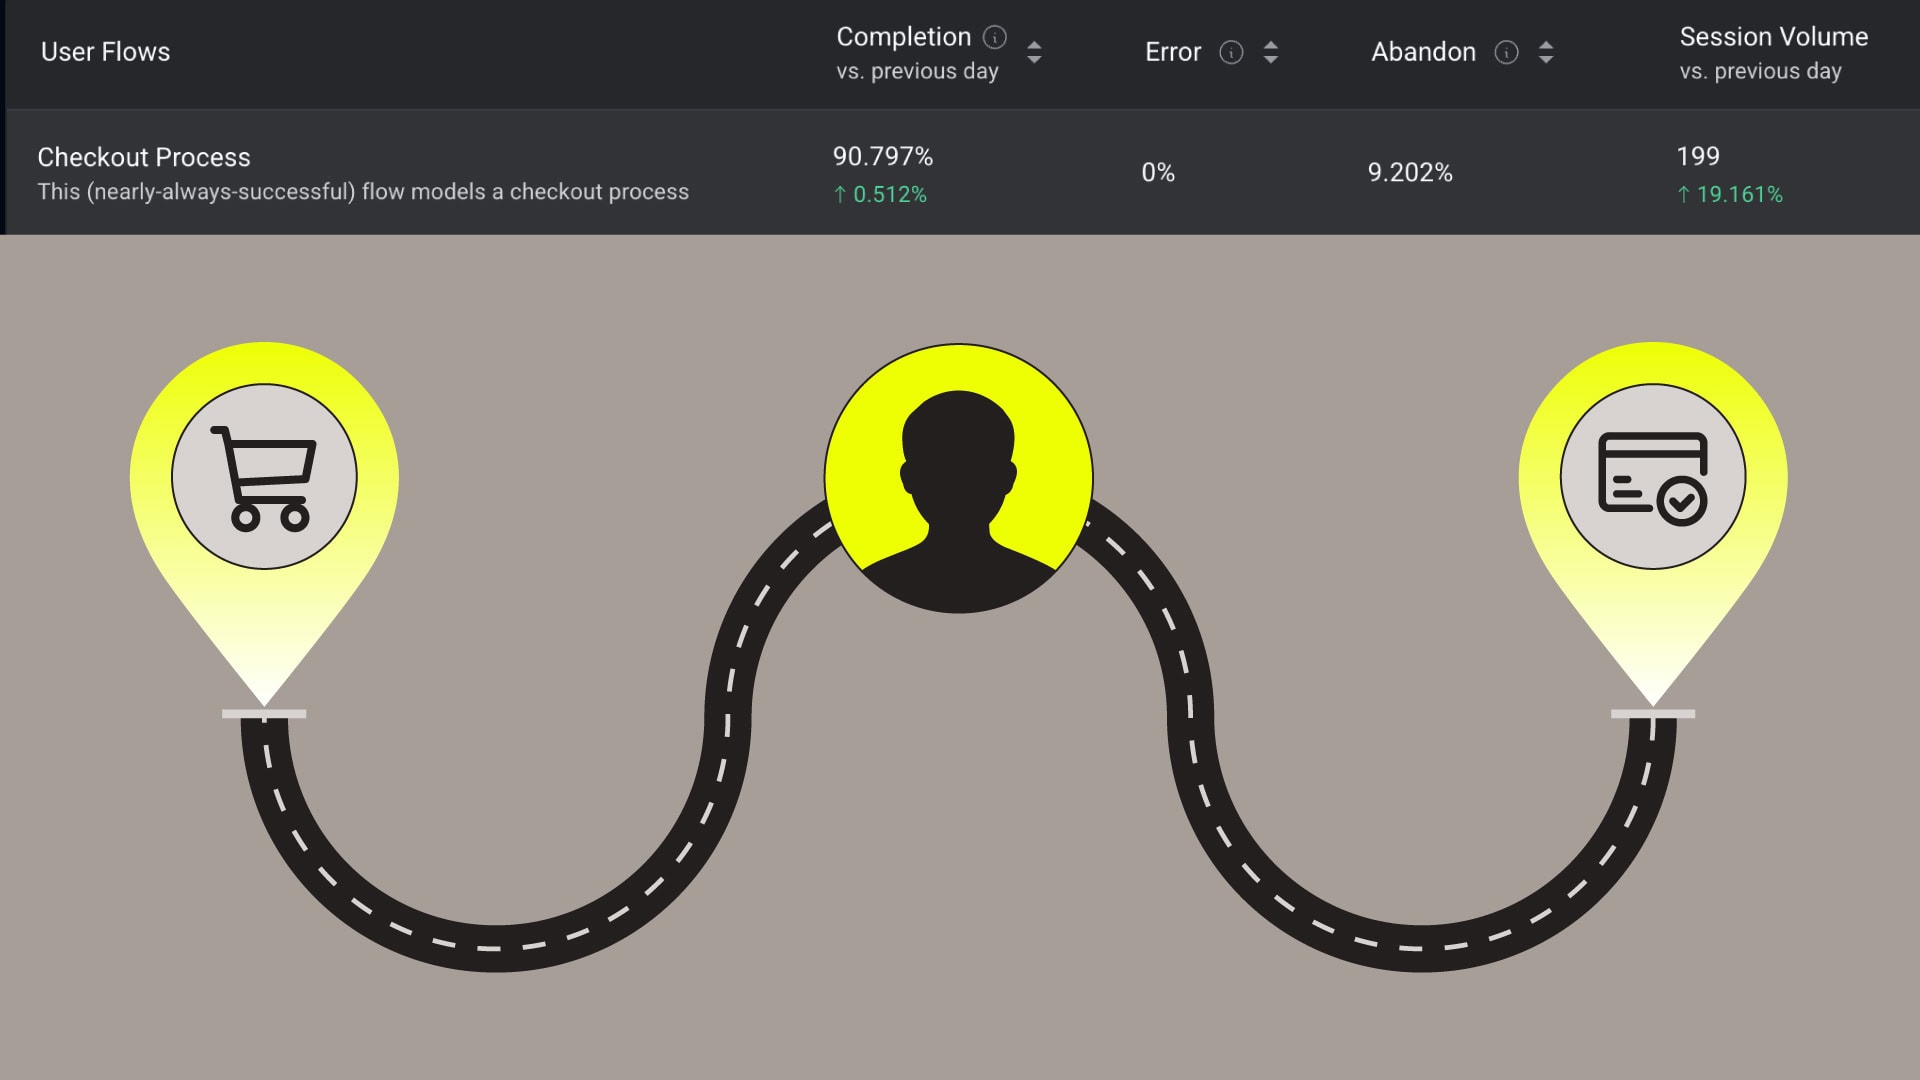
Learn how, and why, to create User Flows that target the mission-critical parts of your mobile and web applications.| Embrace
Careless tuning in production can hurt stability and performance. This article explores ARC, L2ARC, and SLOG — when to tune, and the risks of overdoing it. The post ZFS Performance Tuning in the Real World: ARC, L2ARC, and SLOG appeared first on Klara Systems.| Klara Systems

A comprehensive guide on where and how to instrument metrics in your applications, covering everything from API endpoints to background jobs| Pierre Zemb's Blog
Michael Blum| mblum.me 🥝
Heroku recently made the next generation platform - Fir - generally available. Fir builds on the strengths of the Cedar generation while introducing a new modern era of developer experience. Fir leverages modern cloud-native technologies to provide a seamless and performant platform. One of the goals we set out to achieve with Fir is to modernize our platform's observability architecture. Applications being written today are becoming increasingly more distributed and complex in nature. With t...| Heroku
Discover OpenTelemetry observability features, best practices, tool selection tips, and ways to overcome OTel challenges.| Logz.io
The OpenTelemetry Astronomy Shop demo has long served as a reference environment for exploring observability in distributed systems, but until now it shipped with only a Prometheus datasource. VictoriaMetrics forked the demo and extended it with VictoriaMetrics, VictoriaLogs, and VictoriaTraces, providing insights into VictoriaMetrics’ observability stack where metrics, logs, and traces flow into a unified backend.| VictoriaMetrics
Learn how to build a resource monitor with QuestDB and Grafana, and visualize system resource usage data. Also learn how to correlate application events with resource utilization!| QuestDB Blog
In this candid discussion with Logz.io founders Tomer Levy and Asaf Yigal, we covered:| Educate yourself on DevOps, Log Analysis, AI, and more | Logz.io
In this live technical demonstration, AI agent experts presented:| Educate yourself on DevOps, Log Analysis, AI, and more | Logz.io
Struggling with Kubernetes performance issues? This video introduces an AI-powered agent designed to help users quickly identify and resolve bottlenecks. By analyzing logs, the AI detects performance issues, streamlining troubleshooting and improving system efficiency. Watch now to see how AI can simplify Kubernetes performance management and keep your infrastructure running smoothly!| Educate yourself on DevOps, Log Analysis, AI, and more | Logz.io
Struggling with high observability costs? In this video, Jade Lassery breaks down the challenges of managing excessive data and skyrocketing expenses. She introduces the Logz.io AI agent, a powerful solution designed to optimize data usage, reduce unnecessary costs, and improve efficiency. Learn how to take control of your observability spending while maintaining high performance. Watch […]| Educate yourself on DevOps, Log Analysis, AI, and more | Logz.io
In the video, Jade Lassery discusses how to effectively manage complex environments, especially when faced with unexpected spikes in errors. She introduces a Logz.io AI agent prompt that assists users in quickly identifying the root cause of these issues. By simply asking the right questions, users can streamline their troubleshooting process and enhance their operational […]| Educate yourself on DevOps, Log Analysis, AI, and more | Logz.io
Welcome to Logz.io Open 360 AI, the first observability platform built for humans and AI agents working together. Our AI-driven observability platform helps you: ✅ Automate and Enhance Root Cause Analysis (RCA) – The AI Agent investigates alerts instantly, analyzes telemetry, and pinpoints the root cause with clear explanations and recommended fixes. ✅ Get Natural […]| Educate yourself on DevOps, Log Analysis, AI, and more | Logz.io

How the observability industry's vendor lock-in tactics led to building Lapsoss and the Liberation Stack - community-owned tools that put developers back in control| Seuros Blog - Navigation Logs from the Ruby Nebula

The crew investigates a scientific outpost that has gone dark. They arrive to find the inhabitants have achieved "total observability," logging every single action, thought, and system metric. They are now so overwhelmed with data that they are paralyzed, unable to find the signal in the noise.| Seuros Blog - Navigation Logs from the Ruby Nebula

Learn about observability & OpenTelemetry. Discover the importance of telemetry data & how OpenTelemetry standardizes it, making your life easier!| ITGix
Monitoring tracks system health using predefined metrics, telemetry collects raw data, and observability enables deep analysis to diagnose both known and unknown issues.| Embrace

Observability best practices for mobile apps include implementing structured logging, collecting performance metrics (such as app startup time and crash rates), and using distributed tracing to monitor user journeys.| Embrace
Learn how to spot and resolve common ZFS issues like disk errors and degraded pools to maintain system health and data integrity.| Klara Systems
And why I don't want my database to choose the best encoding for me (yet)| Discover the Performance Engineer in you. | Polar Signals

You may know I’m a big fan of OpenTelemetry. I recently finished developing a master class for the YOW! conference at the end of the year. During development, I noticed massive differences in configuration and results across programming languages. Even worse, differences exist across frameworks inside the same programming language. In this post, I want to compare the different zero-code OpenTelemetry approaches on the JVM, covering the most widespread: Spring Boot with Micrometer Tracing| A Java geek

Using eBPF to record your programs dying breathes| Discover the Performance Engineer in you. | Polar Signals
Traditional observability tools can’t keep up with modern complexity. Dashboard and alert-based approaches still rely heavily on manual processes, resulting in longer troubleshooting cycles, slower decisions, and higher MTTR. Engineering teams need something better. Today we’re launching Open 360 AI, the first observability platform designed for both humans and AI agents working together. Instead of […]| The Logz.io Blog — DevOps, Logging, Metrics, Tracing, and Security
Curious to see how AI actually performs in a real-world production scenario? Watch the webinar “AI-Driven Alert Triage and RCA” with Logz.io Customer Success Engineer, Seth King. Below, we also bring the main highlights of the webinar. AI claims to make engineers more efficient and agile, by shortening processes and surfacing insights that help drive […]| The Logz.io Blog — DevOps, Logging, Metrics, Tracing, and Security

In this guide, we’ll show technologies and examples of full stack observability for an application running on Kubernetes, OpenTelemetry and AWS.| Logz.io
“Observability is the lens through which the invisible becomes visible, turning complex systems into understandable narratives.“ So before taking a […]| Distributed Computing Musings
In the last post, we explored how we can leverage tools such as Prometheus & Grafana for monitoring our applications. […]| Distributed Computing Musings
In the last post, we touched upon the requirement for observability & understood the basic components that form the common […]| Distributed Computing Musings
Imagine you are working on an issue in an existing feature. You started on Monday by reproducing the issue, you […]| Distributed Computing Musings
I woke up one day to Karpenter on AWS EKS throwing this error - "Controller isn't authorized to call ec2:RunInstances", and it took most of my day to figure this one out.| Technical Scratchpad
Prometheus Node Exporter is a tried and tested method to make hardware and OS metrics available as a scrapable endpoint to Prometheus server (or other downstream services/TSDB that support the same format). With OpenTelemetry (OTel) gaining more traction/recognition, I learnt that the OTel Collector's Host Metrics Receiver can also be used to expose host level metrics. However, I wondered if it would be able to make parity in terms of the type/number of metrics it is able to expose to downstr...| Technical Scratchpad
Thanks to Typesense for sponsoring the creation of this cartoon! GT2 Pro members, download a high-res version of this image that you can use royalty-free anywhere:| Good Tech Things

Learn the differences between traditional observability approaches and user-centric solutions when it comes to troubleshooting a mobile app issue.| Embrace

I wrote a lot of blog posts over my time at Parse, but they all evaporated after Facebook killed the product. Most of them I didn’t care about (there were, ahem, a lot of “service relia…| charity.wtf
Honeycomb is proud to be named a Visionary in the 2025 Gartner® Magic Quadrant™ for Observability Platforms. We feel that our recognition by Gartner showcases our commitment to help engineering teams gain observability over complex environments—not just for today’s systems, but for whatever comes next. The post Honeycomb Named a Visionary in the 2025 Gartner® Magic Quadrant™ for Observability Platforms appeared first on Honeycomb.| Honeycomb
I’m pleased to announce the public beta of Honeycomb Hosted MCP, along with our first wave of one-click integrations for Cursor, Visual Studio Code, and Claude Desktop. We’re also very excited to announce that Hosted MCP is available on AWS AI Agents marketplace and for all Honeycomb plans (including our free plan!) at no charge. The post Honeycomb In Your IDE? Yes, With Hosted MCP Now Available in AWS Marketplace AI Agents and Tools Category appeared first on Honeycomb.| Honeycomb

SAN FRANCISCO – July 16 2025 – Honeycomb , the creators of observability, today announced the availability of the Honeycomb Hosted Model Context Protocol (MCP) Server in the new AI Agents and Tools category of AWS Marketplace. Customers can now use AWS Marketplace to easily discover, buy, and deploy AI agents solutions, including Honeycomb’s MCP server, using their AWS accounts.| Honeycomb

July 31st – Aug 3rd Portland State University @ Smith Memorial Student Union building This year Mark and I, with Richard Yen and Gabrielle Roth’s help, have been organizing the database…| PDXPUG

This is a very short Lesson Learned from migrating from fileabeat to Grafana Alloy - and how labels drove me nearly insane. td;dr; static_labels before labels!| ConSol Blog
Over and over, we’ve seen that teams who invest in adding rich, relevant context to their telemetry end up debugging faster and collaborating more effectively during incidents. Getting meaningful context added can feel like a big cross-team project, but some of the highest-leverage improvements don’t require app code changes or coordination across services. The post The Fast Path to More Useful Telemetry appeared first on Honeycomb.| Honeycomb
In this post, we’ll describe what traces are, how they work, and the value traces provide in observability, helping stakeholders understand their systems and delivering reliable services at scale and performance. The post What Are Traces? A Developer’s Guide to Distributed Tracing appeared first on Honeycomb.| Honeycomb

Many engineers & leaders are under pressure to apply sampling for cost savings purposes, but are concerned with the impacts on data quality.| Honeycomb
At LDX3 in London last week, two roundtables I hosted with engineering leaders confirmed what many of us are starting to feel: observability isn’t just important—it’s becoming essential to how modern teams navigate the pressure to move fast and stay resilient. The post Is Your Observability Strategy Boardroom-Ready? appeared first on Honeycomb.| Honeycomb

Claude Code added OpenTelemetry metric and log support in a recent release, which led Austin to ask, can Claude Code observe itself?| Honeycomb

With cloud-native innovation accelerating remarkably, Day 3 of KubeCon Europe 2025 built upon the momentum from previous sessions—this time with a distinct| ITGix

KubeCon 2025 Day 2 focused on cloud-native security, covering zero-trust, policy-as-code, AI security, and Kubernetes hardening. Read the key insights and lessons learned.| ITGix
With this release, you can more easily build and reconfigure telemetry pipelines and sample safely with the ability to easily pull full-fidelity data from your own archive whenever you need it. The post Observability Without Tradeoffs: Introducing Powerful New Honeycomb Telemetry Pipeline Features appeared first on Honeycomb.| Honeycomb

SAN FRANCISCO – June 24, 2025 – Honeycomb , the creators of observability, today announced a major milestone in helping enterprises maximize the value of their observability data. Building towards the industry’s first fully integrated telemetry pipeline , Honeycomb adds the ability to access archived telemetry data with a single click for full fidelity analysis from low cost storage, as well as powerful new ways to sample telemetry data and control costs.| Honeycomb

Automatically detect and fix network documentation drift with NetBox Assurance, available as an add-on for NetBox Enterprise.| netboxlabs.com
See how intelligent automation transforms observability, streamlining operations, reducing costs, and improving issue resolution.| Logz.io
I’m sitting in the Hungarian Railway Museum’s amazing park, under the shadow of buckeye trees, in the middle of a chirping concert from at least a dozen different birds. Halftime of the 2-day Craft Conference, I arrived a bit early to be able to finish this| Péter Szász

Explore the Prometheus design and see which components consume the most resources. Find out why it happens, what affects it, and how you can optimize your setups to get the best performance in monitoring.| blog.palark.com
Standard HTTP logs miss crucial details like request and response bodies, hindering debugging. Our article offers solutions for complete HTTP logging, ensuring you have all the necessary information for effective web management.| Kalvad
Debugging effectively requires a nuanced approach, similar to using tongs that tightly grip the problem from both sides. While low-level tools have their place in system-level service debugging, today's focus shifts towards a more sophisticated segme...| Java, Debugging, DevOps & Open Source
Announcing Sentry's OpenFeature integration for enhanced feature flag observability| OpenFeature Blog

Groan. Well, it’s not like I wasn’t warned. When I first started teasing out the differences between the pillars model and the single unified storage model and applying “2.0” to the latter, Christi…| charity.wtf
Embrace combines open-source SDKs with an analysis dashboard to help the entire engineering team understand exactly what is disrupting mobile user experiences.| Embrace
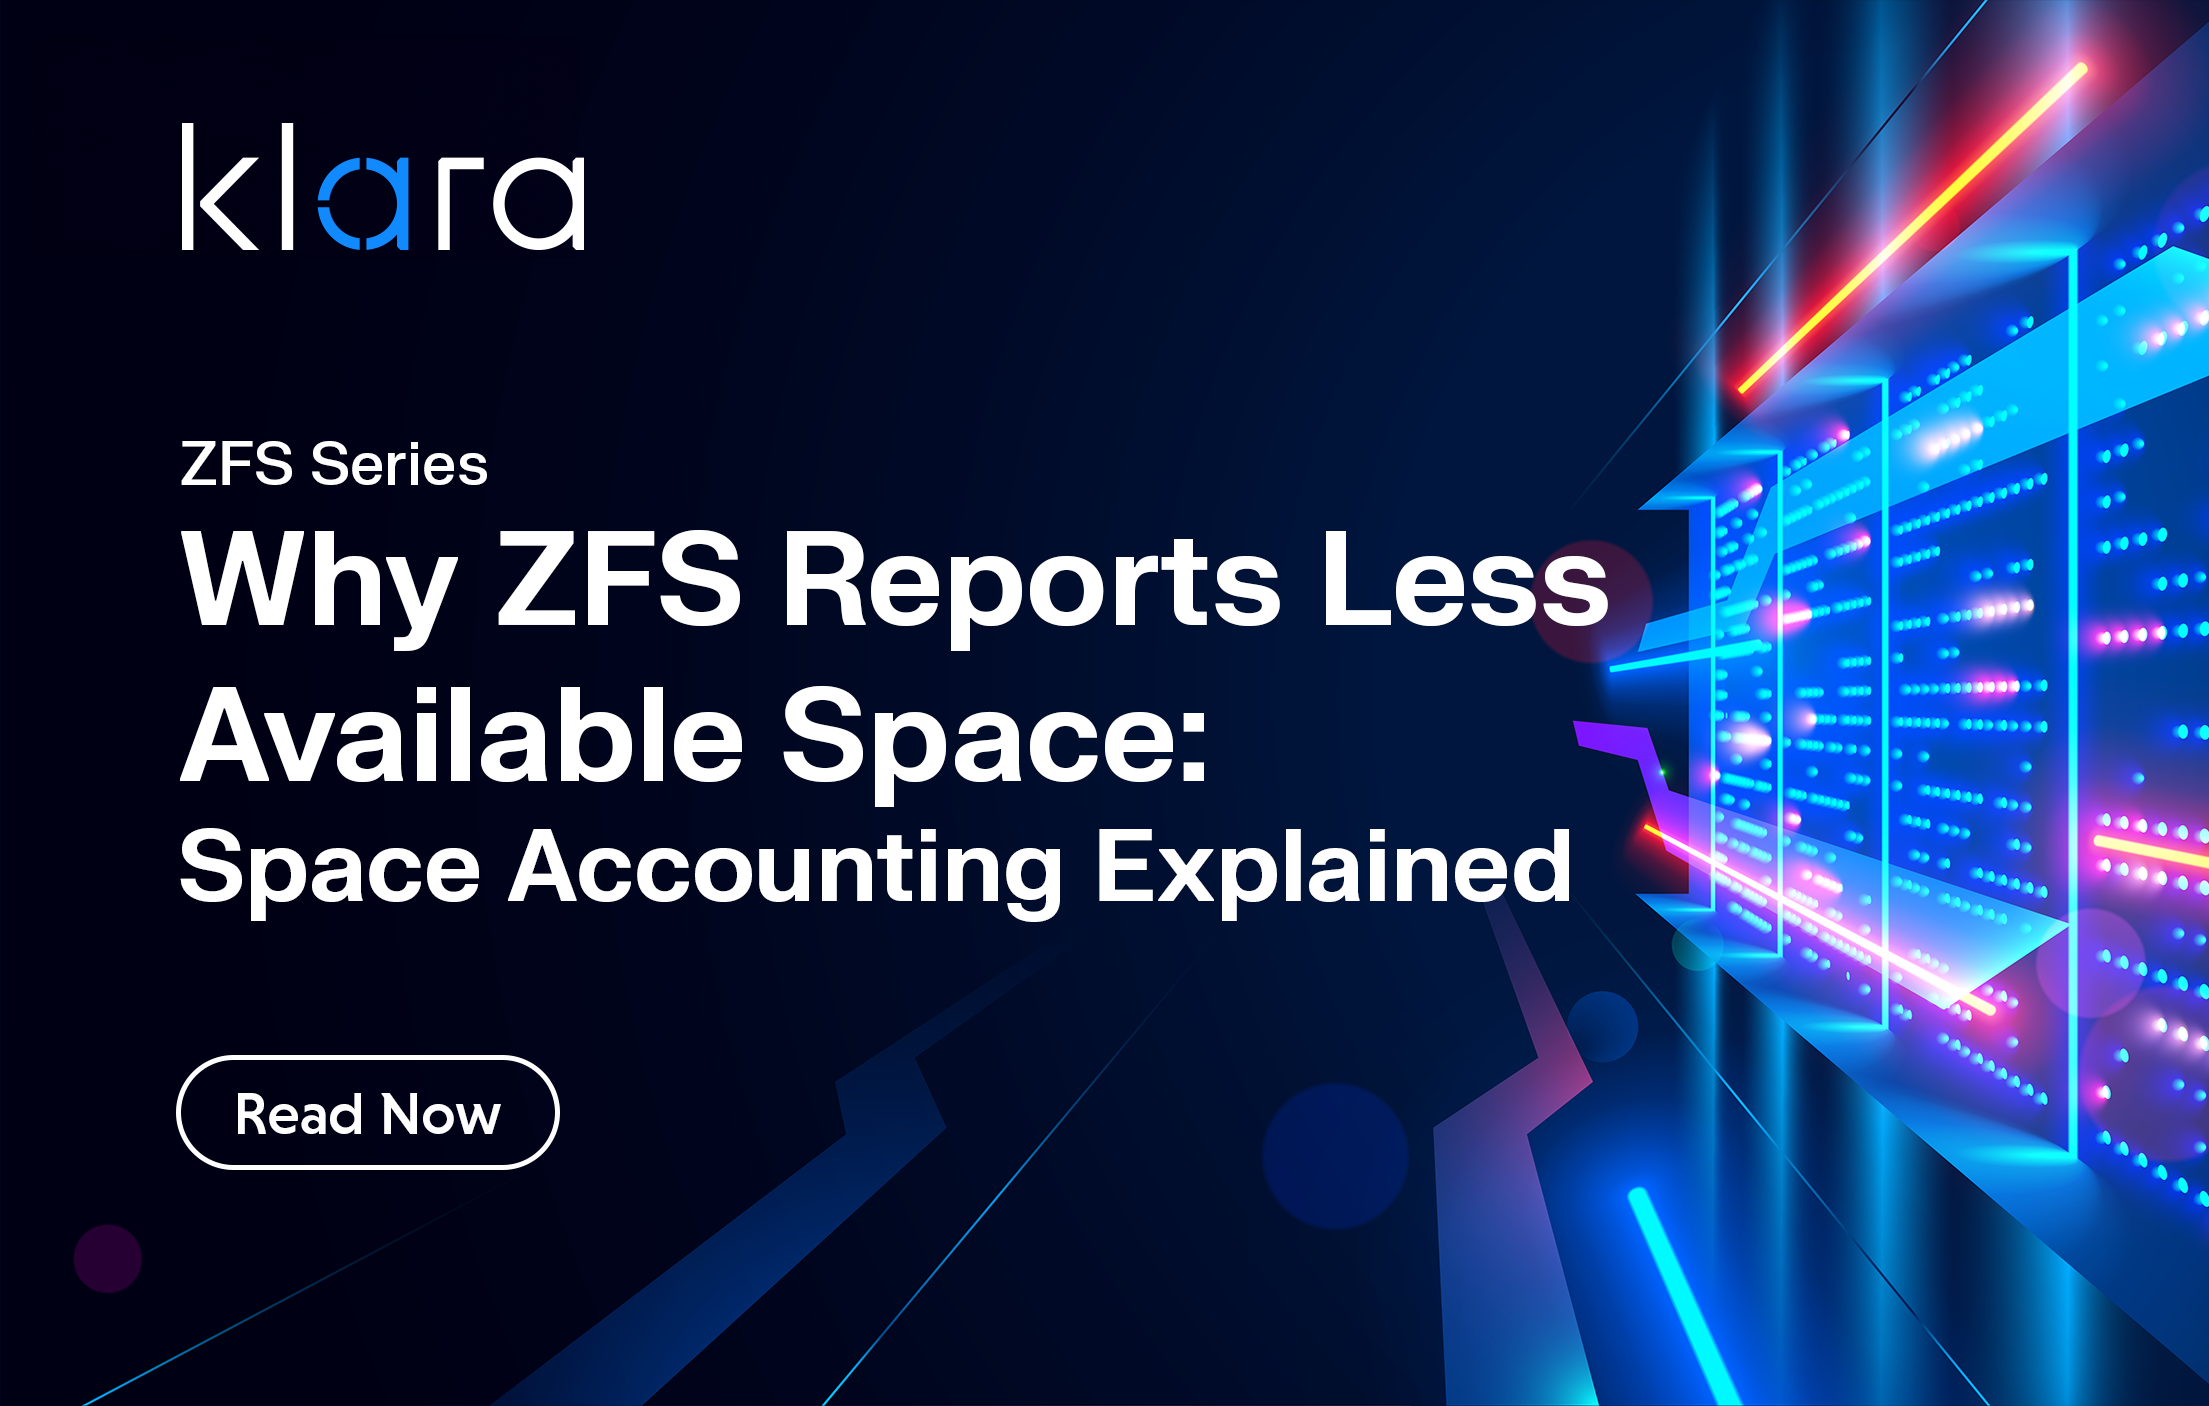
Uncover the secrets of ZFS space accounting and why available storage can appear lower than expected—see what impacts space calculation.| Klara Systems
Help us make feature observability better for everyone!| OpenFeature Blog

We caught up with Michael Garski, Director of Platform Engineering at Fender, to hear how things are going with Honeycomb for Frontend Observability.| Honeycomb

OTel was created to help collect and analyze observability data at scale. In this episode of Makers, Morgan McLean, its co-creator, explores the roadmap.| The New Stack
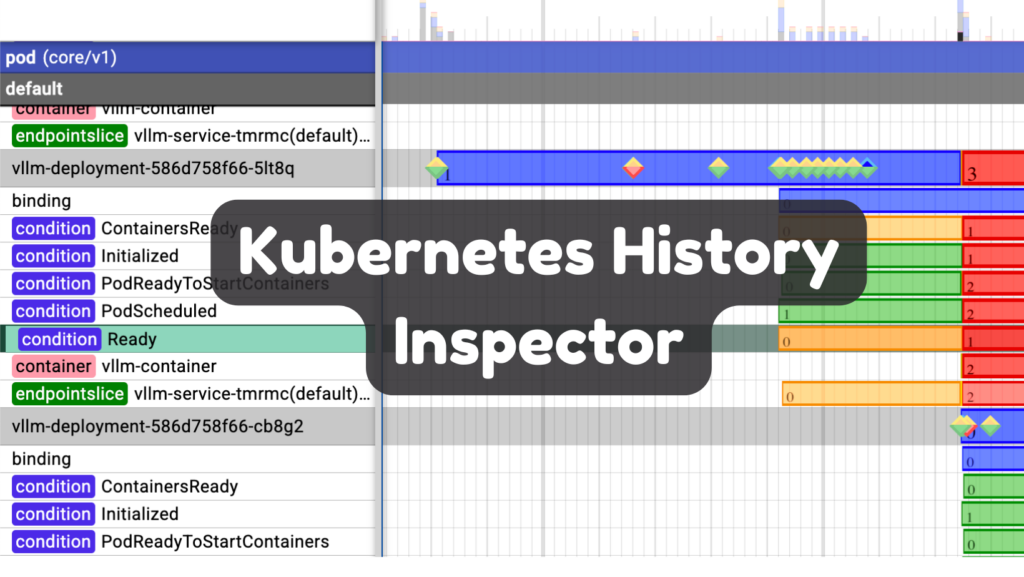
GKE users get access to an awesome new tool this week: the Kubernetes History Inspector. This product, released as open source, parses Kubernetes and GKE logs to generate a timeline with all events in the cluster. Kubernetes is a complicated system with multiple objects, and various automated pro| William Denniss
These days, systems and applications evolve at a rapid pace. This makes analyzing the internal performance of applications complex. Observability emerges as a path to efficient and effective operational insights. Imagine a team of doctors monitoring a patient’s vitals—heart rate, temperature, blood pressure. These readings, combined with observation of symptoms, paint a picture of the […] The post Introduction to Observability appeared first on pingdom.com.| Blog Posts Archive - Pingdom
Start Kubernetes observability with OpenTelemetry, streamlining metrics, logs, and traces into unified monitoring for better visibility.| Logz.io
Struggling to scale your DIY ELK stack? Discover how migrating to a SaaS observability platform can simplify operations, reduce costs, and unlock advanced features like AI-powered insights. Learn when and how to make the shift for seamless scalability.| Logz.io
Distributed computing is hard, distributed debugging is even harder. Dask tries to simplify this process as much as possible. Coiled adds additional observability features for your Dask clusters and processes them to help users understand their workflows better.| Blog
While it’s trivial to measure the end-to-end runtime of a Dask workload, the next logical step - breaking down this time to understand if it could be faster - has historically been a much more arduous task that required a lot of intuition and legwork, for novice and expert users alike. We wanted to change that.Populated Fine Performance Metrics dashboard| Blog
Hendrik Makait2023-05-16| Blog

Hazel Weakly, you little troublemaker. As I whined to Hazel over text, after she sweetly sent me a preview draft of her post: “PLEASE don’t post this! I feel like I spend all my time trying to hel…| charity.wtf
AI is transforming how we monitor, manage, and secure digital environments. Learn more about how AI log analysis can shape the future of observability.| Logz.io
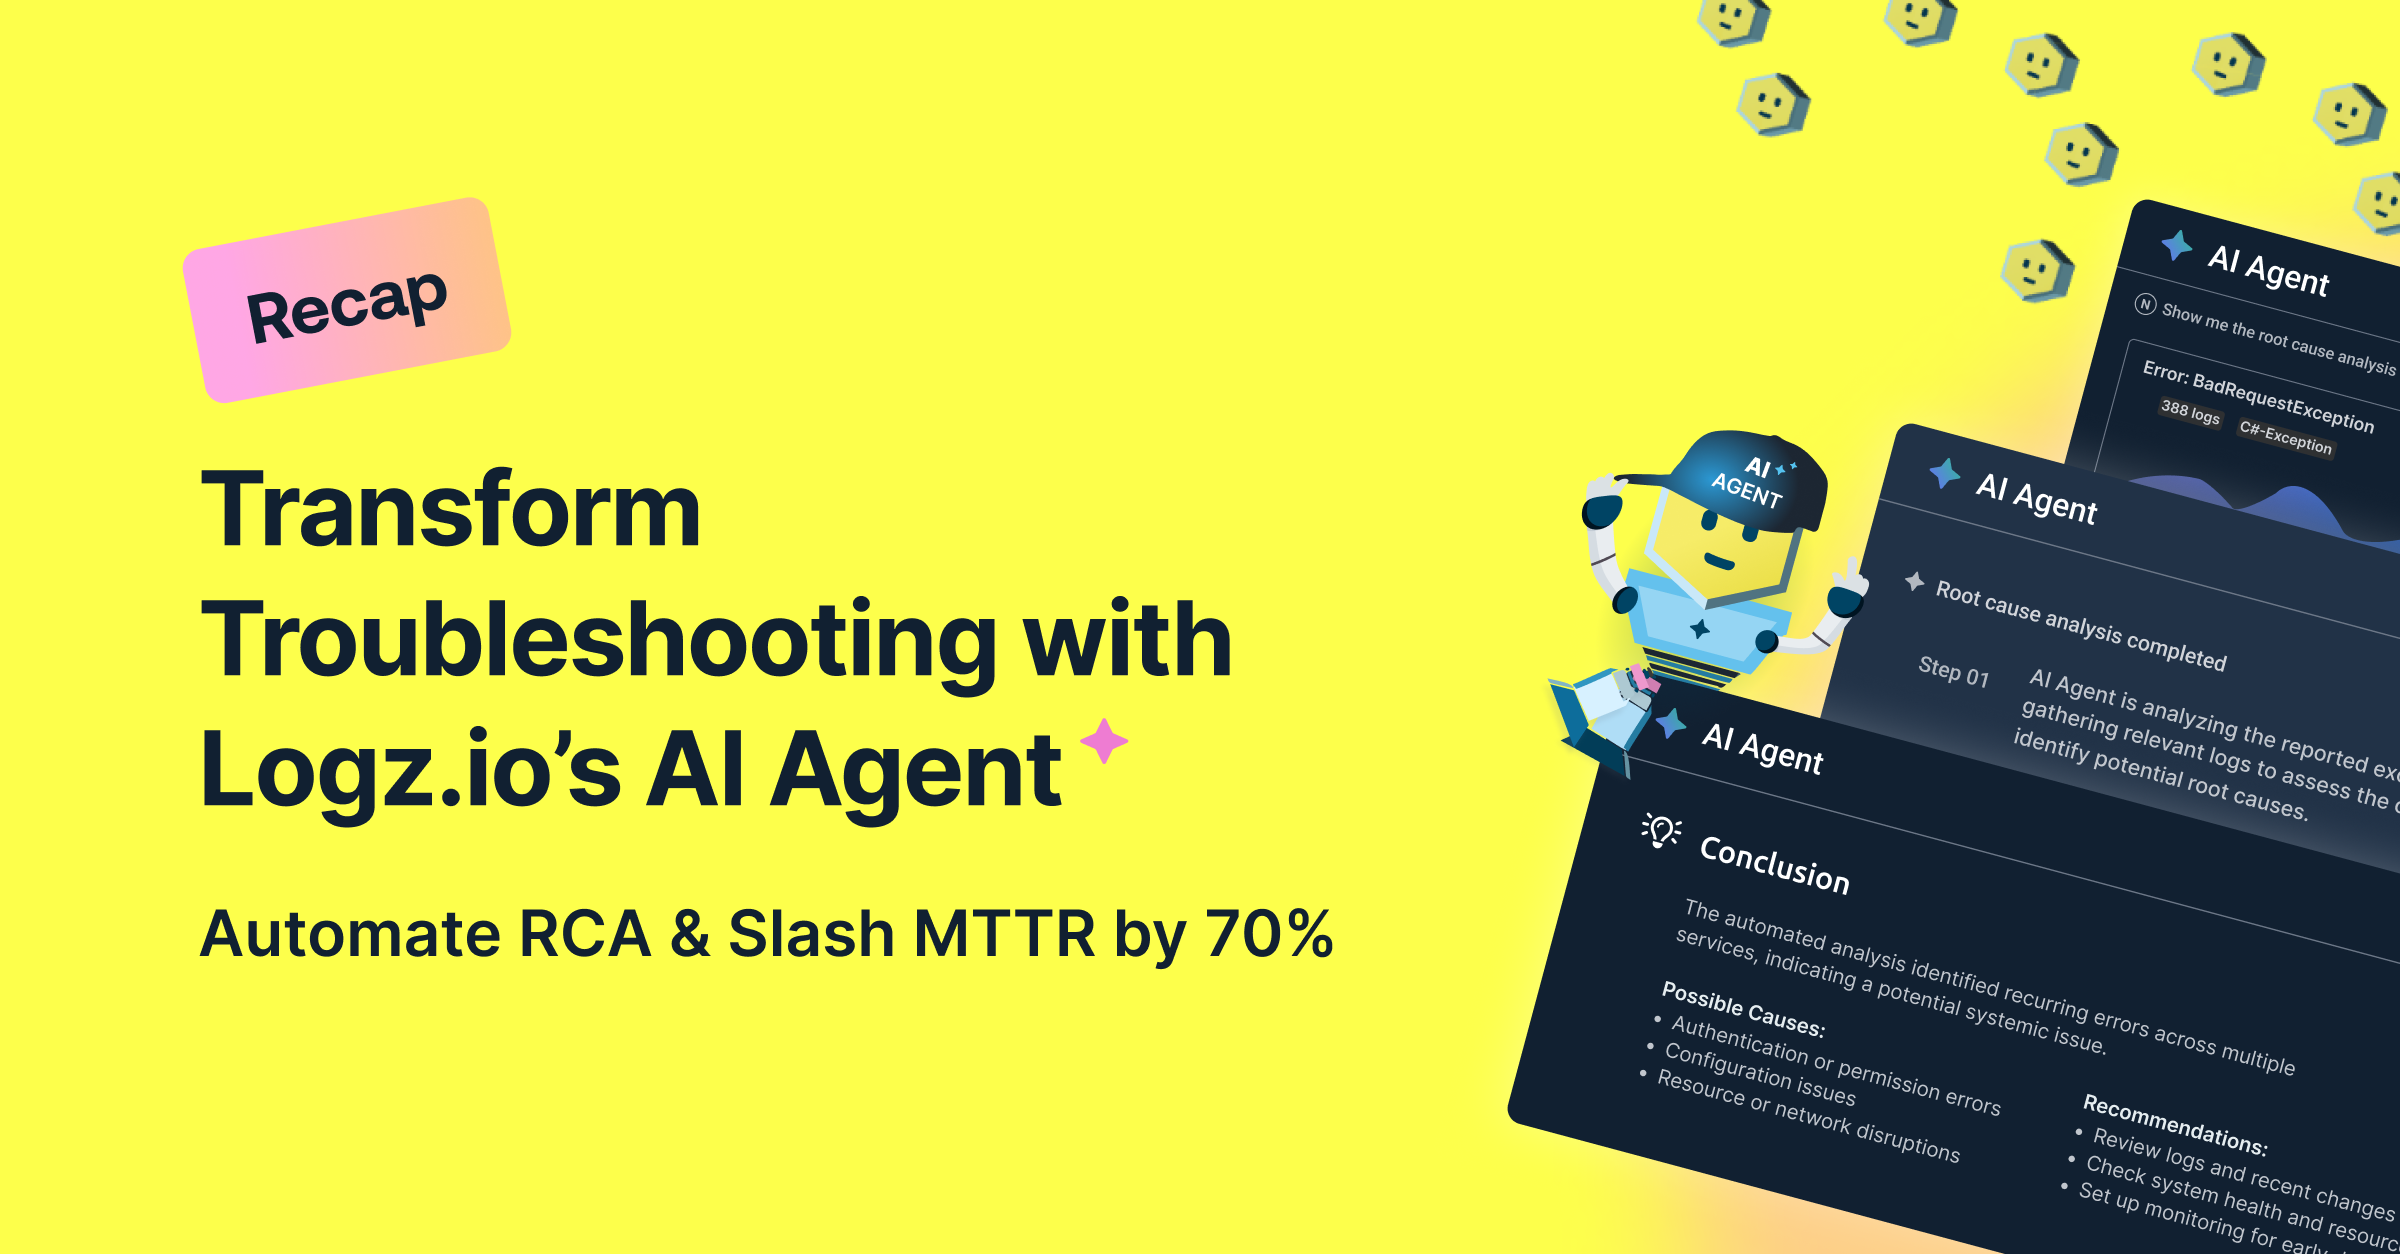
In this webinar, product experts showed how the Logz.io AI Agent can transform root cause analysis, optimize performance, and de-risk deployments.| Logz.io

In this article, Charity Majors goes over the simple, technical distinction between observability 1.0 and observability 2.0.| Honeycomb

How we scrape callstack information from the LuaJIT engine for profiling| Debug Daily. Optimize Always | Polar Signals

Cisco boosts its cybersecurity and AI ambitions with $28B acquisition of Splunk - SiliconANGLE| SiliconANGLE

Effective cloud migration is about steady progress, proper monitoring, and adjusting to new insights.| The New Stack

For insights on what developers should consider when using AI with DevOps, we collected perspectives from DevOps experts and developers.| The New Stack

Making sense of mobile data, and finding useful signals, requires accounting for the effects of time.| The New Stack

Observability teams can leverage Logz.io AI Agent to automate RCA investigation and benefit from advanced, AI-powered data analytics.| Logz.io

Discover how AI is transforming cloud observability from manual monitoring to autonomous systems. This blog post explores the challenges faced by technical teams, the stages of maturity in observability, and the potential of generative AI to enhance performance and reduce MTTR.| Logz.io
When it comes to production-ready systems we need a way to know what’s going on in it, aiding us in debugging it, when the time comes.| Alexandru Burlacu

In this post we’ll show you how you visualize the cluster metrics in a web browser and also we’ll set up alerting so that when something like a drive needs to be replaced or drive runs out of space we can get alerted for it.| MinIO Blog

In this post, I focus on a middleware technique to add span links between request traces on ASP.NET Core during internal redirects on NET 9.| Steve Gordon - Code with Steve

GenAI promises evolutionary changes in how we use observability tools, but meeting expectations means heeding the lessons of our AIOps mistakes.| Logz.io

In this post, I share a solution to programmatically disable the recording (exporting) of an Activity when instrumenting code for OpenTelemetry.| Steve Gordon - Code with Steve

Understand how logging and observability go hand-in-hand in modern, cloud-native environments with this comprehensive guide.| Logz.io

Augh! I am so behind on so much writing, I’m even behind on writing shit that I need to reference in order to write other pieces of writing. Like this one. So we’re just gonna do this quick and dir…| charity.wtf

Cisco completes its $28B acquisition of Splunk - SiliconANGLE| SiliconANGLE

This post discusses the limitations of auto-instrumentation and how a CoPE can help teams overcome them with custom instrumentation.| Honeycomb

Linting provides a cheap feedback loop, requires little setup, and can capture risky patterns. See which linter we chose and why.| Honeycomb
