What are metrics and time series, Churn Rate and High Cardinality, how data storage and search works, and the role of IndexDB and Time Series ID in VictoriaMetrics?| RTFM: Linux, DevOps, and system administration | DevOps-engineering, and syst...
Learn how to add observability to AI agents using OpenTelemetry and the VictoriaMetrics Stack. This guide explains how to instrument popular LLM frameworks and visualize metrics, logs, and traces in Grafana.| VictoriaMetrics
MFT processes run in the background – reliably, quickly, securely. At least in the ideal case. But what happens when a file is missing? When data arrives late, is incomplete, or cannot be processed at all? Anyone who can only answer these questions with great effort risks coming to a standstill. In a networked and […]| SEEBURGER Blog
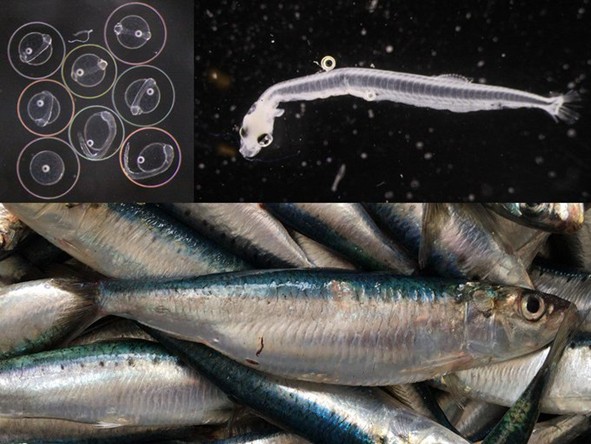
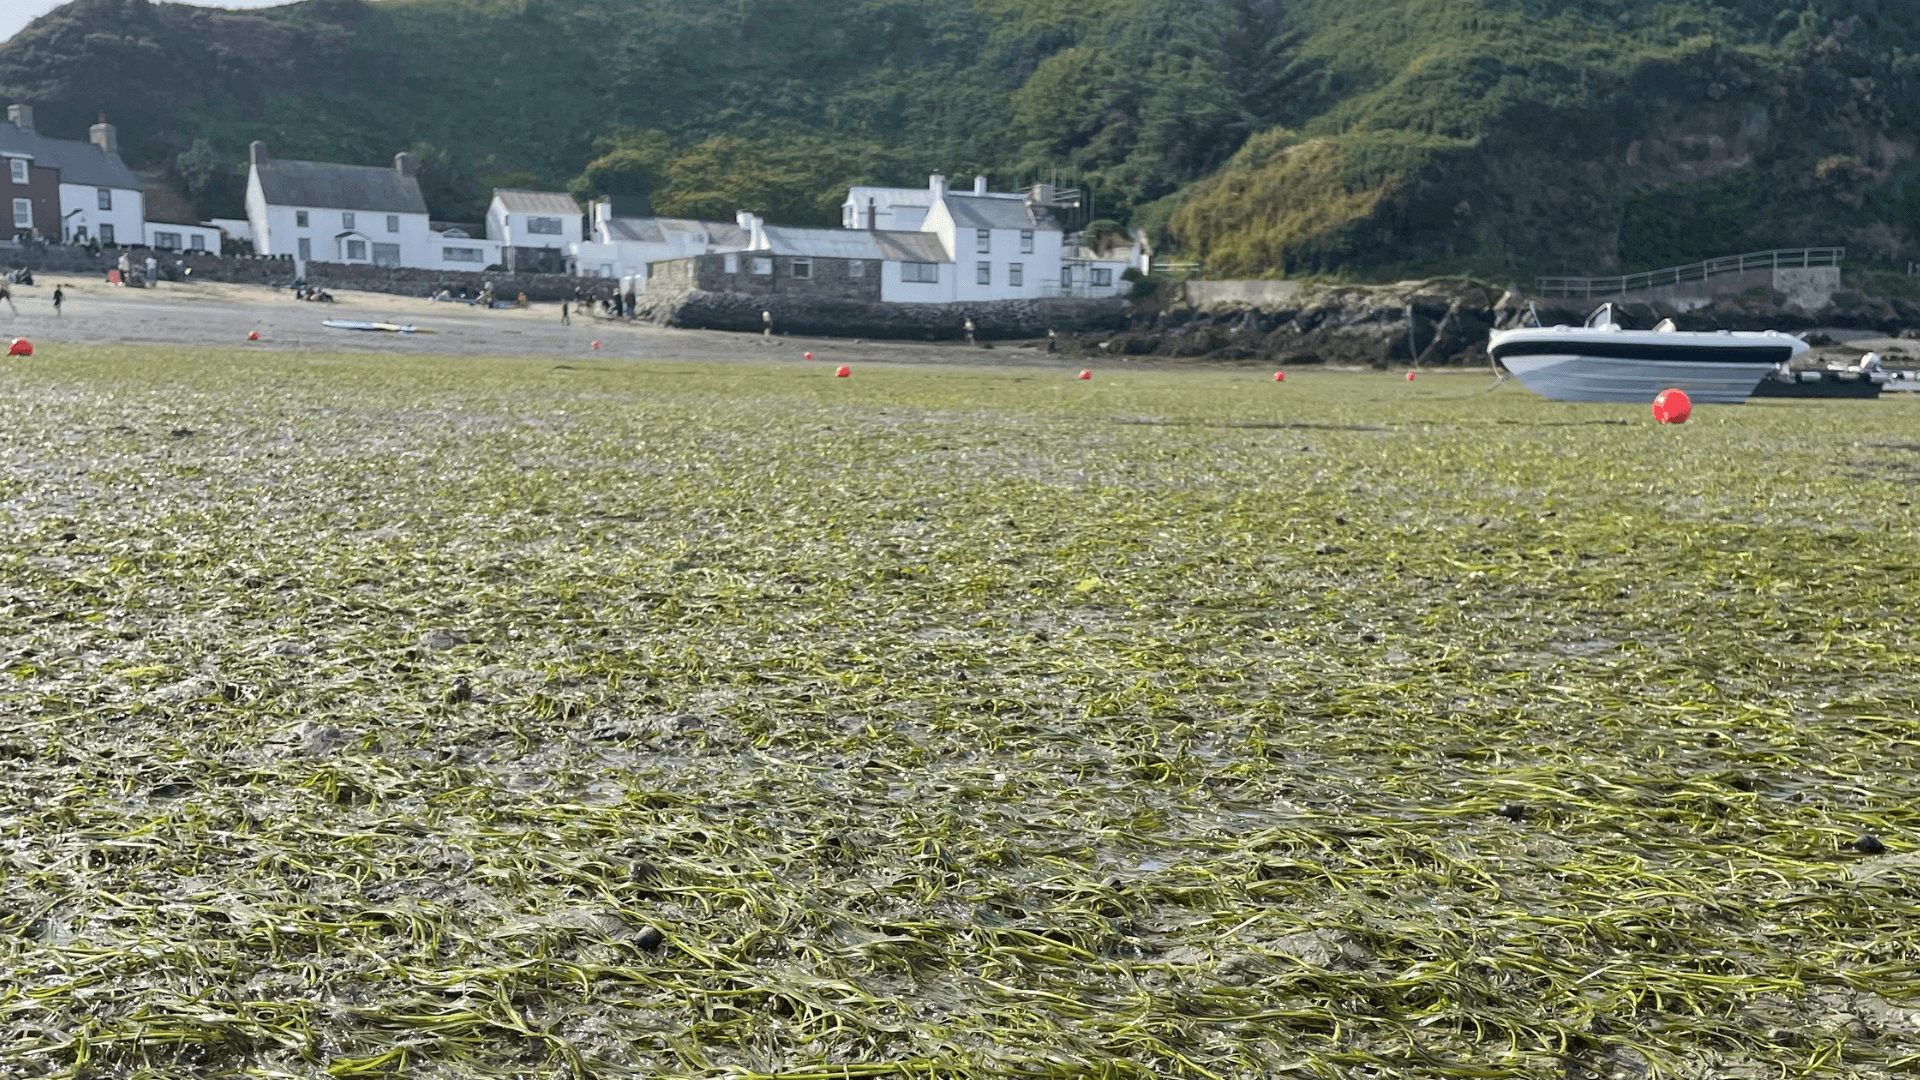
The waters to the south-west of the UK are home to a rich diversity of small fish such as sardines, anchovy, sprat, mackerel, horse mackerel and herring (collectively known as “small pelagic fish”). These fish species feed on plankton (microscopic …| marinescience.blog.gov.uk
Art thefts have always captured public imagination, blending intrigue, high stakes and cultural loss into a single narrative. The recent heist at the Louvre Museum, where thieves allegedly made off with priceless Napoleonic jewels in broad daylight, was no exception. In just seven minutes, the criminals used a construction platform to bypass security at one of the most prestigious museums in the world, smashed display cases and disappeared on scooters before security could react. The audacity...| Campus Safety Magazine
З’явився цей пост в принципі випадково. Прилетів мені один з дефолтних алертів VictoriaMetrics, які створюються під час деплою Helm-чарту victoria-metrics-k8s-stack: Думав написати коротенький пост типу “що таке Churn Rate і як його пофіксати”, але в результаті вийшло доволі глибоко зануритись в ...| RTFM: Linux, DevOps та системне адміністрування
Отже, продовження попереднього посту InfluxDB: знайомство і основні можливості. Там познайомились з InfluxDB в цілому, тепер час будувати з ним реальні рішення. Що будемо робити – запустимо InfluxDB на Debian, налаштуємо NGINX, імпортуємо дані з Google Sheets в .csv, а потім мігруємо їх до InfluxDB та п...| RTFM: Linux, DevOps та системне адміністрування
Є в мене давня ідея self-monitoring, яку, сподіваюсь, я такі почну робити і про яку напишу окремо. Але суть її така сама, як і в етіх ваших моніторингах – збирати метрики, і відображати графіки. Почав під цю систему вибирати базу даних, і хоча там частота запису метрик невелика, 1 мет...| RTFM: Linux, DevOps та системне адміністрування
[OPRIMA AQUÍ PARA ESPAÑOL] Want to brush up your shorebird ID skills or learn how to conduct Caribbean Waterbird Census (CWC) counts? Keep reading for details about this exciting opportunity! BirdsCaribbean is pleased to invite applications for a five-day training workshop focused on shorebird and waterbird identification and CWC survey methods. Participants will strengthen their …| BirdsCaribbean
The 60th anniversary of the International Waterbird Census (IWC) is coming up! We’d love for the Caribbean to contribute to the celebration that Wetlands International is planning. They are collect…| BirdsCaribbean
A deep dive into how JavaScript source maps work under the hood, with examples showing how all the pieces fit together.| Do more with less. | Polar Signals
Our power supply is normally pretty reliable, but last week we had a an outage. Although we've got solar, we don't (currently) have an islanding switch, so when the grid goes down, so do we. This power outage only lasted about 45 minutes, but came at a really bad time: I was due to be interviewing someone, so had to try and get signal so that I could at least send a SMS and tell them that we'd need to re-schedule. I used to have a UPS, but didn't replace it after the battery reached end-of-li...| www.bentasker.co.uk
We are debugging one issue with memory usage in Kubernetes Pods, and decided to look at the memory and number of processes on the nodes. The problem is that a Kubernetes Pod with Livekit usually consumes about 2 gigabytes of memory, but sometimes there are spikes of up to 10-11 gigabytes, which causes the Pod… Read More » The post Kubernetes: monitoring processes with process-exporter first appeared on RTFM: Linux, DevOps, and system administration.| RTFM: Linux, DevOps, and system administration
Configuring AWS OpenSearch Service cluster monitoring with CloudWatch, monitoring JVM memory and k-NN, creating Grafana dashboards and alerts in Alertmanager| RTFM: Linux, DevOps, and system administration | DevOps-engineering, and syst...
We’ve just published our annual report about radioactivity in food and the environment. Our radiological monitoring and assessment specialists Becca Williams and Rob Dean share the headlines from our monitoring and assessment work and talk about how artificial radioactivity gets into the environment.| Creating a better place
I use NixOS by the way. And today I’m going to show you how to operate a simple Icinga setup using that operating system. I.e. a single node with checks and notifications. In contrast to Icinga Web 2 or Redis, NixOS provides an Icinga 2 package, but no module. Practically speaking, this means you can’t just write something like services.redis.enable = true; in your NixOS configuration. Instead, a complete systemd service is required as well as the user and group icinga2 the daemon default...| Icinga
Looking for Nagios alternatives? Learn why Icinga, a complete rewrite of the original Nagios fork, is the best Nagios alternative with modern architecture, automation, and pricing.| Icinga
Together, with renowned bat experts, River Partners looks to learn more about how bats live and how we can help them thrive The post What Bats Are Telling Us about Life in the Central Valley first appeared on River Partners.| River Partners
Many years ago, when developing complex automated procedures for a large company, I realized that my automation needs monitoring components. Including understanding heavyweight lock contention – for example, to recognize situations when a poorly designed change is blocked by things like autovacuum running in transaction ID wraparound prevention mode (it doesn't yield to anybody, when in this mode).| PostgresAI
Written by Efin Muttaqin, Programme Manager for the Rekam Nusantara Foundation, and Jo Murray, Marine Wildlife Trade and Bycatch Lead at Cefas. “The greatest challenge of the 21st century is to raise a new generation that understands the importance of …| marinescience.blog.gov.uk
We’re in the middle of a step change for national-scale environmental evidence in England. In recent years, the Natural Capital and Ecosystem Assessment (NCEA) programme has allowed us to create and upgrade maps and data products like the England Peat …| Natural England
From international pledges to pioneering reintroduction projects, it’s been an exciting year for England’s fungi. Natural England Mycologist, Matt Wainhouse, reflects on remarkable year for fungal conservation. Fungi on the global agenda Fungi have often missed out in the global …| Natural England
Wireshark is a network protocol analyzer. It captures live packet data from a network interface and decodes it to reveal the underlying protocols and their| Nagios Library
What’s Launching This Week AI Agent for Dashboards We’re fundamentally changing how teams interact with observability dashboards. Our enhanced AI Agent now doesn’t just analyze your data, it acts as an extension of your team to analyze dashborads for you, extract insights and help you act on these insights. See it in action: You don’t […]| The Logz.io Blog — DevOps, Logging, Metrics, Tracing, and Security
Why LLM Observability Tools Are Essential In 2025 Organizations are adding GenAI to their current and future architectures and product roadmaps, requiring Ops teams to ensure LLMs are accurate, fast, secure and cost-efficient. LLM observability tools directly addresses these needs, helping identify and prevent common LLM errors and issues: LLM observability provides the telemetry data […]| The Logz.io Blog — DevOps, Logging, Metrics, Tracing, and Security
I just submitted a MySQL Contribution and I would like to gather feedback about it. Depending on the received feedback, I might submit an updated contribution. The contribution is Counters for Slow InnoDB Sync Reads, and its goal is to make MySQL easier to operate on “complex” IO subsystems (like network drives in the cloud). The bug report / feature request Bug #117740 :| J-F Gagné's MySQL Blog
IT professionals are 1.4 times more likely to disengage and "quiet quit" their jobs in the next 6 months compared to other knowledge workers.| Help Net Security
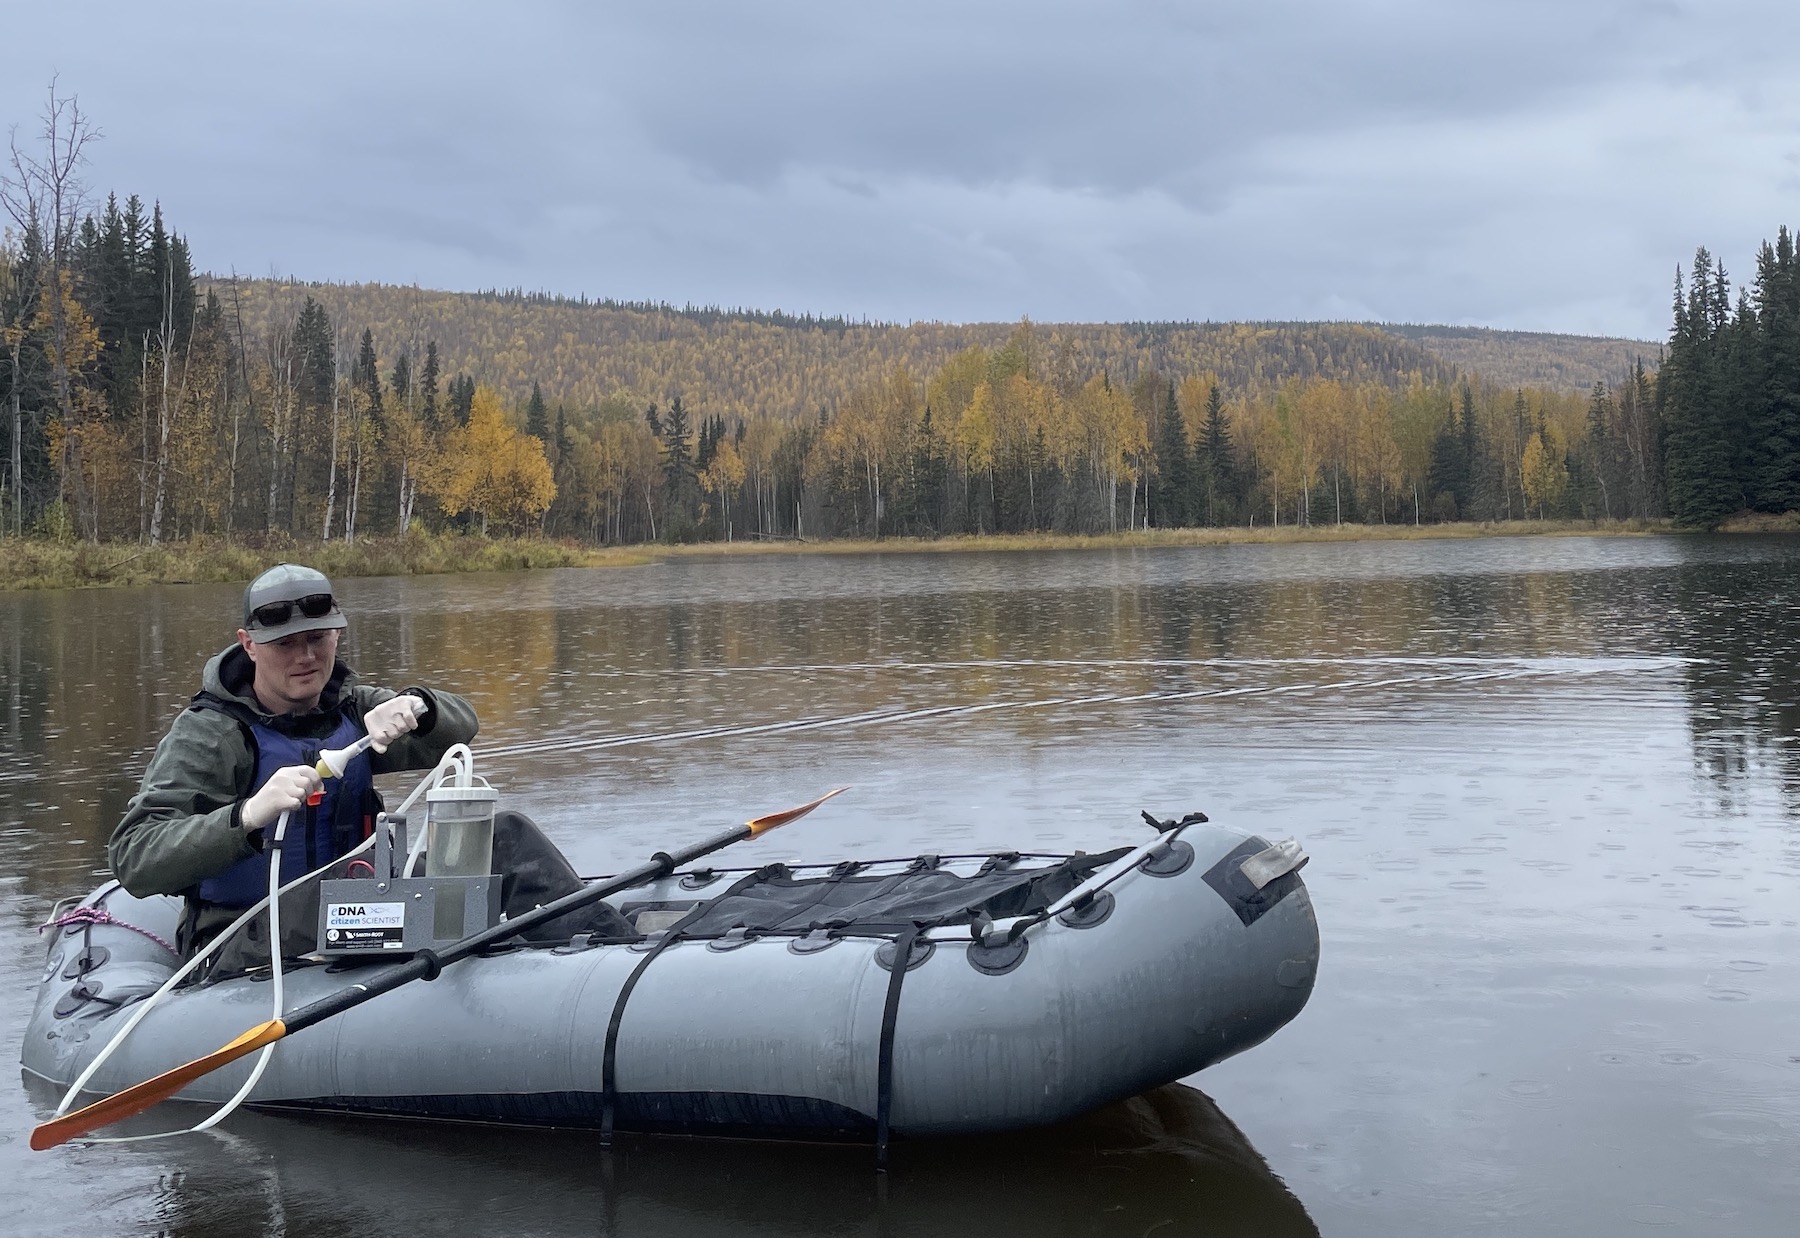
On this rainy September afternoon, Erik Schoen vacuums water from a backwater slough. The liquid will tell him if there are predators in this body of water.| www.uaf.edu
A comprehensive guide on where and how to instrument metrics in your applications, covering everything from API endpoints to background jobs| Pierre Zemb's Blog
The Oil Sands Mine Water Steering Committee has released four new recommendations for Alberta and the federal government, calling for new treatment technologies, increased community involvement in monitoring programs, the establishment of standards for releasing treated oil sands mine water, and advancing end pit lakes. Alberta’s government announced on September 5 that it accepts all […] The post Alberta endorses four new steps for oil sands water reclamation appeared first on Environmen...| Environmental Science & Engineering Magazine
A southwestern Ontario sod farm and its director have been fined after years of failing to meet provincial water reporting requirements and submitting inaccurate information to regulators. The case also revealed problems with an on-site well that had not been properly documented or disinfected before being put into use, according to a August 2025 court […] The post Ontario sod farm fined $26K for false reports, well infractions appeared first on Environmental Science & Engineering Magazine.| Environmental Science & Engineering Magazine
A private utility that serves a B.C. ski resort has been fined nearly $120,000 for a series of wastewater treatment compliance issues that includes a history of failing to employ qualified operators. B.C.’s Natural Resource Compliance and Enforcement Database flagged several issues in an administrative penalty report covering Hemlock Utility Services Ltd.’s management of the […] The post B.C. ski resort’s wastewater utility fined for failing to employ qualified operator appeared f...| Environmental Science & Engineering Magazine
Дебажимо одну проблему з використанням пам’яті в Kubernetes Pods, і вирішили подивитись на пам’ять і кількість процесів на нодах. Сама проблема полягає в тому, що зазвичай Kubernetes Pod з Livekit споживає близько 2 гігабайт пам’яті, але іноді бувають спайки до 10-11 гіг, через що под вбиває...| RTFM: Linux, DevOps та системне адміністрування
Налаштування моніторингу кластеру AWS OpenSearch Service з CloudWatch, та моніторинг пам'яті JVM та k-NN, створення Grafana dashboard та алертів в Alertmanager| RTFM: Linux, DevOps та системне адміністрування | De...
When Production Goes Sideways Imagine this: It's 2 AM, your phone buzzes with an alert, and your dashboards are screaming. Production is down. Sound familiar? An automated health check has failed, and your internal dashboards are showing a spike in errors. You've just pushed a new release that included a critical database schema change, and a background worker task that relies on it is now failing. The web application is still running, but users are starting to report issues. You need to inve...| Heroku
Modern cloud-native architectures are composed of multiple microservices running across dynamic environments. Effectively diagnosing performance issues, bottlenecks, or failures requires comprehensive observability. For this, many organizations look to OpenTelemetry, which provides a standardized approach to capturing and analyzing telemetry data. Fir is Heroku’s next generation cloud platform , designed to offer more modern cloud-native capabilities with flexibility and scalability. It’s...| Heroku
Managing event-driven architecture can be challenging. For many organizations, this includes a diverse set of eventing services and buses, often across multiple organizations. Developers must manage authentication and pub/sub services across teams and applications. We’re thrilled to introduce Heroku Eventing, a powerful tool designed to help teams manage events more efficiently and securely. This new feature simplifies the process of integrating and monitoring events from various sources, e...| Heroku
If your cloud application performs poorly or is unreliable, users will walk away, and your enterprise will suffer. To know what’s going on inside of your million-concurrent-user application (Don’t worry, you’ll get there!), you need observability. Observability gives you the insights you need to understand how your application behaves. As your application and architecture scale up, effective observability becomes increasingly indispensable. Heroku gives you more than just a flexible and...| Heroku
Lost logs in VictoriaLogs and Loki with the “rate limit exceeded” error, and basic monitoring of VictoriaLogs ingested logs with LogsQL and alerts| RTFM: Linux, DevOps, and system administration | DevOps-engineering, and syst...
The OpenTelemetry Astronomy Shop demo has long served as a reference environment for exploring observability in distributed systems, but until now it shipped with only a Prometheus datasource. VictoriaMetrics forked the demo and extended it with VictoriaMetrics, VictoriaLogs, and VictoriaTraces, providing insights into VictoriaMetrics’ observability stack where metrics, logs, and traces flow into a unified backend.| VictoriaMetrics
Learn how to build a resource monitor with QuestDB and Grafana, and visualize system resource usage data. Also learn how to correlate application events with resource utilization!| QuestDB Blog
The crew investigates a scientific outpost that has gone dark. They arrive to find the inhabitants have achieved "total observability," logging every single action, thought, and system metric. They are now so overwhelmed with data that they are paralyzed, unable to find the signal in the noise.| Seuros Blog - Navigation Logs from the Ruby Nebula
Learn about observability & OpenTelemetry. Discover the importance of telemetry data & how OpenTelemetry standardizes it, making your life easier!| ITGix
Learn about the top Model Context Protocol (MCP) gateways in 2025 and how Moesif adds analytics and observability on top for your AI infrastructure.| Comparing MCP (Model Context Protocol) Gateways | Moesif Blog
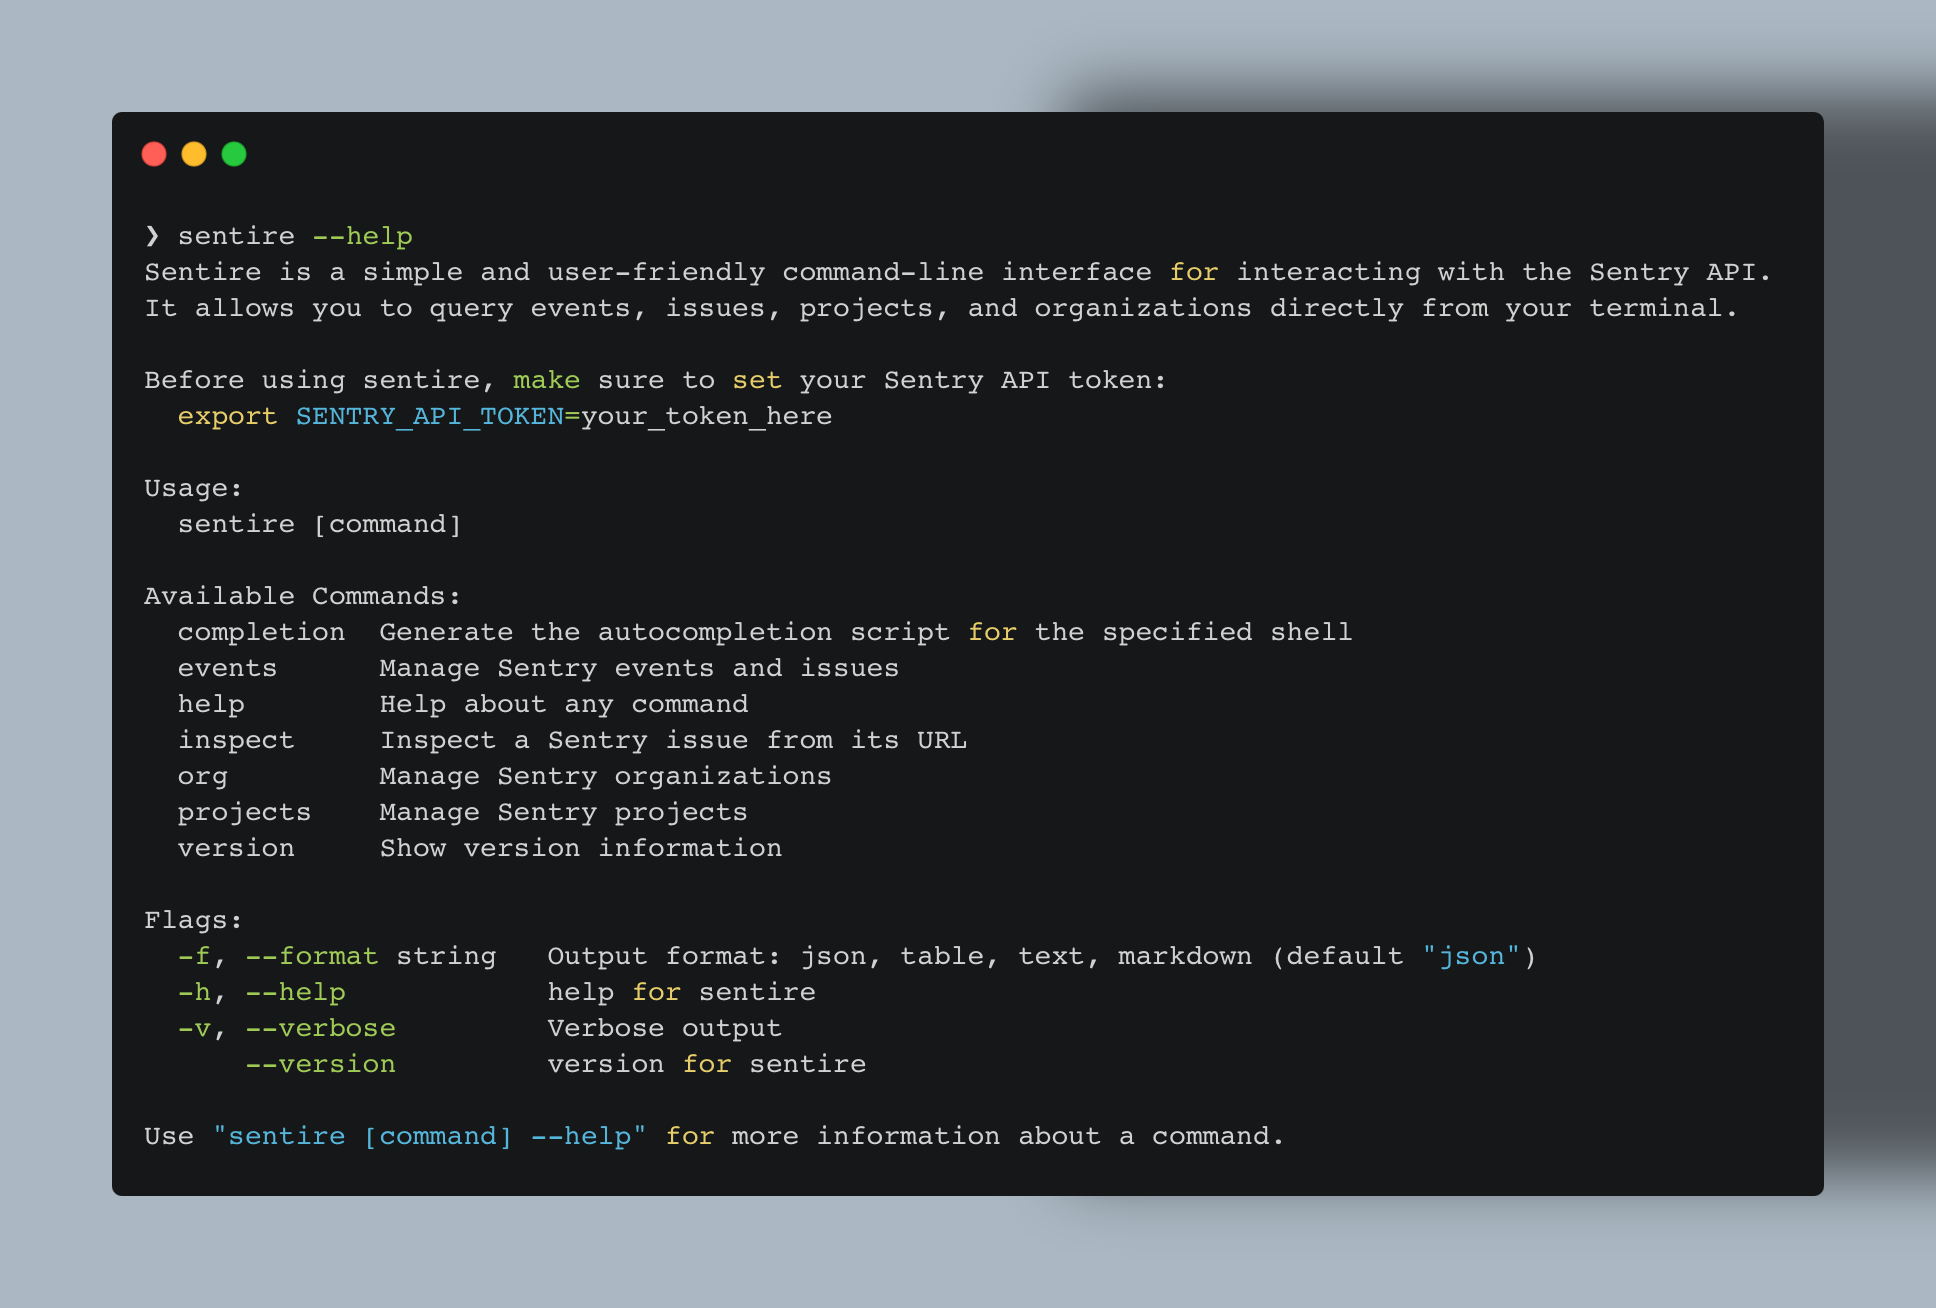
Introducing Sentire, a powerful command line interface for interacting with Sentry API, enabling developers to manage error tracking and monitoring directly from the terminal.| Andrea Grandi
Learn how to win Strava KOM segments with expert strategies, including segment analysis, optimal conditions, gear optimization, and the role of technology. Discover tips for maintaining your KOM once you've earned it.| BrianChristner.io
New Relic’s PageViewTiming data set provides excellent visibility into important performance metrics such as Core Web Vitals. When analyzing this data it can be useful to segment it by “page type” — for example, on an ecommerce website it can be helpful to know LCP or CLS scores for the product detail page, or product listing page individually. While it’s possible to view performance metrics for specific page URLs via the default pageUrl field, a website can have thousands (or more)...| Max Chadwick
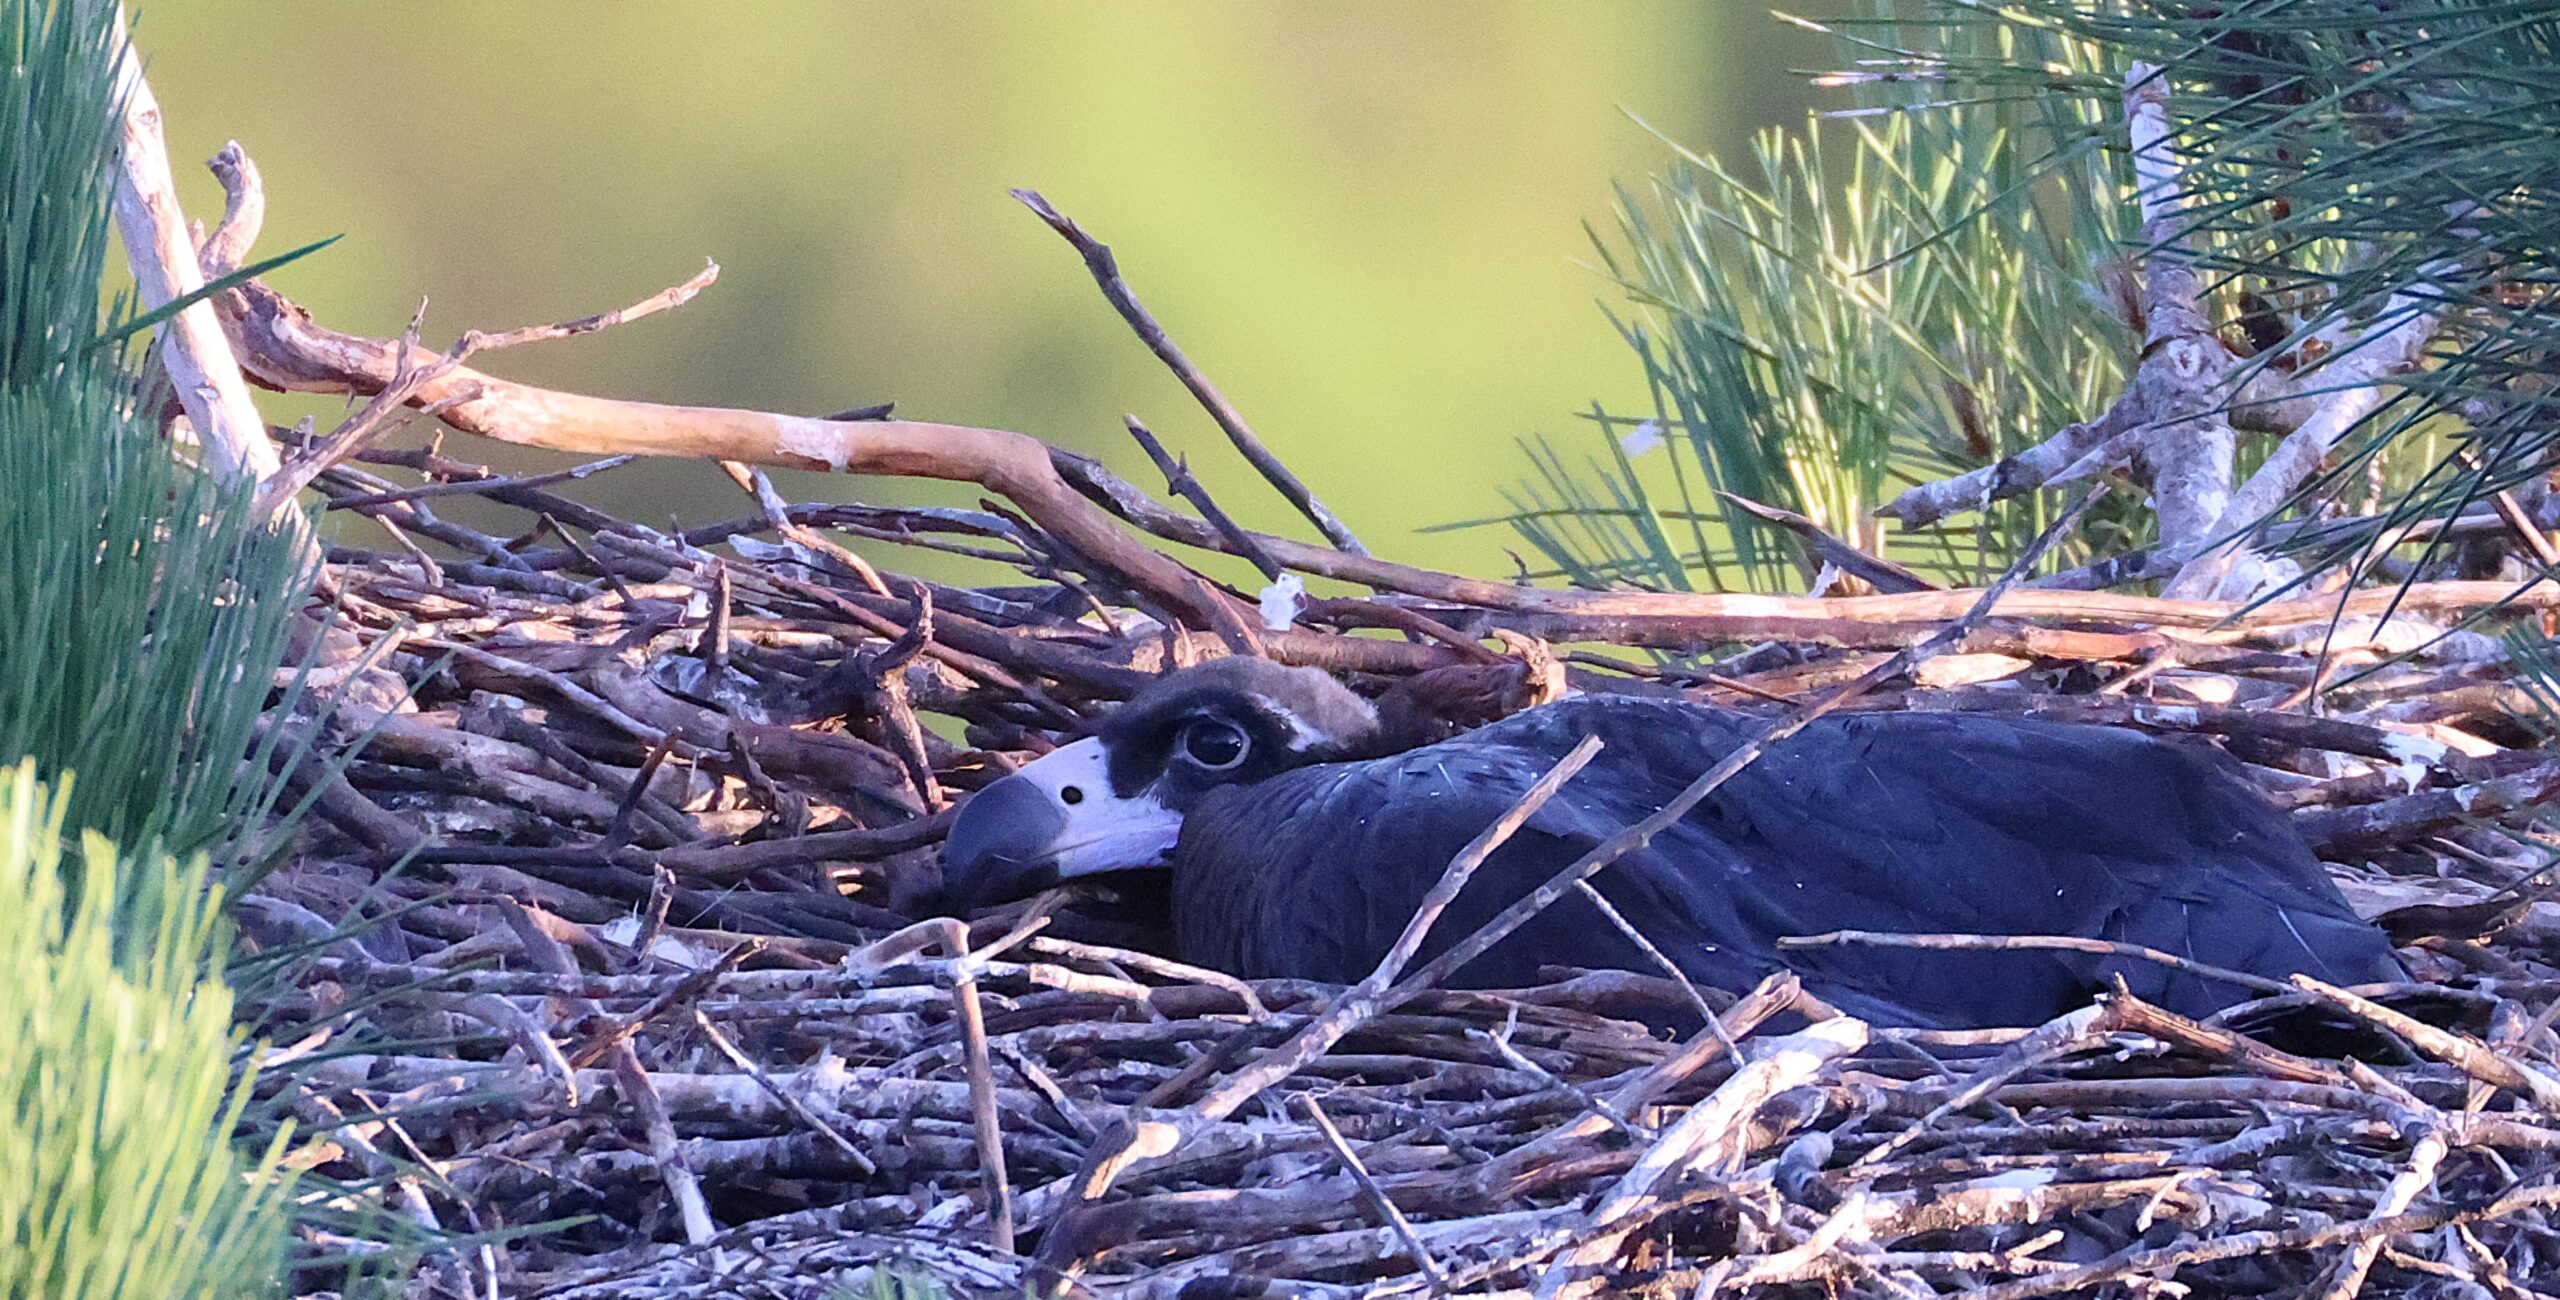
The mortality rate of the monitored birds stands at 18% and is largely caused by human factors. The 2025 breeding season – the third closely monitored by the LIFE Aegypius Return project – is nearing its end. This year, nine Cinereous Vulture chicks were tagged in the nest, and the work was featured on national […]| Vulture Conservation Foundation
Discover 7 reliable APM tools that help you monitor performance, spot issues early, and keep your applications running without surprises.| Last9 Blog: Exploring the Realm of Monitoring, Observability, and Reliability...
Unlike your lawn, which benefits from a regular mowing to stay healthy and looking nice, a database isn’t meant to be regularly shrunk just to keep its size under control. The grass grows to …| Chad Callihan
Monthly expert-led Postgres database health assessments with AI assistance. Get comprehensive reports, expert calls, and proactive monitoring to prevent performance issues and scale confidently.|
A monitoring solution built specifically for PostgreSQL experts who need rapid root cause analysis and deep performance insights. Combines real-time monitoring with deep analysis capabilities for human experts and AI systems.|
Discover 10 takeaways from Apply 2025 on real-time ML, feature stores, observability, and scaling AI systems from leaders at Tecton, Atlassian, AWS & more.| Tecton
Have you ever heard of stolen memory in SQL Server? I’ve never had any significant issues with stolen memory myself, but I thought it would make for a good blog post. Let’s take a look …| Chad Callihan
See how Zabbix created a monitoring solution for Doğan Trend Automotive that allows for seamless operations and an efficient alert system.| Zabbix Blog
RIPE Atlas is a global, open, real-time distributed Internet measurement platform, consisting of over 12,000 probes and more than 800 anchors| Chris Grundemann
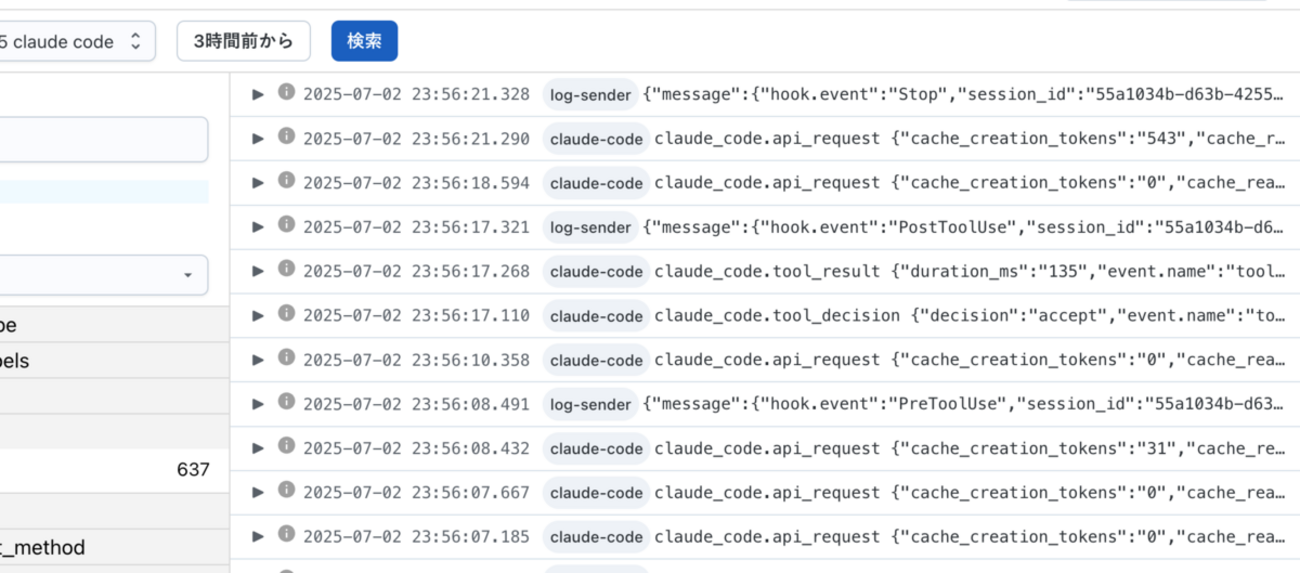
Monitor MCP server security and agent behavior with Moesif. Detect misuse, set alerts, and gain visibility into Model Context Protocol traffic.| Monitoring MCP Security and Agent Behavior with Moesif | Moesif Blog
Much like the low-fluid warning light in a car, a new wearable sensor linked to a smartphone app is set to alert people when their hydration levels are dangerously low. The device could be a big help to athletes, first responders, and many others.| New Atlas
In this release, the maxFiles parameter in Open Liberty’s access logging configuration is enhanced. This change improves log file cleanup and helps ensure that all matching log files in the output directory are considered, not just those generated by the current process.| openliberty.io
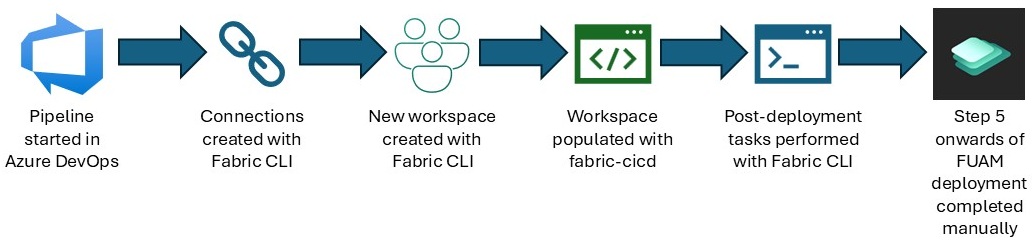
Reading Time: 3minutesIn this post I share some tips for implementing FUAM in Microsoft Fabric. Since I have seen multiple questions relating to FUAM appear online. To… The post Tips for implementing FUAM in Microsoft Fabric appeared first on K Chant.| K Chant
Приклад переносу метрик VictoriaMetrics та логів VictoriaLogs між двома кластерами Kubernetes з використання vmctl та rsync| RTFM: Linux, DevOps та системне адміністрування | De...
SNMP traps are a powerful monitoring approach but can be tough to configure for monitoring. That's where NXTI (the Nagios XI SNMP Trap Interface) comes in!| Nagios Library
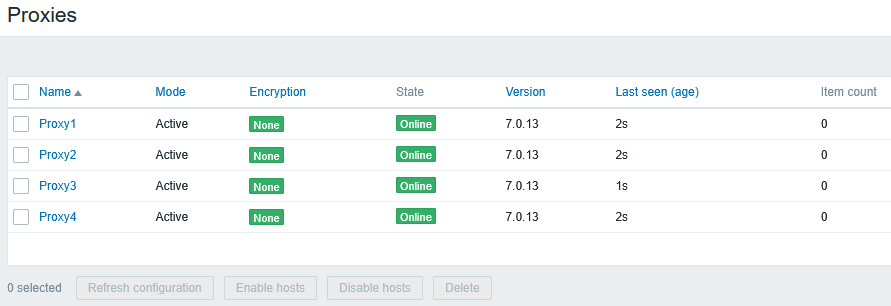
Let’s do some Docker networking with Zabbix proxies. The presented Docker configurations apply to other similar client-server applications as well, so you may find this useful even if you don…| Majornetwork
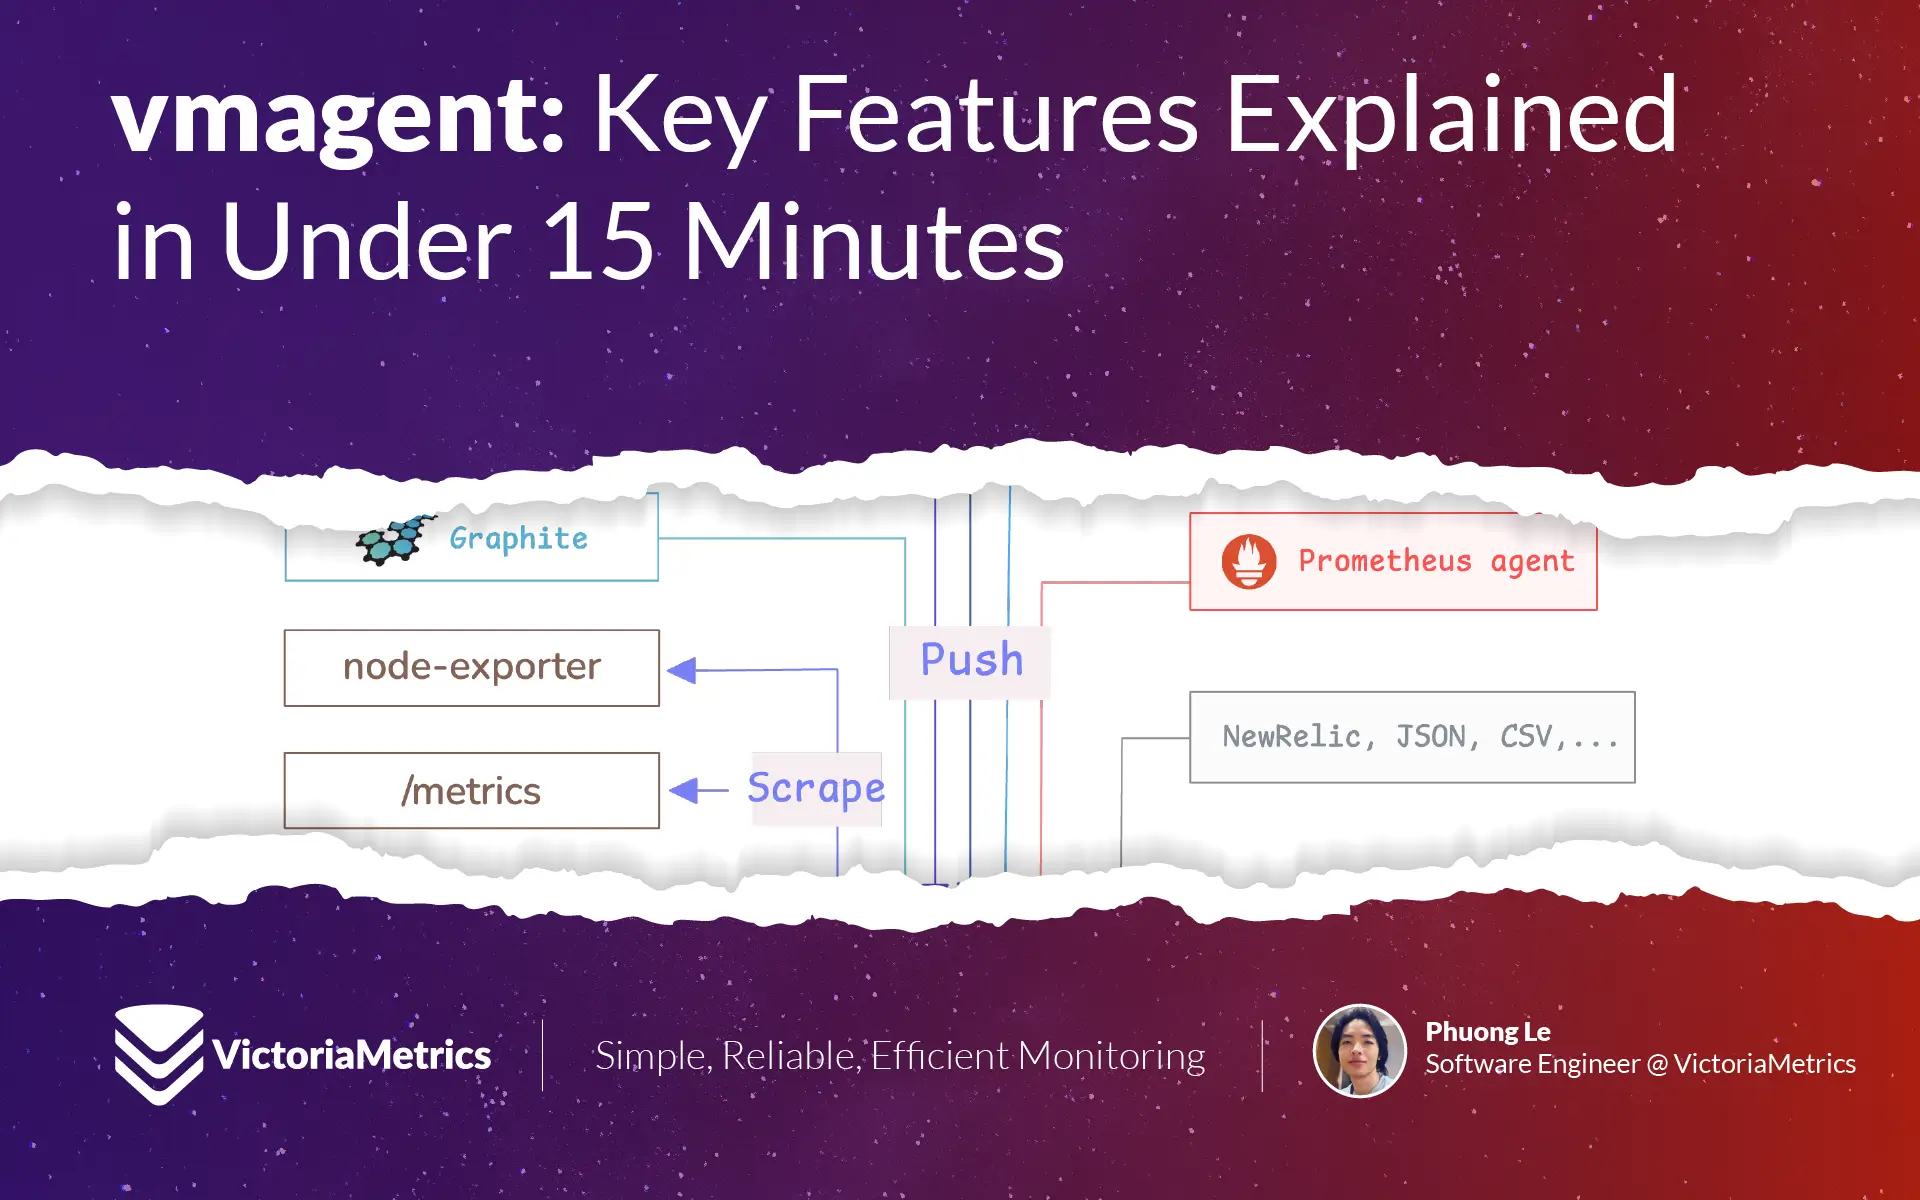
vmagent is a lightweight agent for collecting and forwarding metrics to remote storage. It supports relabeling, sharding, replication, aggregation, deduplication, and disk buffering to ensure reliable and efficient metric delivery.| VictoriaMetrics
We recently had solar installed and I wanted to be able to pull stats from the inverter down into InfluxDB so that I could use the metrics to monitor system efficiency as well as for various bits of a| www.bentasker.co.uk
Turn alerts into action, not noise. Our May 22nd Tech Talk (10 AM PDT) dives into vmalert best practices. Learn to configure, write effective rules, and optimize your VictoriaMetrics alerting strategy. Don’t miss out!| VictoriaMetrics
We’re happy to announce that VictoriaMetrics and IHI Terrasun Solutions, a leading energy storage system integrator, have partnered on one of North America’s largest clean energy projects!| VictoriaMetrics
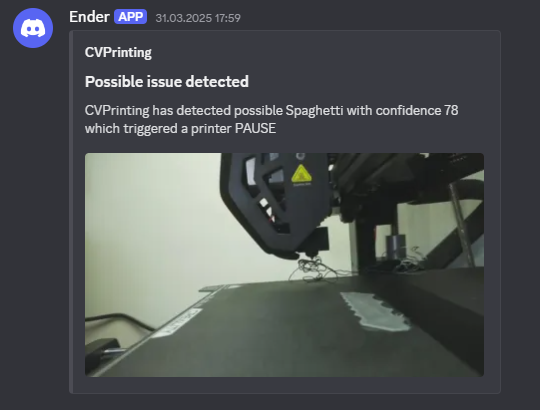
Computer vision for detecting issue during 3d printing with automatic notification to Discord and Telegram and pausing the print. This plugin has minimal HW requirements. Recommended hardware is Raspberry pi 5, older version are not supported.| OctoPrint Plugin Repository
This review aims to advise the UK Government – and other stakeholders – on whether the regime is working as intended, so that they can consider if any improvements should be made.| Competition and Markets Authority
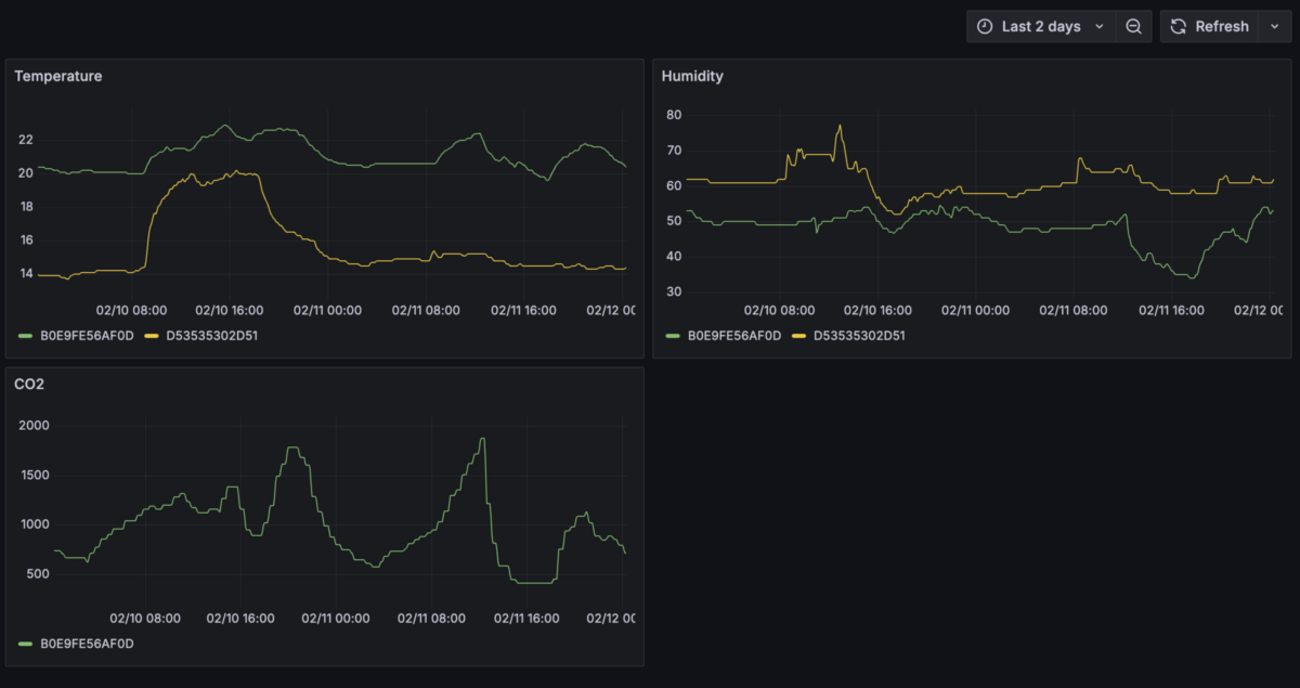
RuuviTag is a small battery-powered sensor that measures temperature, humidity, air pressure and movement. It communicates the measured data by broadcasting the data values using Bluetooth. I’…| Majornetwork
Lachlan Penfold has worked with some of the world's most successful clubs across numerous sports from rugby to the NBA to water polo. While he is an innovative physical performance coach, one theme ke| HMMR Media
Dit artikel belicht de belangrijkste metadata aspecten van een saasplatform en waar je voor moet zorgen om aan privacy regelgeving te voldoen. Met het lezen van dit artikel leer je: over de verschillende aspecten die horen bij SaaS-implementaties welke voorzieningen je moet treffen m.b.t. privacywetgeving aan de hand van simpele voorbeelden hoe je dat kunt […] Het bericht SaaS data verwerking in het licht van privacy verscheen eerst op CAP5.| CAP5