Learn how to analyze order book imbalance (OBI) data using QuestDB’s array types. This tutorial uses synthetic Bitcoin order book data to demonstrate metrics, queries, and Grafana visualizations for market imbalance and spoofing detection.| QuestDB Blog
Grafana Labs today announced the general availability of Grafana Assistant, a context-aware AI agent, along with the public preview of AI-powered Grafana Assistant Investigations, which extends Grafana Assistant to accelerate multi-step incident investigations. “AI is transforming every part of the software lifecycle, and observability is no exception,” said Tom Wilkie, CTO at Grafana Labs. “With Grafana Assistant … continue reading The post This Week in AI Updates: Spacelift infras...| ITOps Times
Дебажимо одну проблему з використанням пам’яті в Kubernetes Pods, і вирішили подивитись на пам’ять і кількість процесів на нодах. Сама проблема полягає в тому, що зазвичай Kubernetes Pod з Livekit споживає близько 2 гігабайт пам’яті, але іноді бувають спайки до 10-11 гіг, через що под вбиває...| RTFM: Linux, DevOps та системне адміністрування
Налаштування моніторингу кластеру AWS OpenSearch Service з CloudWatch, та моніторинг пам'яті JVM та k-NN, створення Grafana dashboard та алертів в Alertmanager| RTFM: Linux, DevOps та системне адміністрування | De...
A tutorial on ingesting high frequency FX top-of-book data and running some analysis with some of QuestDB's latest SQL functions. We'll demonstrate using free, high resolution data from TrueFx.| QuestDB Blog
Learn how to calibrate VWAP (volume weighted average price) executions using QuestDB and Grafana for accurate marketing trading benchmarks and volume predictions.| QuestDB Blog
In this tutorial, we’ll use Kafka to stream weather data from the OpenWeatherMap API, store and process it with QuestDB, and create insightful visualizations with Grafana. Example code and easy-to-follow instructions.| QuestDB Blog
Source live market-data from exchanges via Databento, build dashboards in Grafana, and derive analytics to better understand the markets.| QuestDB Blog
In this post, we look at beautiful charts that track the European Central Bank FX rates, and then look at historical events that made a big impact. Made with Grafana and QuestDB.| QuestDB Blog
The Grafana Geomap panel is a powerful visualisation for showing static and moving objects on a map in realtime. In this tutorial, we'll look at how to use Grafana maps with QuestDB, and share tips and tricks along the way.| QuestDB Blog
Learn how to build a resource monitor with QuestDB and Grafana, and visualize system resource usage data. Also learn how to correlate application events with resource utilization!| QuestDB Blog
Discover how Coinbase and other exchanges generate revenue. We explore Coinbase's fee structures and trading strategies, using QuestDB's new window functions for real-time revenue analysis. Ideal for both tech and financial enthusiasts.| QuestDB Blog
Explore maritime traffic analysis through historical AIS data. Learn about AIS system capabilities, data conversion, and visualization techniques with heatmaps and time-series databases, offering a deep dive into vessel tracking and maritime patterns with QuestDB and Grafana.| QuestDB Blog
Visual and accessible exploration of the latest Bitcoin ETF releases in the U.S. Discover how market dynamics impact fair value, the role of market-makers, and the nuances of Premium and Discount in ETF pricing. Read before you trade!| QuestDB Blog
Explore a simulated real-time dashboard of NYC's taxi industry using historical data, showcasing dynamic visualizations of taxi flows, fares, tips, and hotspots for effective business management and analysis. Created with Grafana and QuestDB, a high performance time series database.| QuestDB Blog
Explore the significance of the yield curve in finance, its impact on investments, and market responses during events like the COVID pandemic, with a deep dive into time-bound SQL query analysis using QuestDB and Grafana for financial insights.| QuestDB Blog
Discover how to use the first_value() window function in SQL to normalize and compare time series data in Grafana. This article provides a step-by-step guide to creating more effective Grafana visualizations, with simplified queries and improved performance for data analysis.| QuestDB Blog
Learn how to use Grafana and QuestDB to analyze and visualize the dynamic, correlated relationships between assets like ETH-USD and BTC-USD. Examples and sample data included!| QuestDB Blog
Learn to build a custom trade watch with this tutorial. Aggregate and visualize market data for efficient trading using Grafana and QuestDB. Enhance your financial market analysis with our guide.| QuestDB Blog
Learn how to manage large lists of symbols efficiently with Grafana variables and QuestDB. This tutorial guides you through creating dynamic dashboards for real-time financial data analysis, making your data monitoring scalable and automated.| QuestDB Blog
Discover how to use QuestDB, Grafana, and Coinbase for moving average signals in trading. Learn to define moving averages, build indicators, and extract signals for profitable trading strategies.| QuestDB Blog
Azure IoT Operations is the Edge platform for Azure IoT, part of Azure IoT vNext (part of the stack based on the MQTT support for Azure EventGrid Namespaces and Microsoft Fabric Real-Time Intellige…| Sander van de Velde
Generate and visualize Collatz sequences in ClickHouse using recursive CTEs and arrayFold — all visualized in Grafana.| Altinity | Run open source ClickHouse® better
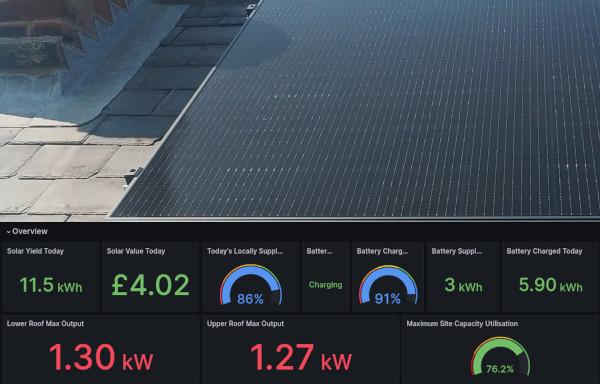
We recently had solar installed and I wanted to be able to pull stats from the inverter down into InfluxDB so that I could use the metrics to monitor system efficiency as well as for various bits of a| www.bentasker.co.uk
Generate an Nmap Dashboard using Grafana and Docker to get a clear overview of the network and open services. This weekend's project uses a similar technique to the previous Zeek Dashboard to build an easy to deploy dashboard solution for Nmap results. Building small deployments like this gives the operator a greater understanding of how […] The post Nmap Dashboard with Grafana appeared first on HackerTarget.com.| HackerTarget.com
We’ve been shipping Kubernetes to clients since 2015, and over the years, we realized it would be nice to have a setup that referred to some core distribution for our Kubernetes configuration. Read about our efforts creating a toolkit for our clients that make adopting it easy and affordable, transforming it from potential headache into just another comfortable tool in the toolbox for those clients who decide to use it with us.| evilmartians.com
In this article, we’ll talk about the process of deploying and managing a real-world application on a Kubernetes cluster using the Martian Kubernetes Kit| evilmartians.com
Запуск Vector.dev в Kubernetes з Helm, налаштування збору VPC Flow Logs з AWS S3, трансформації, і запис логів з новими полями до VictoriaLogs| RTFM: Linux, DevOps та системне адміністрування | De...
Building a Grafana dashboard for AWS VPC Flow Logs and Kubernetes using VictoriaLogs. Migrating Grafana Loki and LogQL queries to VictoriaLogs and LogsQL| RTFM: Linux, DevOps, and system administration | DevOps-engineering, and syst...
Створення Grafana dashboard з AWS VPC Flow Logs та Kubernetes з використанням VictoriaLogs. Міграція запитів Grafana Loki та LogQL в VictoriaLogs та LogsQL| RTFM: Linux, DevOps та системне адміністрування | De...
I've run kubernetes at home for quite some time, but because I was only using it as a sandpit didn't bother setting up monitoring. I've started using it for more productiony stuff though, so I decided| www.bentasker.co.uk
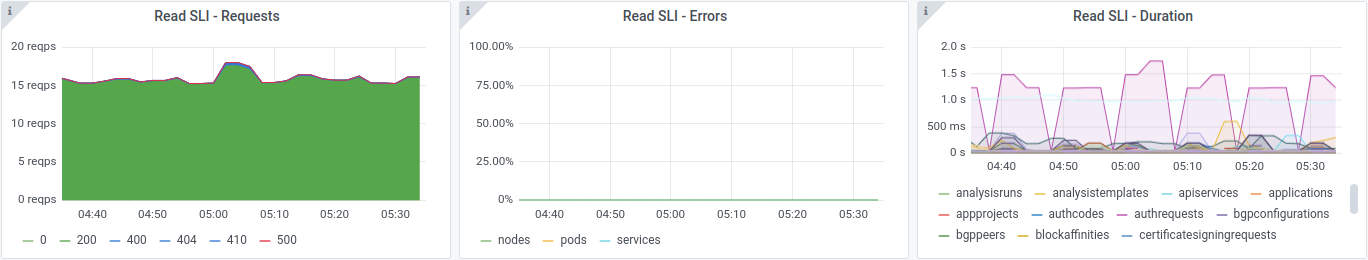
This is a complete guide to Kubernetes API Server SLO Alerts. In this new guide, you’ll learn: Kubernetes official Service Level Objectives (SLOs). What are Error Budgets? How to turn Error Budgets into alerts? What are Multiwindow, Multi-Burn-Rate alerts? What is this KubeAPIErrorBudget alert? Mixin’s Kubernetes API Server SLO alerts. Lots more. Kubernetes Service Level […]| Povilas Versockas
With over 380K downloads, the Vertica Grafana Data Source plugin just got an upgrade! The plugin was migrated from the deprecated older Grafana toolkit to align with Grafana’s new Create-Plugin […] The post Unveiling the Most Recent Version of the Vertica Grafana Data Source Plugin appeared first on OpenText™ Vertica™.| OpenText™ Vertica™
For a while, I have been looking for a smokeping alternative for latency monitoring from different servers spread around. While smokeping has survived well over time, in 2023 it feels like an outdated package, with limited options, lacks federation etc. This post from Karan Sharma / Zerodha on “Monitoring my home network” was exciting. His setup included a telegraph agent on a local server, Prometheus to scrap data and Grafana to draw latency data. I explored doing the same but in a distr...| Personal blog of Anurag Bhatia
In this article, we will be looking into how we can monitor our Spring Boot application using Grafana. We would be looking into the whole setup and create a simple dashboard to view some metrics.| RefactorFirst
Grafana is a great tool for visualizing data. In this tutorial I’ll be putting annotations, or comments on points of interest overlayed on top of graph panels.| Chris Bergerons Tech Blog
Tonight I was introduced to a Deluge exporter for Prometheus so I figured I’d whip up a quick dashboard for visualizing the metrics. Deluge Dashboard is a very simple way to display Deluge torrent metrics. It uses the deluge exporter to populate a Prometheus data source. The panels in this dashboard can be copied into more comprehensive dashboards for a single pane of glass view of your network transfers or it can be used as a standalone glanceboard. You can install the dashboard from the G...| Chris Bergerons Tech Blog
Grafana is a really great tool for visualizing data. In my homelab, I have obviously have a lot of data so what better than to use than the right tool for the job. Below, you can find some screenshots of my dashboards. I use a raspberry pi that just runs a full screen browser for viewing the dashboard slideshow in addition to a few other glance boards (DAKBoard, Monitorr, et al). Here’s the Gallery| Chris Bergerons Tech Blog
I made a Grafana Dashboard for my Plex system at home. I feed various system telemetry into an influx database as the data source and Plex-Data-Collector for inserting the data from plex. Additionally, I wrote a python script for injecting logs from NZBGet into mysql. I then use Grafana to display the graphs. I really love Grafana and I’ve created several dashboards:| Chris Bergerons Tech Blog
Using Grafana with pfSense Update: 2018/09/13 pfSense has a plugin for telegraf which can be installed from the gui. I recommend this method rather than what I figured out below. I’m leaving these notes for manual installation reference. 2017/12/09 I put this guide together using information from various other blogs. This is current as of December 2017 and using pfSense 2.4.2. For this tutorial, you’ll need your IP or hostname of your influxdb data source and your username and password. T...| Chris Bergerons Tech Blog
I wrote a simple plugin for NZBGet that inserts download history into a MySQL database. Having my download list in a database makes operations on the data easier than groking text logs. I wanted to display my most recent downloads on a Grafana Dashboard: To use simply copy the Mysql-Log.py script into your NZBGet/scripts directory. In NZBGet, select settings and set the hostname of your MySQL instance. You can download the plugin on github| Chris Bergerons Tech Blog
Pihole + Grafana + InfluxDB Dashboard I wanted to add the metrics from my ad-blocker, the great Pihole to my executive dashboard. To create the dashboard I used Grafana to display the graphs and InfluxDB a the time-series backend database. I use a simple python script to get the metrics from pihole and record them in influxdb. Grafana makes it easy to render them into a user friendly dashboard. Installing Grafana and Influxdb is beyond the scope of this blog post but here is the scipt that I ...| Chris Bergerons Tech Blog
Grafana + InfluxDB + scripts = Awesome I have many interests and some of them have metrics that are useful or fun to watch. For example, I have investment in Bitcoin so it’s nice to be able to keep an eye on it periodically. I decided to create a graphical “at a glance” dashboard for myself. I chose Grafana as the user interface / front end and InfluxDB a the time-series backend database to store the metrics. I use various scripts and applets to populate the data into Influx and Grafana...| Chris Bergerons Tech Blog
Showing Webcal Calendar Events in Grafana 2020-02-12, 02:00 en iCalendar Webcal Calendar Grafana Prometheus Python I'm running a Grafana at home, with a dashboard giving me an overview over my day. It contains information like public transport departures or the guest WiFi's password. But the most…| s3lph.me
Automatically Rotating Guest WiFi Passwords With hostapd 2020-02-06, 02:28 en WiFi hostapd Grafana I like to have control over who gets on my networks and who doesn't. To obtain this level of control in my home network, I'm running a separate WiFi for guests, which among other things separates…| s3lph.me
Bringing Swiss Public Transport Departures to Grafana 2020-02-05, 02:26 de en SBB Public Transport Open Data Grafana Prometheus Update: The API endpoint used here has been deprecated, and a new endpoint is available. The updated script can be found on Gitlab. The Swiss Railways (SBB) provide a…| s3lph.me
SBB-Abfahrtszeiten in Grafana anzeigen 2020-02-05, 02:26 de en SBB Public Transport Open Data Grafana Prometheus Update: Der hier verwendete API-Endpunkt ist veraltet und wurde durch einen neuen Endpunkt ersetzt. Das aktualisierte Skript liegt auf Gitlab. Die SBB bieten unter…| s3lph.me
Grafana Loki on Arch Linux Grafana's has started a new project called loki as a prometheus for logs solution. For Arch Linux's infrastructure we where thinking about introducing logging altering for our services. Which sparked my curiosity into Loki as it looked like a simple, easy solution after watching the …| Jelly's blog