Oh Deer! Crochet Christmas Blanket - Stardust Gold Crochet
Christmas is just around the corner, make this adorable Oh DEER! Crochet Christmas Blanket - afghan free crochet pattern.| Stardust Gold Crochet
Christmas is just around the corner, make this adorable Oh DEER! Crochet Christmas Blanket - afghan free crochet pattern.| Stardust Gold Crochet
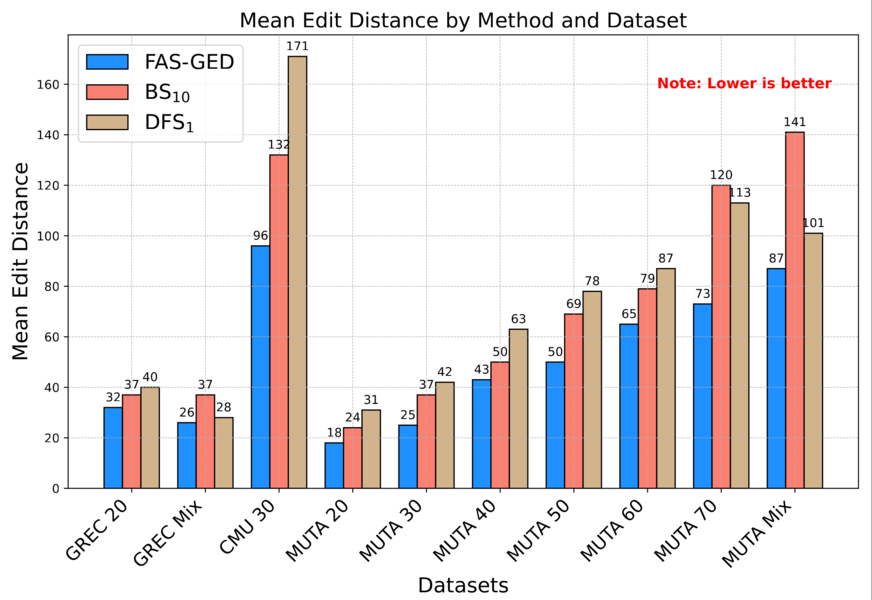
This document provides visual dictionaries for the interpretation of graph-plots of LLM-graphs.| Raku for Prediction
Easily include dynamic graphs in emails, PDFs, and more with Formidable Forms' new graph enhancement! Display your data visualizations anywhere, even in places where JavaScript can't run. Approximate read time: 5 minutes Data visualization should work everywhere your content goes. If you've wanted to include dynamic graphs in email notifications, PDF reports, or other contexts […] The post Add Charts and Graphs in Emails & PDFs with Formidable Forms! appeared first on Formidable Forms.| Formidable Forms
How Canva uses graph traversal to handle the complexity of getting print orders to our customers.| Canva - Engineering Blog

This blog post introduces and exemplifies the Raku package “LLM::Graph”, which is used to efficiently schedule and combine multiple LLM generation steps.| Raku for Prediction
Sparklines, how they were intended to be presented.| wok
Explore the best AI graph generators to turn raw data into clear, engaging visuals fast. Compare free and paid options for every need.| Venngage
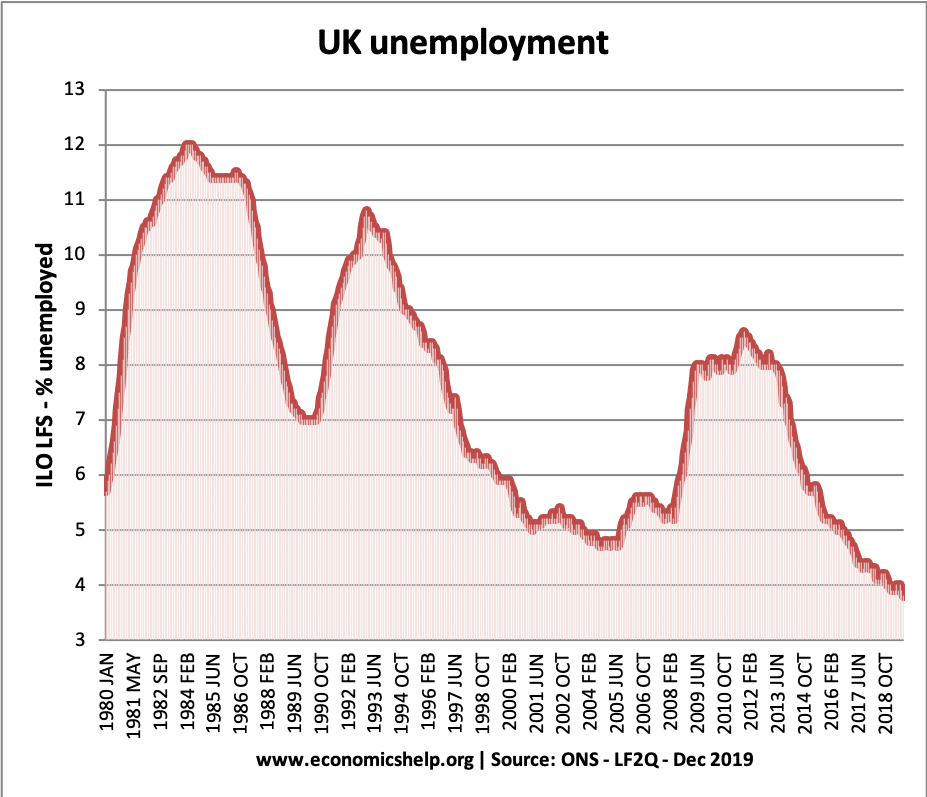
A selection of graphs and statistics on UK unemployment. Also, looking at factors that explain changes in UK unemployment. Why unemployment was lower in the 2000s and 2010s than 1980s and 90s. A success story of the UK economy? Raw data: Labour market data | Source: ONS MGSX (LFS)…| Economics Help
One network, with which many of my readers are familiar, is Facebook. At its core, Facebook is a network (graph) of users (nodes) connected by friendships (edges). Each user exists and experiences content within the confines of their Facebook subgraph, the portion of the network consisting of their friends. When analyzed properly, an individual’s friendship network paints a historical picture of his or her social engagement. Here I’ve created my Facebook friendship network …| Satoshi Village
Moving away from sparklines| wok
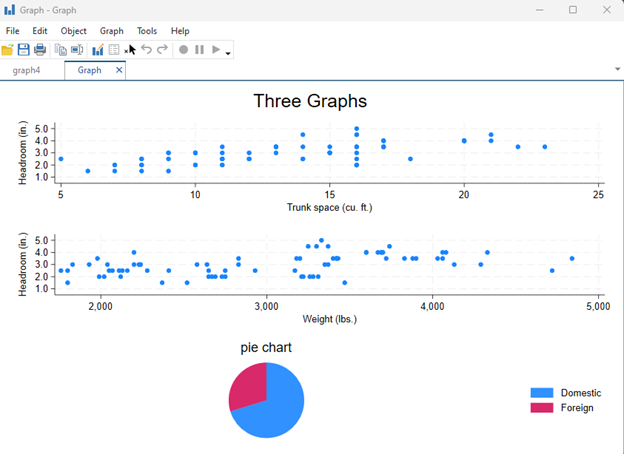
In this article we’ll walk you through the details of creating, naming, combining, saving, and exporting graphs in Stata.| The Analysis Factor
For those who have studied ERD-lore, it's not new that a relational database is very much like a graph. But it has taken SQL, more than 30 years since it became a standard and almost half a century since its inception to incorporate construct that will allow a DataBase to be treated as aGraph, DBaaG. This is surprising given that SQL was developed as language for relational databases which are modeled using ER diagrams. Better late than never. SQL/PGQ has arrived as 16th part of SQL:2023.| Walking with the Elephants
This blog post presents various visualizations related to the Collatz conjecture using Raku.| Raku for Prediction
Този блог пост представя различни визуализации, свързани с хипотезата на Колац, използвайки Raku.| Raku for Prediction

Are you getting ready to start your graphing unit? Let me help! I'm sharing my favorite books, hands-on activities, and easy ways to get kids learning to read, interpret, and create a variety of graphs.| Stories by Storie
$$ $$ The newest member of the AlgebraicJulia family is CliqueTrees.jl. Originally written as a backend to StructuredDecompositions.jl, the package has taken on a life of its own, and it is now used by packages across the Julia ecosystem. Its dependants include BayesNets.jl CausalInference.jl BandedMatrices.jl SumOfSquares.jl TSSOS.jl OMEinsumContractionOrders.jl SparseMatrixColorings.jl as well as the AlgebraicJulia packages StructuredDecompositions.jl and CategoricalTensorNetworks.jl. Cliqu...| AlgebraicJulia blog
Poster in institute repository: https://doi.org/10.34734/FZJ-2024-06811| JSC Accelerating Devices Lab

Use the Teaching Supplies Graph for your next corner to corner, mini c2c, tapestry (sc), hdc, dc, bobble stitch, cross stitch, etc. project!| Highland Hickory Designs

In this blog post, we explore some neat examples of graph computations using Raku. These examples are designed to be concise, straightforward, and compelling, showcasing the capabilities of Raku an…| Raku for Prediction
Nonclassical logics are often thought to be abstruse and exotic, but they arise naturally as the logic of connected spaces. In this post, we introduce the propositional logic of subgraphs, and more generally of sub-C-sets, and illustrate it with computational examples. The nonclassicality of this logic is seen to be not just natural but inevitable, and also surprisingly useful.| blog.algebraicjulia.org
Reflexive graphs are graphs where every vertex has a distinguished self-loop. While this may seem inconsequential, reflexive graphs have interestingly different properties than ordinary graphs owing to their different morphisms. We will see that reflexive graphs are more geometrical than graphs and also review the general notion of homomorphism between C-sets.| blog.algebraicjulia.org
Graphs are made up of vertices and edges, but an important variation on this concept is based on “half-edges” or “darts.” We explain how half-edge graphs are implemented as C-sets in Catlab.jl and how they are used in topological graph theory to represent embeddings of graphs in surfaces.| blog.algebraicjulia.org
Although I work for a mostly remote work company, a couple of times a year we meet together for a week in some nice location of the world. When that happens, multiple meetings across people in different teams are organized. Sometimes the number of requested sessions gets out of hands and the scheduling team is … Continue reading "How to schedule meetings in the minimal number of time slots"| Alfonso Sánchez-Beato's blog
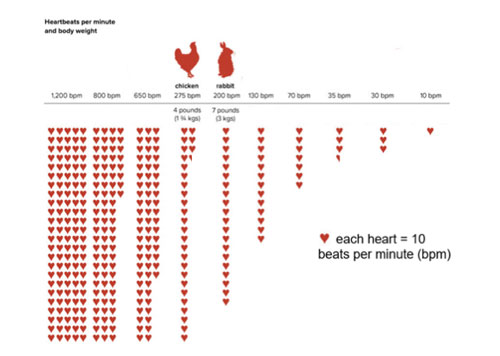
Have you ever tried a Slow Reveal Graph? This was my first experience—Heartbeats per Minute and Body Weights of Different Species. It was wonderful―for the class and for me.| MARILYN BURNS MATH
A (directed) graph is a set of nodes, connected by arrows (edges). The nodes and edges may contain data. Here are some graphs: All graphs made with graphviz (source) Graphs are ubiquitous in software engineering: Package dependencies form directed graphs, as do module imports. The internet is a graph of links between webpages. Model checkers analyze software by exploring the “state space” of all possible configurations.| Hillel Wayne
A key assumption of Granovetter’s (1973) Strength of Weak Ties theory is that strong ties are embedded by being part of triangles, whereas weak ties are not embedded by being created towards disconnected nodes. This assumption have been tested by calculating the traditional clustering coefficient on binary networks created with increasing cut-off parameters (i.e., creating […]| Tore Opsahl
This post highlights a generalisation of Freeman’s (1978) betweenness measure to weighted networks implicitly introduced by Brandes (2001) when he developed an algorithm for calculating betweenness faster. Betweenness is a measure of the extent to which a node funnels transactions among all the other nodes in the network. By funnelling the transactions, a node can […]| Tore Opsahl
The method used to operationalise ties’ strength into weights affects the outcomes of weighted networks measures. Simply assigning 1, 2, and 3 to three different levels of tie strength might not be appropriate as this scale might misrepresent the actually difference among the three levels (using an ordinal scale). In this post, I highlight issues […]| Tore Opsahl
The generalisation of the local clustering coefficient to weighted networks by Barrat et al. (2004) considers the value of a triplet to be the average of the weights attached to the two ties that make up the triplet. In this post, I suggest three additional methods for defining the triplet value. The content […]| Tore Opsahl

The average distance that separate nodes in a network became a famous measure following Milgram’s six-degrees of separation experiment in 1967 that found that people in the US were on average…| Tore Opsahl

Announcing the release of TensorFlow GNN 1.0, a production-tested library for building GNNs at Google scale, supporting both modeling and training.| blog.tensorflow.org

On a website called fanfiction.net, users write millions of stories about their favorite stories. They have diverse opinions about them. They love some stories, and hate others. The opinions are no…| Christopher Olah's Blog

This post proposes a local (node-level) version of the Weighted Rich-club Effect (PRL 101, 168702). By incorporating this measure into a regression analysis, the impact of targeting efforts towards…| Tore Opsahl
In my day job as a personal trainer, I find myself doing a lot of| startcodingnow.com

In recent years, there has been a significant amount of research activity in the graph representation learning domain. These learning methods help in analyzing abstract graph structures in information networks and improve the performances of state-of-the-art machine learning solutions for real-world applications, such as social recommendations, targeted advertising, user search, etc. This article provides a comprehensive introduction to the graph representation learning domain, including comm...| Sumit's Diary
