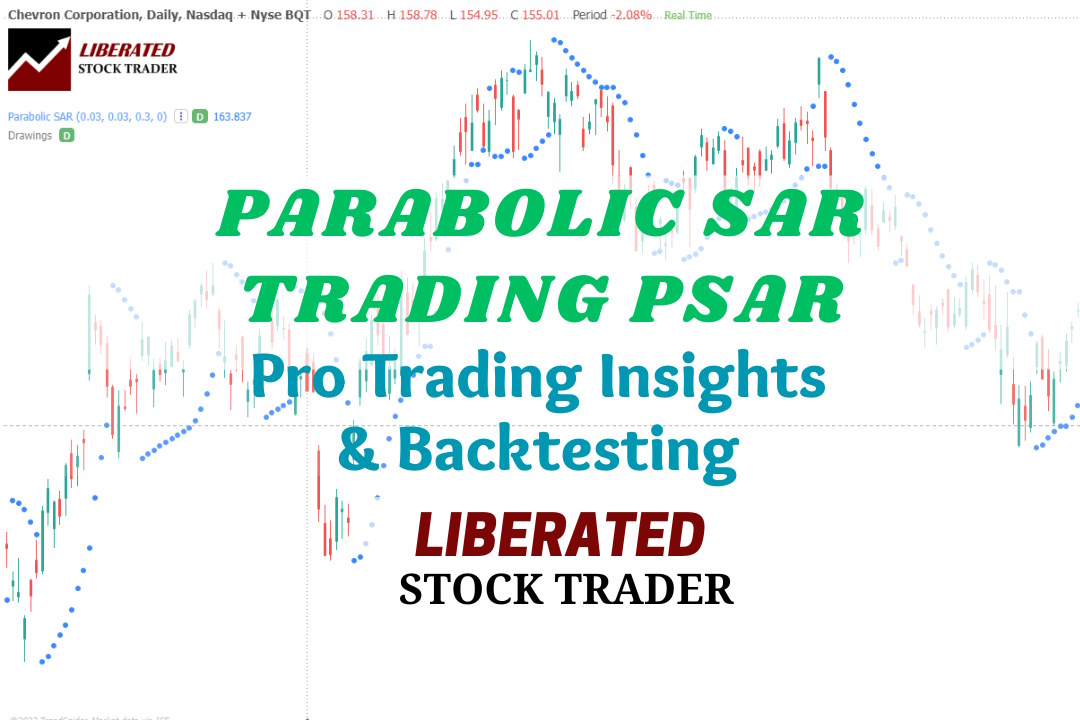
I backtested seven Parabolic SAR setups across 1-minute to daily charts for the DJ30 stocks over 12 years, resulting in over 2,880 years of test data. On standard charts, PSAR is not a profitable trading indicator. However, I did discover an incredibly profitable PSAR configuration.| Liberated Stock Trader
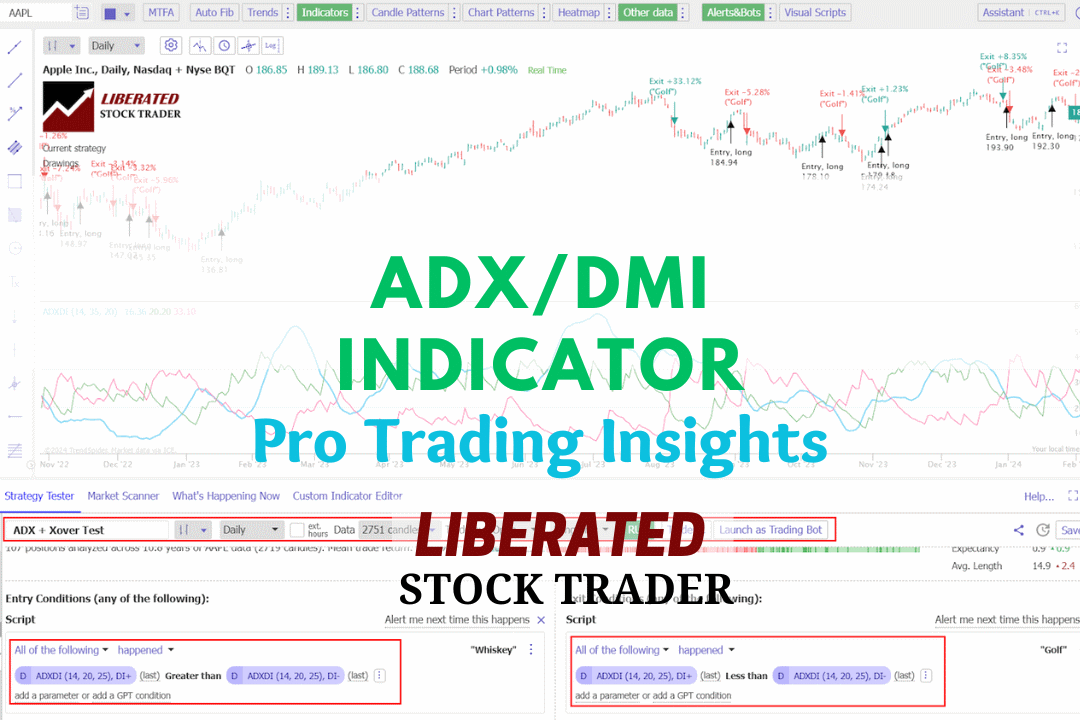
My testing, based on 9,764 trades over 25 years, demonstrates that the DMI indicator is both profitable and reliable, outperforming the S&P 500 index. Here's how to trade it based on the data.| Liberated Stock Trader
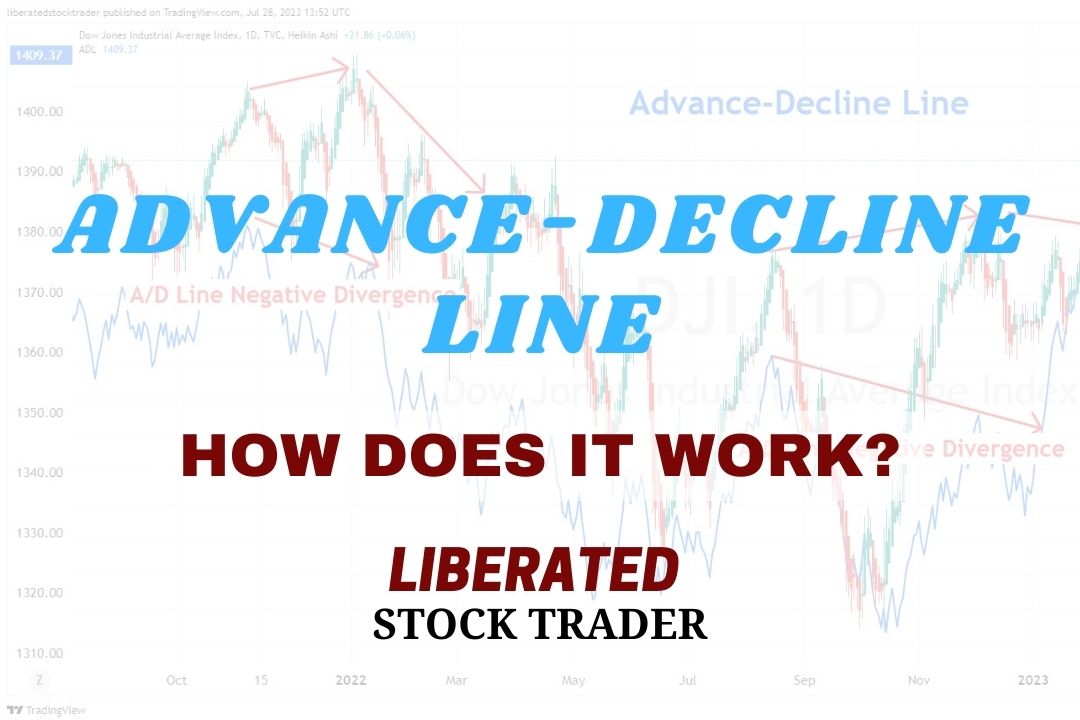
The advance/decline (A/D) line indicator measures market breadth by identifying how many stocks participate in a market advance or decline. It is calculated by taking the number of advancing stocks minus the declining stocks.| Liberated Stock Trader
As a Professional market analyst, I build effective trading strategies using techniques such as indicator divergences, multi-time frame analysis, indicator combinations, and rigorous backtesting.| Liberated Stock Trader
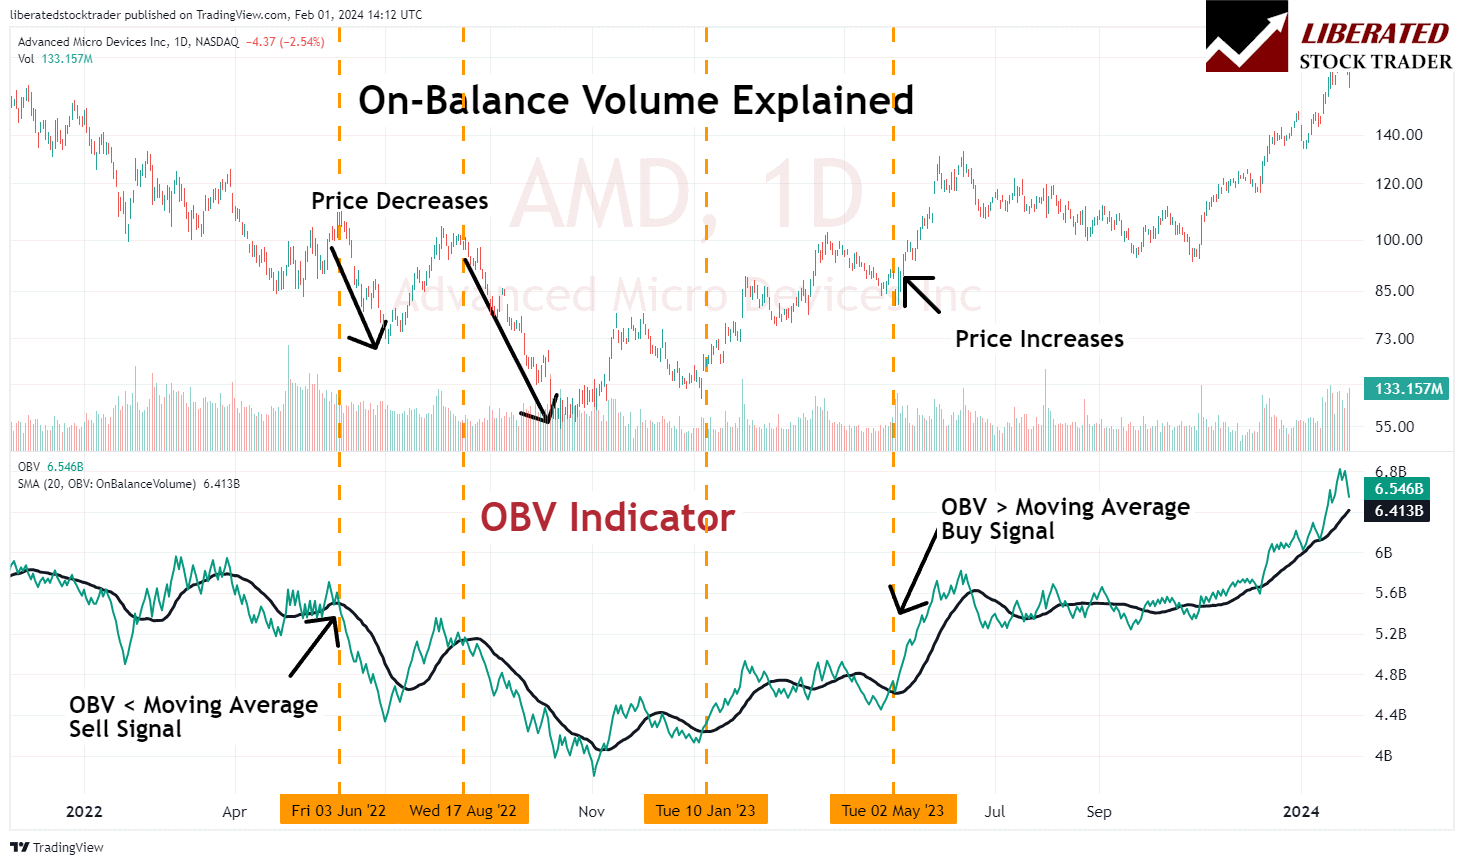
On-balance volume (OBV) is a cumulative indicator in technical analysis designed to show the volume flow relative to a security's price movements. The OBV reflects the collective buying and selling pressure crystallized through the volume trend.| Liberated Stock Trader
Among the many available indicators, the VWAP indicator—or Volume Weighted Average Price—is particularly popular for day trading. By analyzing price movements, volume, and market trends, the VWAP can offer valuable insights into when to buy or sell. It’s a key tool that blends both price and volume, giving traders a clearer picture of an asset's average trading price throughout the day.| Trading Education & Tools – Journals, Courses, and Pro Strategies
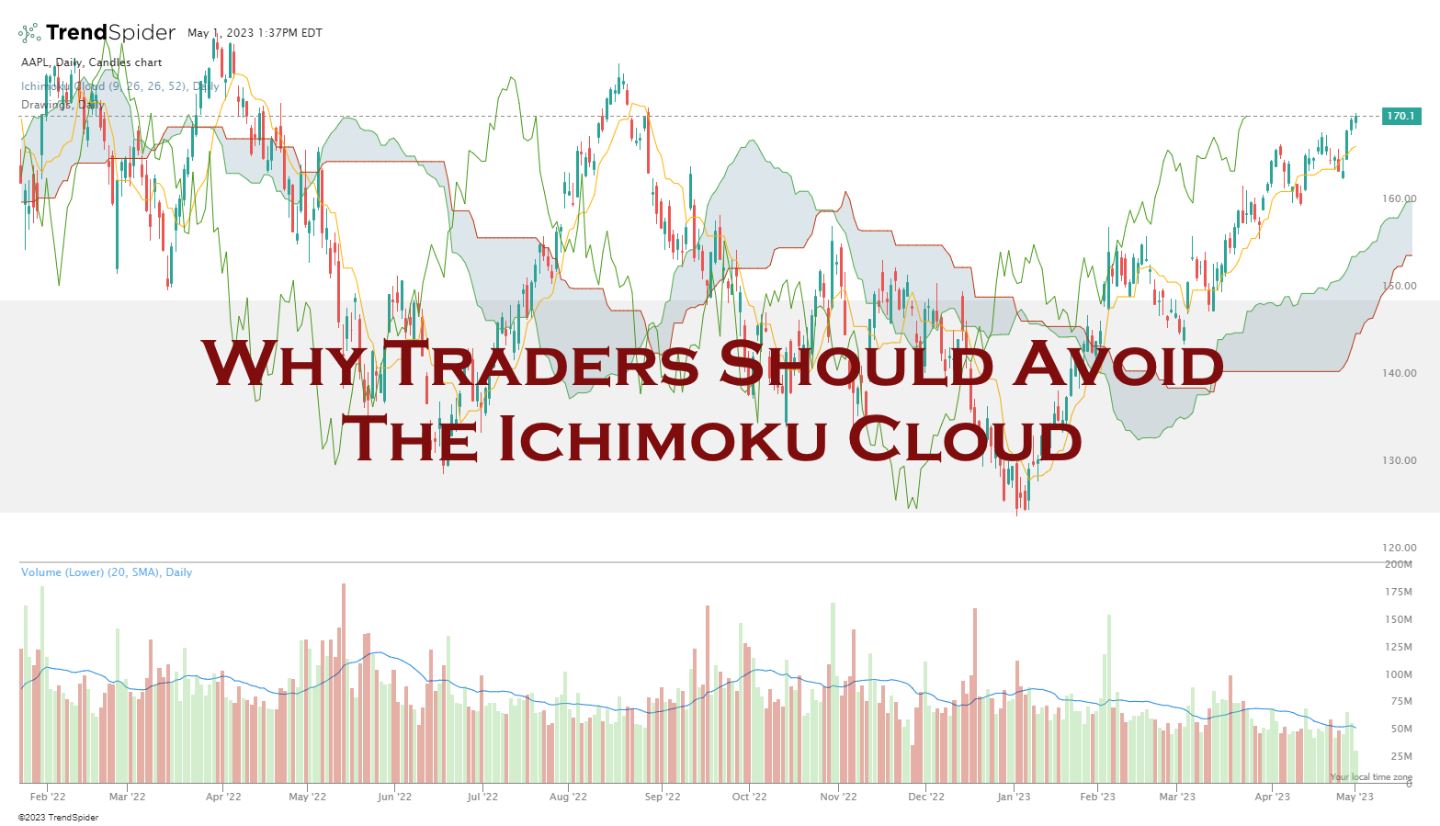
My Ichimoku testing indicates a dismal 10% win rate, underperforming a buy-and-hold strategy 90% of the time. The Ichimoku indicator is a poor choice for traders.| Liberated Stock Trader
I conducted 4,052 backtested trades using 307 years of exchange data to determine if the Supertrend is super! The Supertrend indicator is not profitable for swing traders using a standard daily candlestick/OHLC chart. It achieved a 43% win rate, with an average win of 7.8%.| Liberated Stock Trader
My test trades yielded a 1.77 reward-to-risk ratio, with an average winning trade of 8.5%. Across a large sample, an ATR-based strategy yielded a small gain per trade, but it lost more often than it won and experienced significant drawdowns.| Liberated Stock Trader
My testing shows the best TradingView indicators for advanced analysis are Volume Profile HD, VWAP, Supertrend, ATR, Relative Volatility, and RSI. TradingView's candlestick and chart pattern recognition algorithms are game changers for improving trading outcomes.| Liberated Stock Trader
My reliability testing of Bollinger Bands on the S&P 500, using 13,360 years of data, suggests it is an unprofitable indicator for traders. However, Bollinger Bands can be highly profitable, with the optimal settings.| Liberated Stock Trader
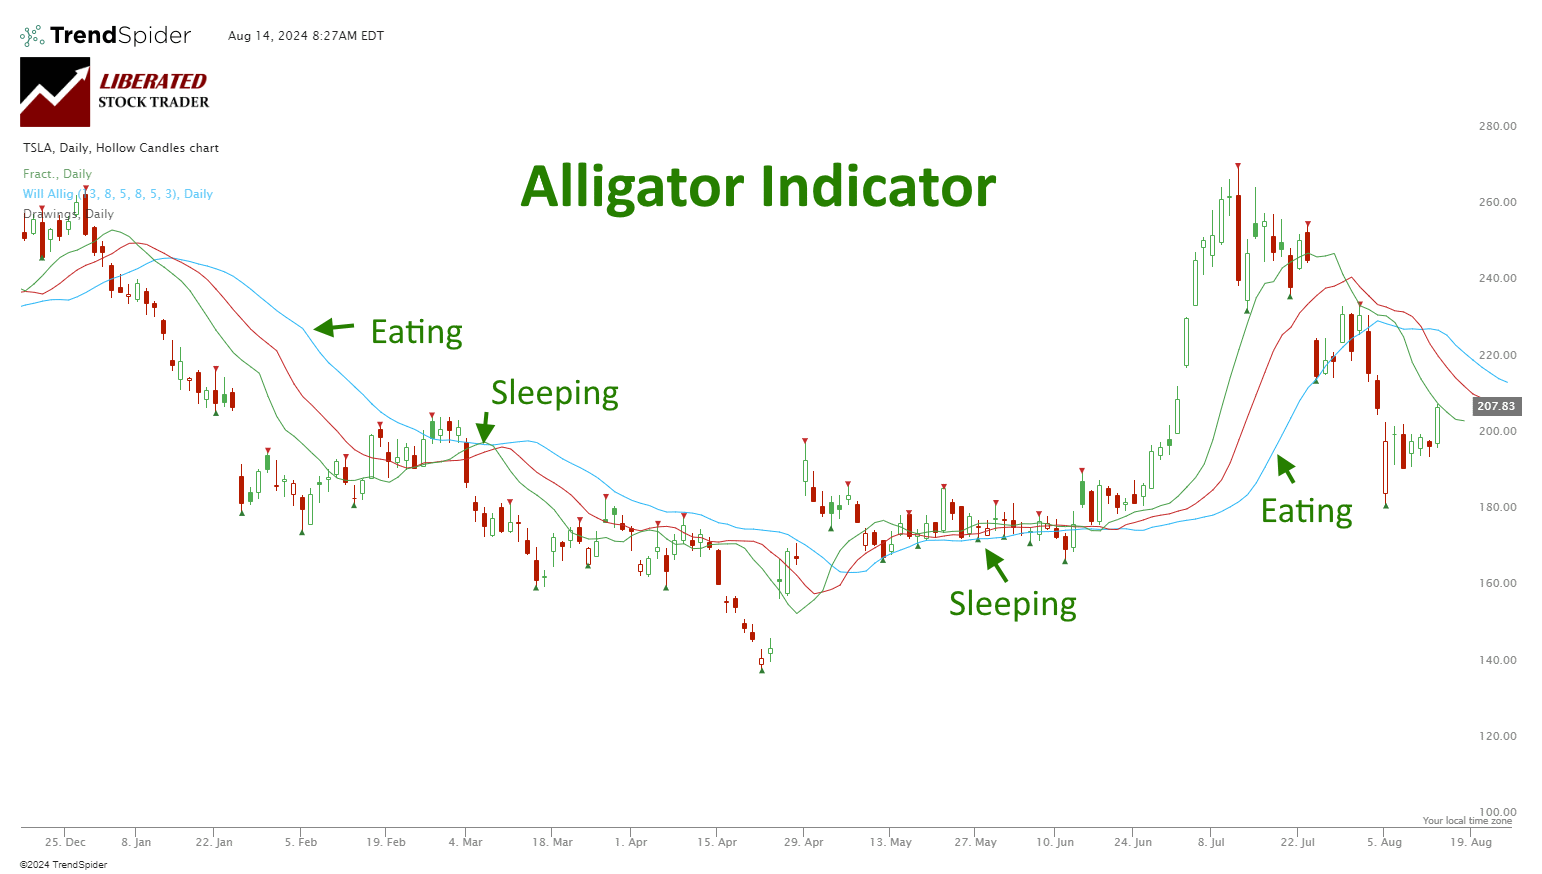
My unique research shows that the Alligator indicator is highly profitable in stocks and indices, using daily and weekly chart timeframes. It is also only profitable on a weekly chart for Forex.| Liberated Stock Trader
Using VWAP with a 14 setting on a daily Heikin Ashi chart is vastly superior to conventional OHLC charts. Using an OHLC chart, the strategy barely breaks even with a low-profit expectancy of 0.15. In contrast with a Heikin Ashi chart, the strategy is incredibly profitable, with a profit expectance of 0.83 and a reward-to-risk ratio of 3.03.| Liberated Stock Trader
In technical analysis, Fibonacci retracement is used by traders to predict levels of support and resistance by drawing horizontal lines according to the Fibonacci sequence. But Does It Work?| Liberated Stock Trader
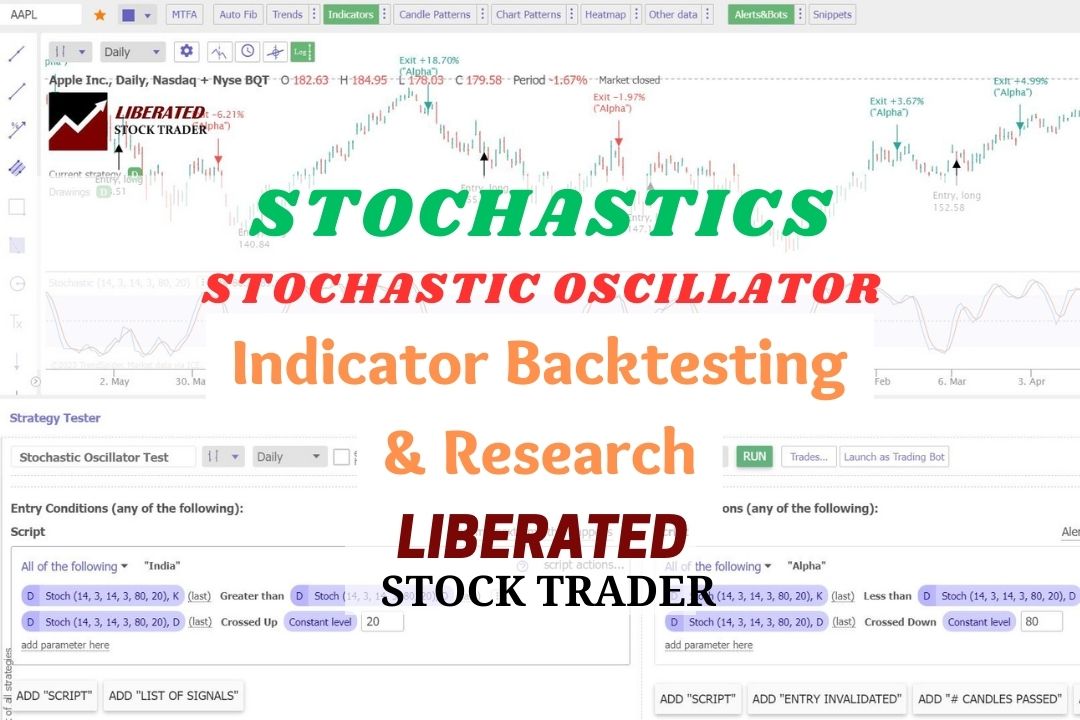
The Stochastic Oscillator momentum indicator compares an asset's closing price to a range of its previous prices. It oscillates between 0 and 100; below 20 indicates oversold, and above 80 suggests an overbought market.| Liberated Stock Trader
The mean reversion trading strategy suggests prices and returns eventually move back toward the mean or average. Reliable indicators like Stochastics, RSI, and Bollinger bands are based on mean reversion to identify overbought and oversold conditions.| Liberated Stock Trader
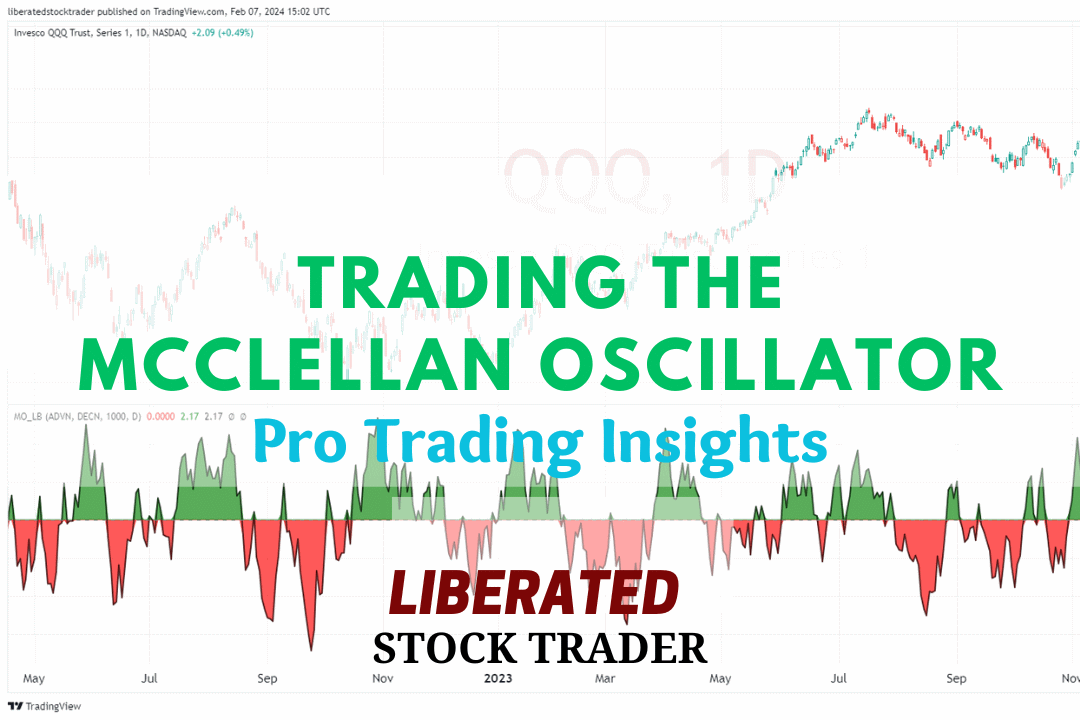
The McClellan Oscillator is a technical analysis tool designed to assess the market breadth of the New York Stock Exchange (NYSE). It is renowned for its effectiveness in revealing the underlying strength or weakness of the market by comparing the number of advancing to declining stocks.| Liberated Stock Trader
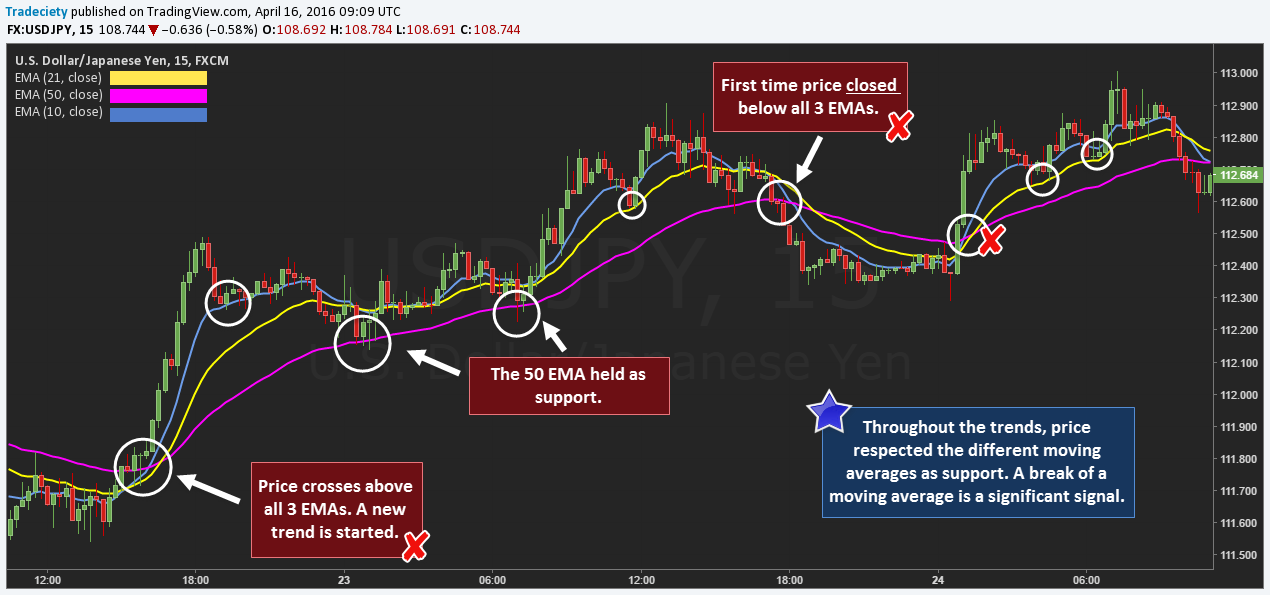
An exponential moving average (EMA) technical indicator reduces the lag associated with simple moving averages (SMA) by applying a multiplier to the most recent data. EMAs provide improved sensitivity, enhancing the accuracy of trend analysis.| Liberated Stock Trader
Stock volume measures the number of shares traded and indicates market strength. Rising markets with increasing volume are viewed as bullish, and falling prices on higher volume are bearish.| Liberated Stock Trader
DOI: 10.25923/qn4a-td90 A. Gunn1, D. Russell1, K. Joly2, L. Manzo3, J. Pellissey4, J. Tulagak3, and A. V. Whiting5 1CircumArctic Rangifer Monitoring and Assessment (CARMA), Whitehorse, YT, Canada 2National Park Service, Fairbanks, AK, USA 3Kivalliq Inuit Association, Rankin Inlet, NU, Canada 4Wek’èezhìi Renewable Resources Board, Yellowknife, NT, Canada 5Native Village of Kotzebue, AK, USA Headlines Introduction […] The post Migratory Tundra Caribou in a Warmer Climate appeared first on...| NOAA Arctic
DOI: 10.25923/0gpp-mn10 S. M. Natali1, B. Rogers1, E. A. G. Schuur2, V. Romanovsky3, H. Alcock4, K. Arndt1, E. S. Euskirchen5,6, G. Falvo2, G. Fiske1, G. Hould-Gosselin4, J. Hung1, A. Kholodov3, S. Potter1, O. Sonnentag4, and A. -M. Virkkala1 1Woodwell Climate Research Center, Falmouth, MA, USA 2Center for Ecosystem Science and Society, Northern Arizona University, Flagstaff, […] The post Arctic Terrestrial Carbon Cycling appeared first on NOAA Arctic.| NOAA Arctic
DOI: 10.25923/4488-8843 L. Quakenbush1, A. Bryan1, J. Crawford1, J. Olnes1, and R. Stimmelmayr2,3 1Arctic Marine Mammal Program, Alaska Department of Fish and Game, Fairbanks, AK, USA 2North Slope Borough, Department of Wildlife Management, Utqiaġvik, AK, USA 3Institute of Arctic Biology, University of Alaska, Fairbanks, AK, USA Headlines Introduction Climate change in the Arctic is expected […] The post Ice Seals of Alaska appeared first on NOAA Arctic.| NOAA Arctic
Traders utilize pivot point indicators to predict when stock prices will reverse direction. But does it work? I tested 66,480 trades on 210 years of data, and the results are surprising.| Liberated Stock Trader
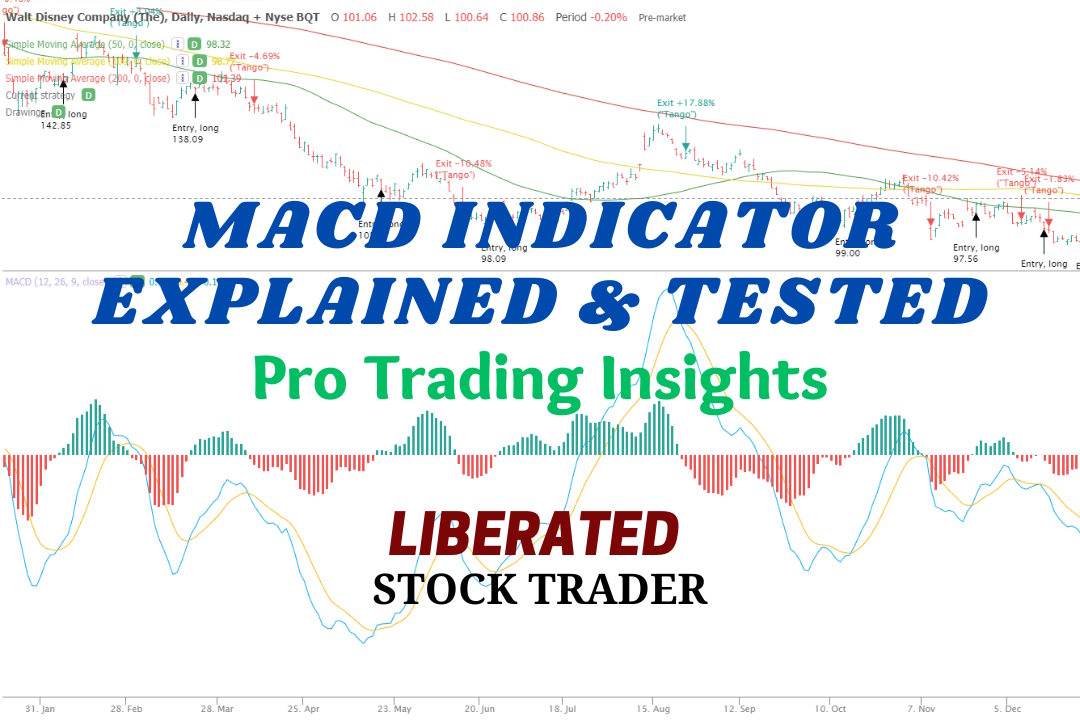
MACD is a trend-following momentum indicator used to identify price trends. We conducted 606,422 test trades to find the best settings and trading strategies.| Liberated Stock Trader
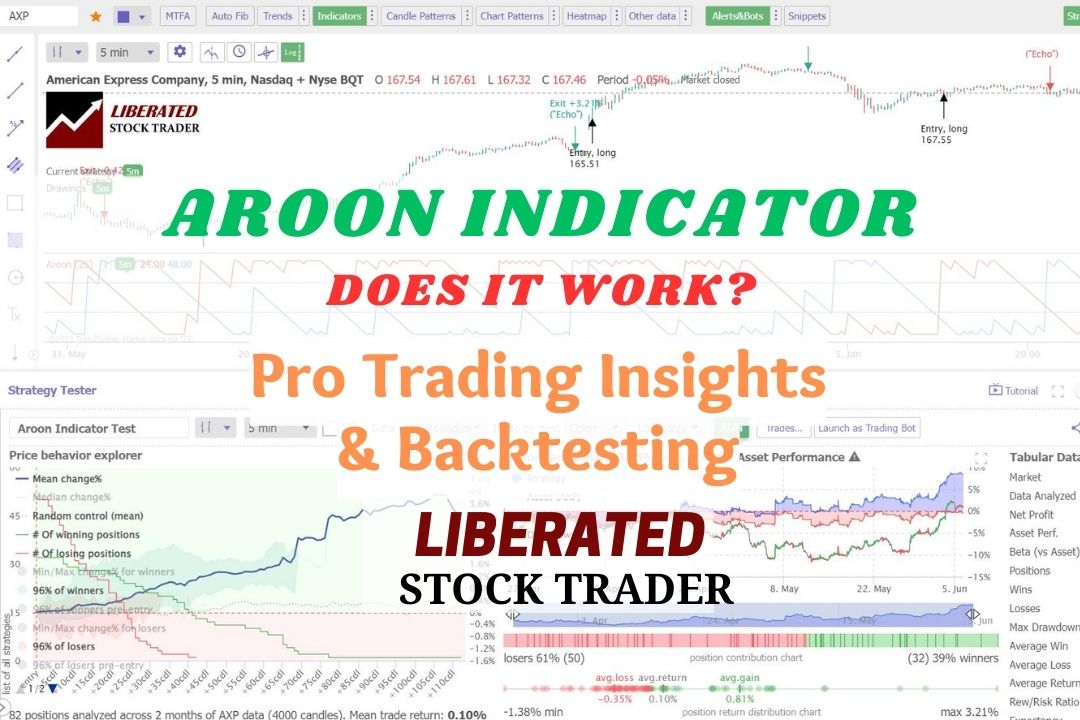
In technical analysis, the Aroon indicator identifies trend reversals and trend strength. This oscillating indicator has two parts: the "Aroon Up" line measures uptrend strength, and the "Aroon Down" line for downtrend strength.| Liberated Stock Trader
The simple moving average (SMA) technical analysis indicator helps identify stock price trends. It calculates an arithmetic average of prices, offering a smooth line that eliminates short-term price volatility.| Liberated Stock Trader
I tested 23,487 RSI trades on 820 years of exchange data. When configured correctly, RSI can be highly profitable, with a 53% success rate and an average of 65% winning trades. The RSI setting of 14 on a 1-hour chart is the most reliable configuration for identifying profitable buy and sell signals.| Liberated Stock Trader
In my 40-day, 5-minute day trading test, pairing ROC with a Heikin Ashi chart outperformed the market 93% of the time, compared to 43% with classic candles, while increasing the win rate (55% vs. 45%) and reward-to-risk ratio (2.7 vs. 1.84).| Liberated Stock Trader
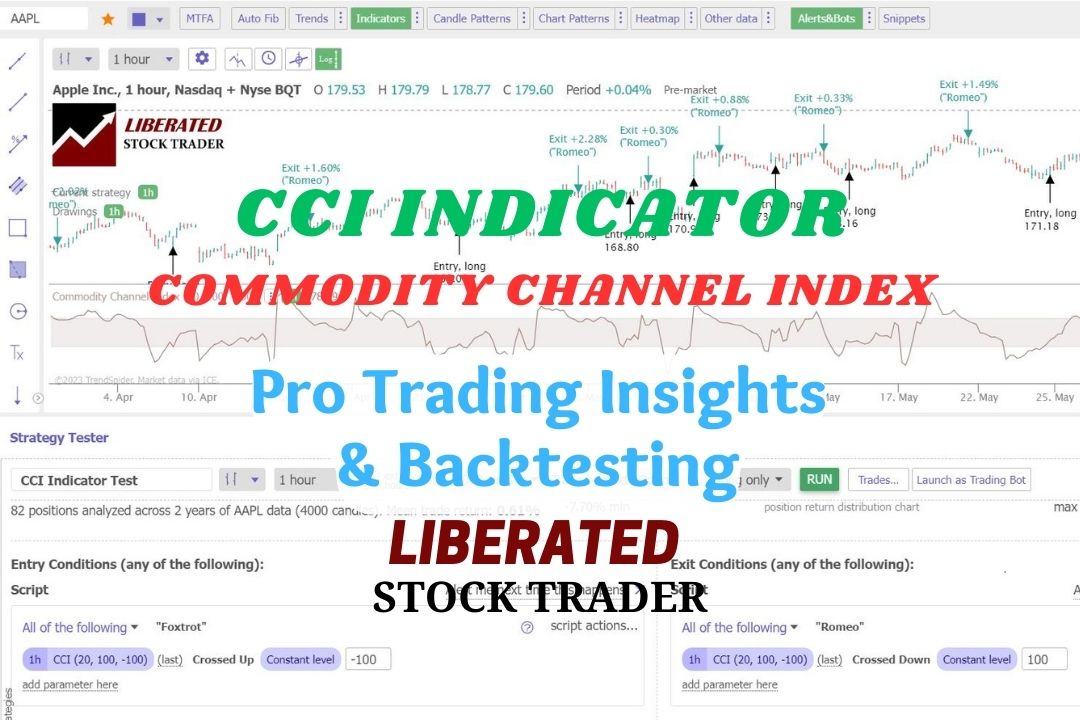
Based on 43,297 test trades, my research indicates that the CCI is a highly profitable momentum indicator, yielding a win rate of up to 85% when used with the correct settings.| Liberated Stock Trader
The best moving average settings are SMA or EMA 20 on a daily chart, which achieves a 23% win rate. At settings 50, 100, and 200, it is better to use the Hull moving average, which has win rates of 27%, 10%, and 17%, respectively.| Liberated Stock Trader
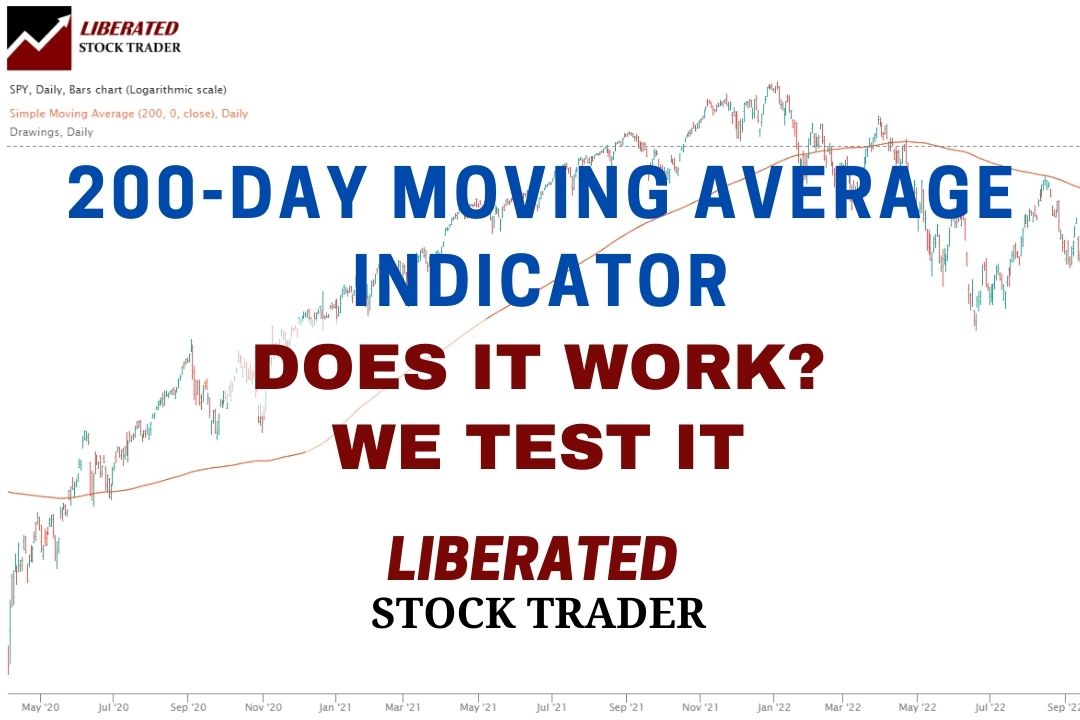
Our testing of the 200-day MA on the S&P500 over 16 years revealed that using this indicator is a losing proposition. A buy-and-hold strategy made a profit of 192% vs. the 200-day MA, which made only 152%.| Liberated Stock Trader
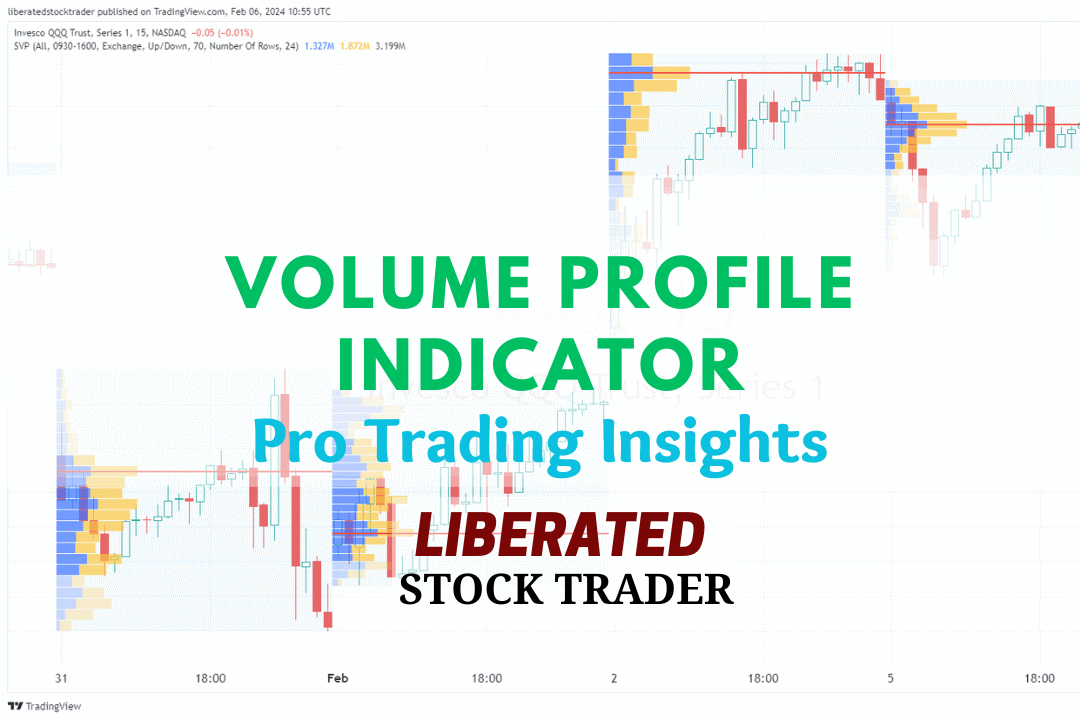
Volume profile technical analysis indicators provide a uniquely detailed overview of volume distribution across price levels, offering traders insights into market structure and supply and demand zones.| Liberated Stock Trader
Our research on 10,400 years of exchange data shows the best day trading indicators are the Price Rate of Change, VWAP, Weighted Moving Average, Hull Moving Average, Simple Moving Average, and RSI.| Liberated Stock Trader
The Hull Moving Average (HMA) is a highly responsive technical analysis indicator designed to reduce lag. Our research reveals it outperforms other moving averages.| Liberated Stock Trader
In technical analysis, momentum indicators help traders identify the strength and direction of a stock's price. We explain and test three popular momentum indicators for reliability.| Liberated Stock Trader