In my last two posts, I talked a lot about the free Analysis Platform application, used by Denso and others to dig deeper into big data to understand what exaltiert is happening on your shop floor. I showed you the Digital Native Seven Quality Control Tools (DN7 or DN7QC7). But beyond these seven tools, there are a few more included in the application, which I also would like to show you briefly here.| AllAboutLean.com
What is user intent? For many marketers, it’s an afterthought. In truth, it should be a top priority that guides your keyword research -- and your success.| PPCexpo
Excel is amazing, but can be a nightmare. Staring at spreadsheets for hours, trying to make sense of the data, can be overwhelming. This is where AI Excel tools come in. They are digital “coworkers” you cannot see. They write out formulas, simplify data, create charts, clean and analyze data. In this post, we will […] The post Best AI For Excel appeared first on AutoGPT.| AutoGPT
Analyzing online content and how people interact with that content is essential to understanding the process of online radicalization. Bad actors worldwide use social media to post content to arouse emotions and create chaos. Distrust and polarization. With algorithms instantly and repeatedly feeding similar content, it is easy to go down a rabbit hole of authoritarian creation, resulting in undue influence. Dr. Stuart Shulman is the founding Editor of the Journal of Information Technology & ...| Freedom of Mind Resource Center
Olumide explores the ways combining lifecycle marketing and your CRM system can increase your customer retention through a growth loop.| Revenue Operations Alliance
Data privacy. It’s all anyone seems to talk about these days. As a marketer, that can feel like a big hurdle, right? You’re aiming to deliver an exceptional customer experience, but you also don’t want to overstep. Here’s the thing: there is a way to connect with your customers and respect their privacy. And that’s where […]| Usermaven
Explore quantitative data analysis to simplify your business decisions. Learn how to uncover insights, optimize strategies, and drive growth effectively.| Usermaven
Despite the overall drops, there are reasons to be cautiously optimistic. Australia's average export price surged over 83%, and New Zealand wines coninued its stunning rise.| Vino Joy News
In my last post, I started to talk about the free Analysis Platform application used by Denso and others (especially in Japan) to tackle big data. In this post I will go into much more detail on what Denso calls the Digital Native Seven Quality Control Tools (DN7 or DN7QC7). These data analysis tools go ... Read more| AllAboutLean.com
A lot of problem solving is about understanding the current situation. Ideally this includes data. There are a couple of ways to analyze data. Denso uses seven traditional ways of analyzing data, which you are all familiar with. However, they expanded these tools with the goal to analyze big data. They call it the Digital Native Seven Quality Control Tools (DN7 or DN7QC7) …and of course I will share this with you. Even better, there is a freely available tool “Analysis Platform” that do...| AllAboutLean.com
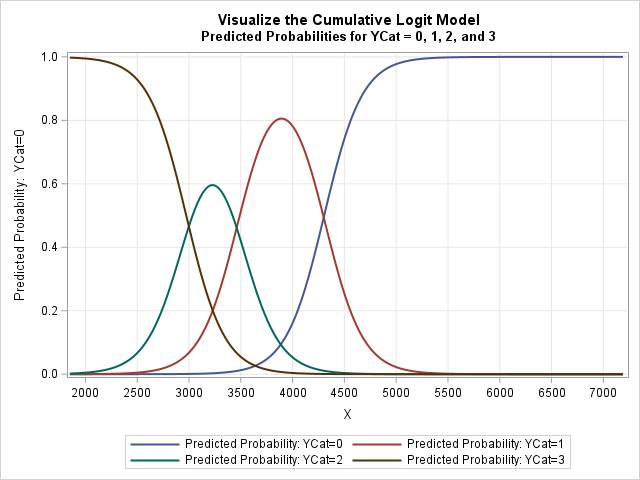
Many data analysts are familiar with logistic regression, where the response variable, Y, has two observed values, often represented as Y=0 and Y=1. The case Y=0 encodes that an event did not happen. For example, a patient did not experience some disease or did not die. The opposite case (Y=1) means that the event did happen. These binary responses are common in many areas but are especially useful in medicine. However, sometimes the response variable encodes multiple levels of severity. The ...| The DO Loop
In baseball history, instincts and gut feelings were the deciding factor behind key moves. Now, it’s a game powered by data and smarter choices, with analytics transforming the sport and changing how teams compete at every level. Modern teams rely on advanced stats to evaluate players and plan strategies. They provide the foundation for modern… The post Baseball Data Analysis And Strategies for Winning on the Field appeared first on GoRout.| GoRout
See which UK fresh and raw dog food brands lead organic search in 2025. Discover traffic winners, backlink leaders & who’s missing growth opportunities.| Bubblegumsearch
Research data suggests that, in terms of their personalities, Reform voters are on average the least agreeable, while Green voters are the most neurotic.| Martin Rosenbaum
About this project Challenge Objective For the Maven Everest Challenge, I played the role of a data journalist tasked with telling the story of mankind’s| Cabinets of thoughts
Diagnostic analytics uses historical data to determine the cause of a problem. This blog explores how to use this analysis to drive revenue growth.| Revenue Operations Alliance
What is revenue leakage? And why is it something you should be trying to avoid? We run through everything you need to know about revenue leakage and how you can prevent it from draining your profits in the future.| Revenue Operations Alliance
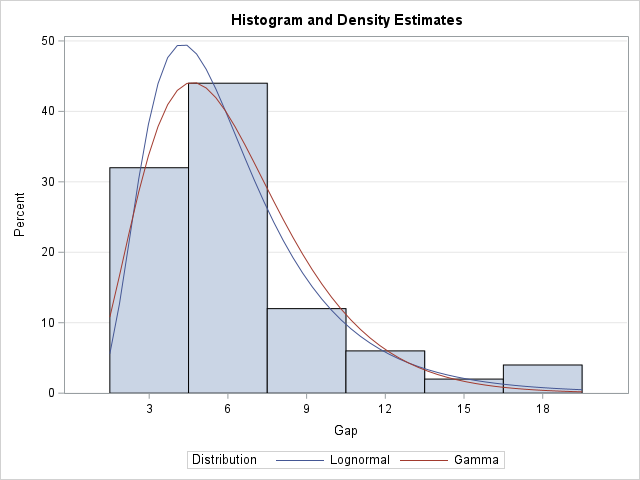
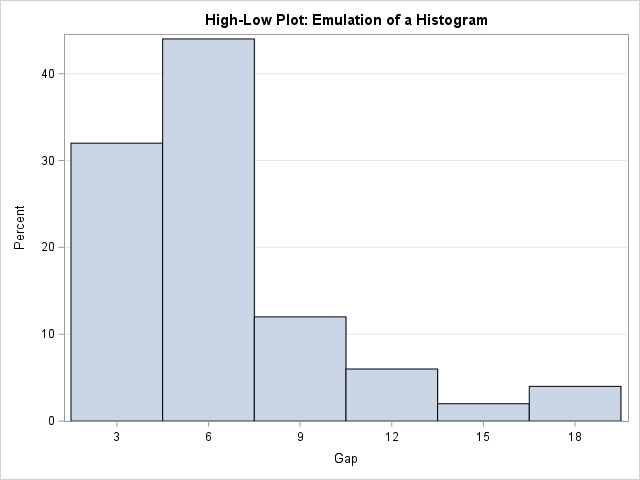
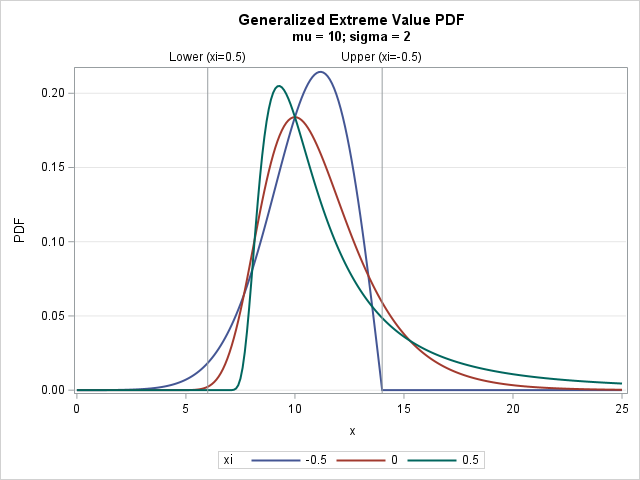
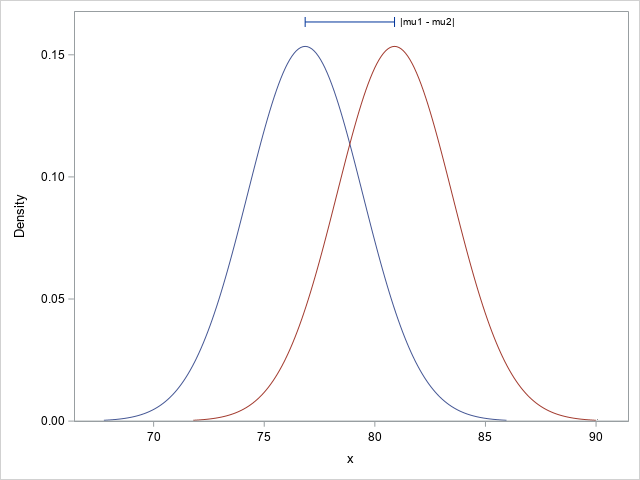
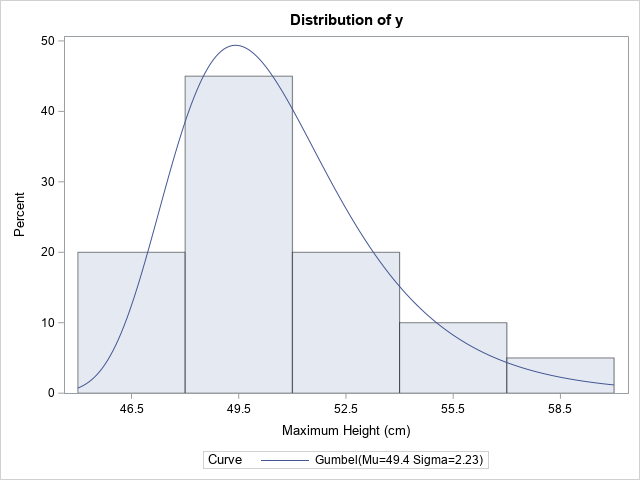
SAS has several procedures that can fit a probability distribution to data, plot a histogram, and overlay one or more density estimates: PROC UNIVARIATE in Base SAS enables you to overlay parametric density curves from about 20 common continuous probability distributions, such as normal, lognormal, and gamma. It also enables you to overlay a nonparametric kernel density estimate. PROC SEVERITY in SAS/ETS software enables you to overlay density curves for severity models. It also enables you t...| The DO Loop
ENGIE has launched a program to collaborate with enterprise-ready startups in addressing operational and technological challenges across India’s renewable energy sector.| pv magazine India
The UK’s major complaints services are receiving increasing numbers of cases to investigate, and the use of generative AI chatbots might be a cause.| Martin Rosenbaum
I used to be the undisputed queen of messy reports.But now, I’ve decided to throw away that crown. I mostly relied on Power BI’s default features, which are okay—but, aesthetics matter. After watching other reports for inspiration, I realized one important thing: 👉 Your report must have aligned titles, tooltips, text, and consistent color grading. […] The post How to Align Power BI Reports for Beginners appeared first on Cabinets of thoughts.| Cabinets of thoughts
Automated diagnostic systems are transforming the way we approach problem detection and decision-making across various industries. These systems utilize algorithms, data analysis, and often artificial intelligence to identify issues, recommend solutions, enhance efficiency and accuracy, and makes programs scalable with current analyst head count. This presentation introduces the basic concepts behind our automated diagnostics. By... The post Understanding the Basics of Automated Diagnostic Sy...| Accelix | The Framework for Connected Reliability
Pet ownership in the UK has never been higher, and spending on pets continues to grow year after year. But which brands are actually capturing that demand online? At Bubblegum Search, we analysed 20 leading UK pet brands to see who’s winning, and who’s missing out, in organic search and Google’s new AI Overviews. The […]| Bubblegumsearch
Go inside the $250B gaming industry. SciPlay CRO Noga Halperin shares the data playbook they use to scale revenue predictably.| Revenue Operations Alliance
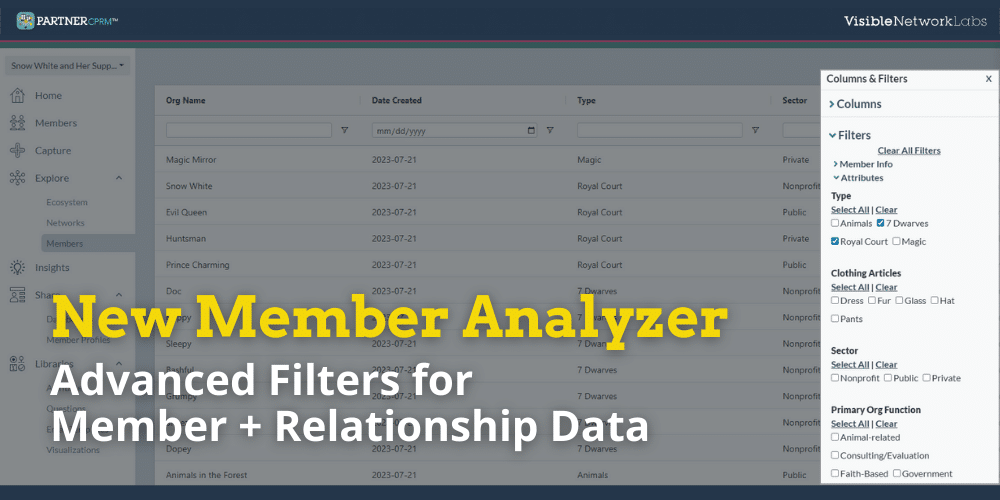
Introducing the new Member Analyzer, a powerful way to explore, filter, and export your member and relationship data all in one place.| Visible Network Labs
Data-driven marketing helps businesses make smarter, evidence-based decisions by leveraging customer and market data. In this guide, you’ll learn about key strategies, the challenges marketers face, the tools that provide accurate insights, and how to implement a successful data-driven marketing approach in your business.| NotificationX
Cut your food budget in half with a simple meal planning spreadsheet. See how one family swapped Doordash for groceries and saved big.| Spreadsheet Point
This survey of 630 participants provides a snapshot of who today’s data professionals are, how they entered the field, what tools they use, and what they value in their careers.| Cabinets of thoughts
An academic study has found that as much as 85% of illegal insider trading goes undetected, revealing a massive enforcement blind spot in U.S. stock markets.| Spreadsheet Point
Five of the Falk College sport analytics students who worked for the United Football League this season attended the UFL’s championship game in St. Louis. F ...| SU News
I come back to my last experiment and explore whether the difference in gravimetric vs volumetric flow could be due to changing shot TDS.| Coffee ad Astra
Learn the hidden costs of manual tracking and reporting processes in this guide, and discover strategic solutions to overcome these challenges.| AchieveIt
Conservative-led federal states want to introduce technology from a Trump supporter across Germany. The future CSU Federal Ministry of the Interior could help. When the German Federal Council recently voted in favour of a joint data analysis platform for the federal and state police forces, many media interpreted this as a green light for the […] Der Beitrag German dissent on Palantir: Several federal states oppose the US software for the police erschien zuerst auf Matthias Monroy.| Matthias Monroy
Changing careers can be daunting, especially when shifting into a complex, fast-evolving field like tech.… The post From Unemployed to Data Analyst: Triveni Kankanala’s Inspiring Career Switch with HyperionDev appeared first on HyperionDev Blog.| HyperionDev Blog
Learn how to use powerful Tables in Google Sheets. Benefit from built-in data validation, data analysis tools and better formula references.| www.benlcollins.com
In this post, we walk through the process of how we conducted our business decision-making study, detailing our methods and the insights we gained from 53 business leaders.| LaConte Consulting | Resilient Profit Solutions
I had a use case that eventually required performing IP address lookups in a given list of CIDR ranges, as I maintain an open source project that gathers IP address range data from public cloud providers, and also wrote an article in my blog about an...| tobilg.com
Choosing between spreadsheets vs. databases for your data management? Read on to learn more about their differences and know which one to pick here.| Spreadsheet Point
In this ultimate guide, you will learn growth hacking strategies used by top SaaS startups to achieve rapid growth and success. We’ll reveal their secrets, provide examples, and offer actionable insights to help you apply these techniques in your own business. The competitive SaaS landscape demands differentiation, and adopting growth hacking tactics can help you […] The post The Ultimate Guide to SaaS Growth Hacking: Secrets from Top Startups appeared first on outcry.| outcry
In this blog, we will explain integrating CustomGPT.ai with the R programming language, providing developers with an opportunity to leverage AI technology...| CustomGPT
NFHS-5 provides National & state level information on many health related indicators, population, nutritional status etc. A total of 6,36,699 households were covered, in that 7,24,115 women and…| Swayamkatha
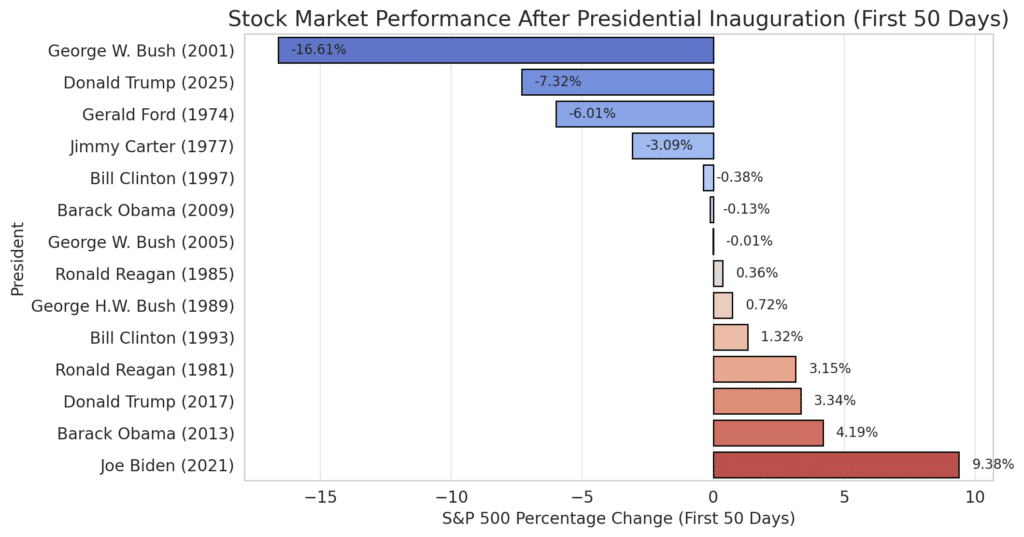
The response to Donald Trump’s second term has been one of the sharpest in recent history, one of the worst early-market performances for a modern U.S. president.| Spreadsheet Point
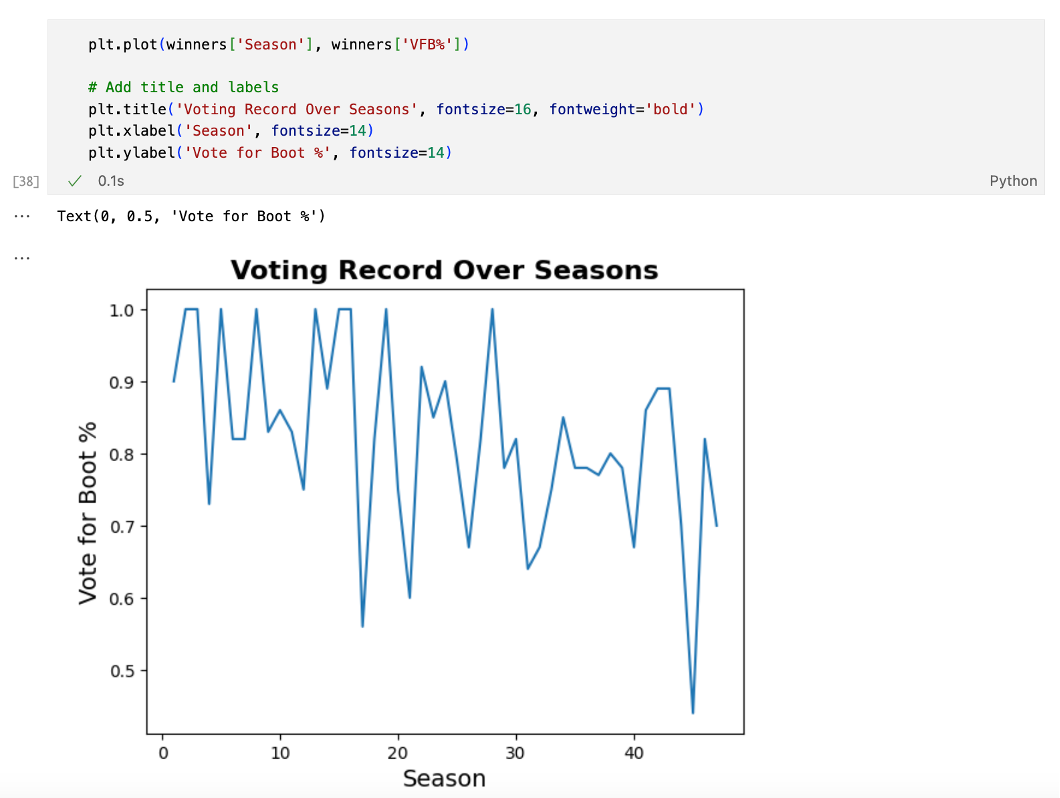
I am a die-hard Survivor fan. I was born the year after the show came out, and since then I have tuned in for every single episode, with season 48 being no exception. However, I’ve noticed a trend: the players I think are most deserving of the million dollars never end up winning! As a data lover, I was curious about what the stats said. What qualities make a Survivor winner? Did the players with the best stats end up winning the game? And, most importantly, can a model predict who will wi...| SAS Users
I’ve been analysing recently published data from the Electoral Commission about local campaign spending by candidates at last year’s general election.| Martin Rosenbaum
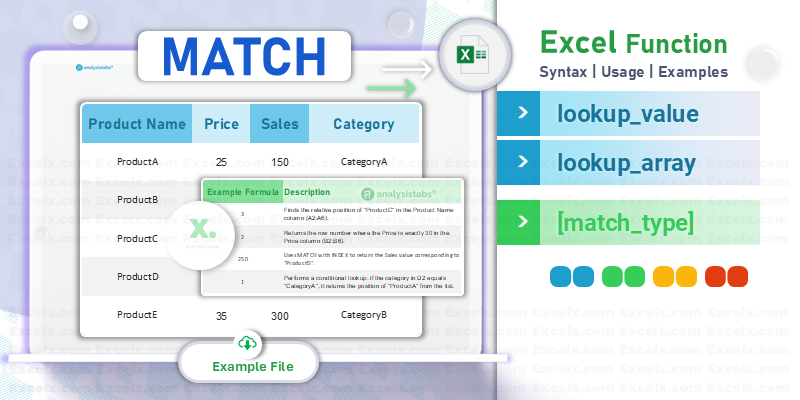
Learn how the Excel MATCH function locate the position of a specific value within a given range or array with dynamic lookups, advanced examples, and best practices.| Excel
New Zealand’s adult literacy and numeracy skills are in decline—is it just an education issue, or something bigger? Scribe deciphers the data, challenges assumptions, and explores culturally responsive solutions with a dash of humor. Read more! Adult Literacy and Numeracy in New Zealand meets AI| 🌀thisisGRAEME
In this tutorial, you'll learn the techniques to transpose data in Excel. You can use the Paste Special option, Transpose Function or a Custom Macro.| Trump Excel
Training instructor: Carlton Seymour In this training, we will cover the fundamentals of Power BI, focusing on topics such as: Data Modeling DAX (Data| Cabinets of thoughts
TL;DR: We’ll set up and run a Model Context Protocol (MCP) server that communicates with Snowflake to run SQL queries. We’ll install using Smithery (a| Collabnix
In today's fast-paced educational world, data is more important than ever. Creating a game-changing data culture in public schools isn't just a trend; it| Region 13's Blog
Looking back at my performance in my first every Metaculus’ Quarterly Cup (Q4 2024), there’s a lot of room left for improvement. This post compares the different forecasting methods I used and what their results were. Thanks to some analysis, I then figure out what I can improve: stick to reasonable probabilities; use fat-tailed distributions to forecast; avoid the trap of nowcasting; update my predictions more often. This post also explains the fundamentals of log scores and how scoring ...| obrhubr.org
Use the Excel Countif Duplicates Formula to Count, detect , remove, or highlight repeated entries, ensuring error-free, reliable spreadsheets for data cleanup.| Excel
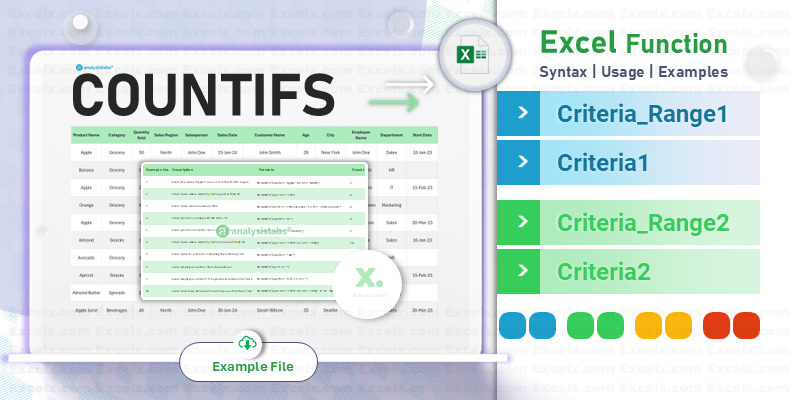
Master Excel COUNTIF with 'greater than' criteria. Explore formulas and examples for counting numbers, dates, percentages, and times in data analysis.| Excel
Unlock the secrets to predict market trends with AI. Find out how AI technology is revolutionizing stock market analysis for traders.| Coruzant Technologies
The general election result last July was certainly a ‘Labour landslide’, but it wasn’t the even bigger, ginormous landslide which the polls predominantly predicted.| Martin Rosenbaum
Excel is a cornerstone of data analysis, relied upon by businesses, researchers, and everyday users to make critical decisions. Yet, even seasoned professionals can misinterpret data due to common pitfalls, potentially leading to costly errors.| Spreadsheet Point
SPONSORED CONTENT PRESENTED BY ALKAMI TECHNOLOGY By: Marla Pieton, Sr. Director, Research & Thought Leadership Strategy for Alkami As reliance| ABA Banking Journal
Learn how to translate your PARTNER CPRM survey responses into powerful, actionable insights for your network of community partnerships.| Visible Network Labs
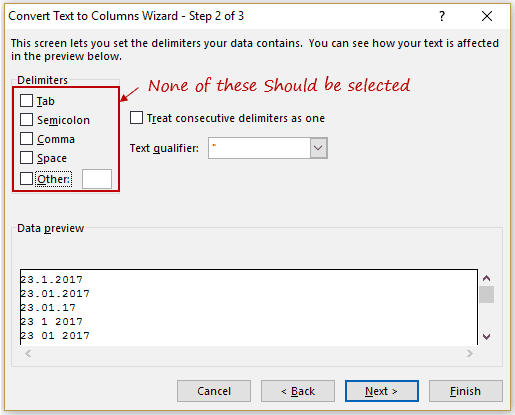
In this tutorial, you will learn how to use Excel Text to Columns feature. It also covers 7 different cases where text to columns can be used.| Trump Excel
I’m not sure you can really call someone rating their least favourite dish with 1/5 in an informal poll on my website voter fraud, but I sure felt like a detective uncovering a crime while looking through my logs and analytics. It also makes me look better than saying: “I allowed voting multiple times because of lacking security.”|
I completed a Maven Analytics Guided Project. In this article, I'll share all the details of this project. Project name: Maven Toy Store KPI Report About| Cabinets of thoughts
use of family planning methods is only 66.7% as respnded by currently married women age 15 to 49 years. female sterlization 37.9%, IUD by 2.1% women, pill is used by 5.1%, condom by 9.5%, male sterlization by 0.3%| Swayamkatha
Ant Picnic Data Discovery Grades K-5, 6-8 or 9-12 2-3 hours Biology / Math / Statistics Download TEACHER GUIDE Introduction to Ant Picnic Data Analysis https://youtu.be/pIVOTzcmsZo About this activity Scientists always collect and record data when they conduct experiments. In science [...]| Students Discover
Guy Rubin, CEO of ebsta, discusses the importance of driving accurate sales forecasts. And explains how you can achieve 95%+ forecast accuracy.| Revenue Operations Alliance
Joe Aurilia Jr. discusses how to utilize Salesforce integrations to boost revenue growth at different organizational scale levels.| Revenue Operations Alliance
Overview Hey there – we’re diving into an exciting walkthrough of how to integrate Sigma Computing (“Sigma”), a business intelligence (BI) tool, with Mozart Data, our end-to-end modern data infrastructure platform. Sigma is a preferred BI partner of Mozart Data, and we are excited to show you how the two fantastic tools can work […] The post Using Sigma with Mozart Data first appeared on Mozart Data.| Mozart Data
This post was written by guest author Trevor Fox. Every startup of a certain size, at a certain degree of success, arrives at a question: “Who are our customers?” Behind this question are a couple of motivations: if I can understand them, I can serve them better (and retain them), and if I can find […] The post Customer Analytics for Startups first appeared on Mozart Data.| Mozart Data