
The Art in Pi | Visual Cinnamon
Exploring the art hidden in π| Visual Cinnamon
I’ve always been interested in the aesthetic side of dashboards beyond what the tools offer—importing custom backgrounds and graphic elements created outside of BI software.The.. The post Plastic Portrait: Visualizing Technical Skills Through Cable Ties appeared first on Nightingale.| | Nightingale | Nightingale

A collection of six pieces created for the Global Diet Quality Score (GDQS) project of Intake, visualizing the data of over 80,000 individuals| Visual Cinnamon

Hi, my name is Victor, and I want to share my experience using data art to overcome my social anxiety and make connections at the Bansko Nomad Fest.| Nightingale

This project has a sad beginning. I was at a networking event in the Netherlands on April 20, 2018, when a colleague said: "Avicii has died| Nightingale

By the end of the second year of my Master's program, my love for data journalism, crochet, and football resulted in an unusual project.| Nightingale
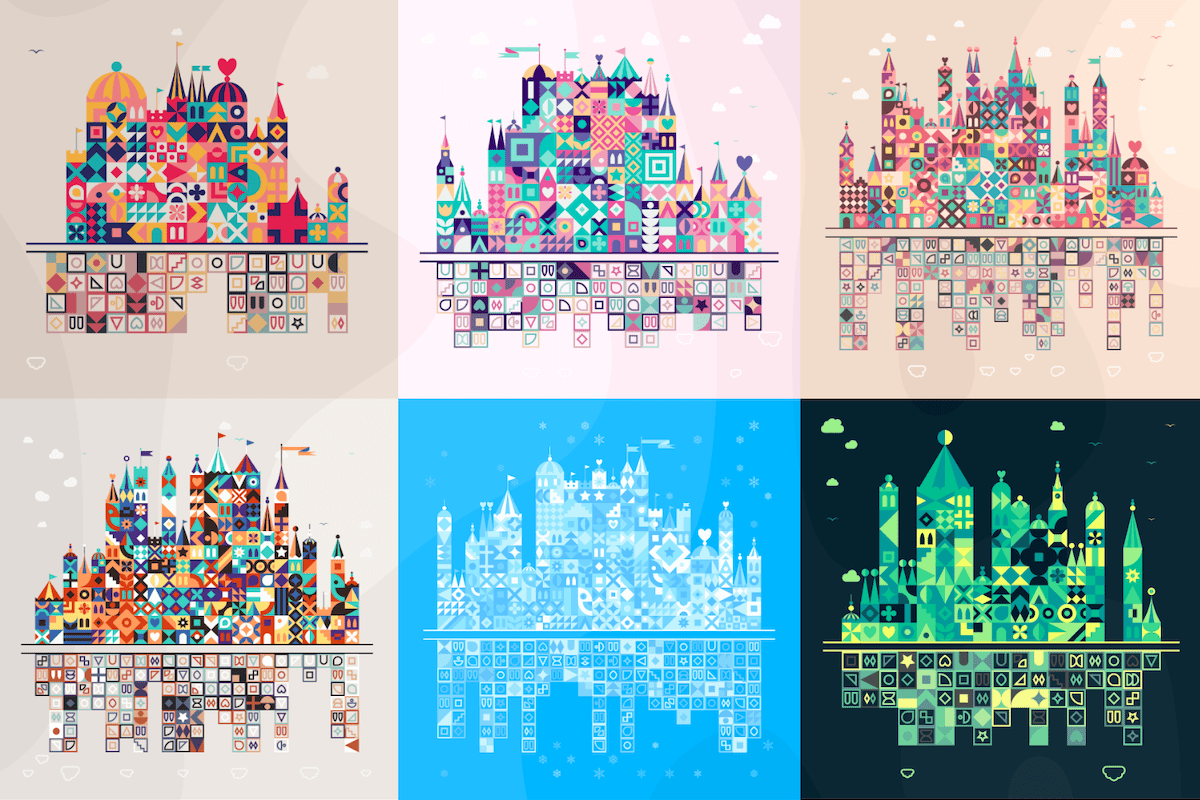
A deep dive on the design and how I used data from UNICEF's Giga project on 283k schools to create my 'Patchwork Kingdoms' NFT collection| Visual Cinnamon
Explaining the exact data transformation steps and design options of the Wanderlust NFT collection, released on EthBlock.Art| Visual Cinnamon

A massive data art piece visualizing a full year of operation in the Swiss extra-high-voltage electrical grids| Visual Cinnamon

An EthBlock.Art NFT collection visualizing the transactions from each block as shapes (seemingly) moving through space| Visual Cinnamon

A data art collection of 4 + 1, revealing data about some of the most important elements that we humans (now) need to live| Visual Cinnamon

A data art collection revealing how the stars are moving across the eons, through the lens of how our current constellations are pulled apart| Visual Cinnamon

A data-drive generative art piece based on butterfly species' data| Visual Cinnamon

The 'Artist Curated' collection of 7 pieces representing my favorite outputs from the 'Twistings' algorithm, an exploration into the beauty of spirals| Visual Cinnamon

The 'Explore Variety' collection of 256 pieces that reveal the variety, spirals, and color of the 'Twistings' algorithm| Visual Cinnamon

'Obscured' is a collection that uses millions of tiny dots to create the illusion of lines, triangles, overlapping, obscuring| Visual Cinnamon

A data art collection created for the Giga Connect project of UNICEF visualizing ±280k schools as tiny kingdoms across a digital divide| Visual Cinnamon
Foto credit| Well-formed data

A unique data art piece that visualizes the 5000+ exoplanets discovered so far to pose the question 'What defines human culture?'| Visual Cinnamon

A small collection of triptychs based on some of the most famous photos taken by the Hubble Space Telescope| Visual Cinnamon

Creation of a network to convey the complexity of the 'Small World of Words' network of word associations| Visual Cinnamon
