In this OpenTelemetry expert panel, we discuss the new Browser SIG, key challenges of adapting OTel for the frontend, and how web developers can get started with OpenTelemetry.| Embrace
In this OpenTelemetry expert panel, we discuss the challenges of collecting telemetry in mobile apps, why mobile developers struggle with observability, and what the current support for OpenTelemetry is on Android and Swift.| Embrace
Embrace has opened a proposal to donate a Kotlin implementation of the OpenTelemetry specification that can be used in Kotlin Multiplatform projects.| Embrace
What Are OpenTelemetry Metrics? OpenTelemetry metrics are measurements of services performance at runtime. For example, request counts, error rates, memory usage, or latency. Here’s how they compare to logs and traces, which are other types of telemetry data instrumented by OpenTelemetry: With metrics, teams monitor trends and patterns in their system performance. For example: This […]| The Logz.io Blog — DevOps, Logging, Metrics, Tracing, and Security
When Production Goes Sideways Imagine this: It's 2 AM, your phone buzzes with an alert, and your dashboards are screaming. Production is down. Sound familiar? An automated health check has failed, and your internal dashboards are showing a spike in errors. You've just pushed a new release that included a critical database schema change, and a background worker task that relies on it is now failing. The web application is still running, but users are starting to report issues. You need to inve...| Heroku
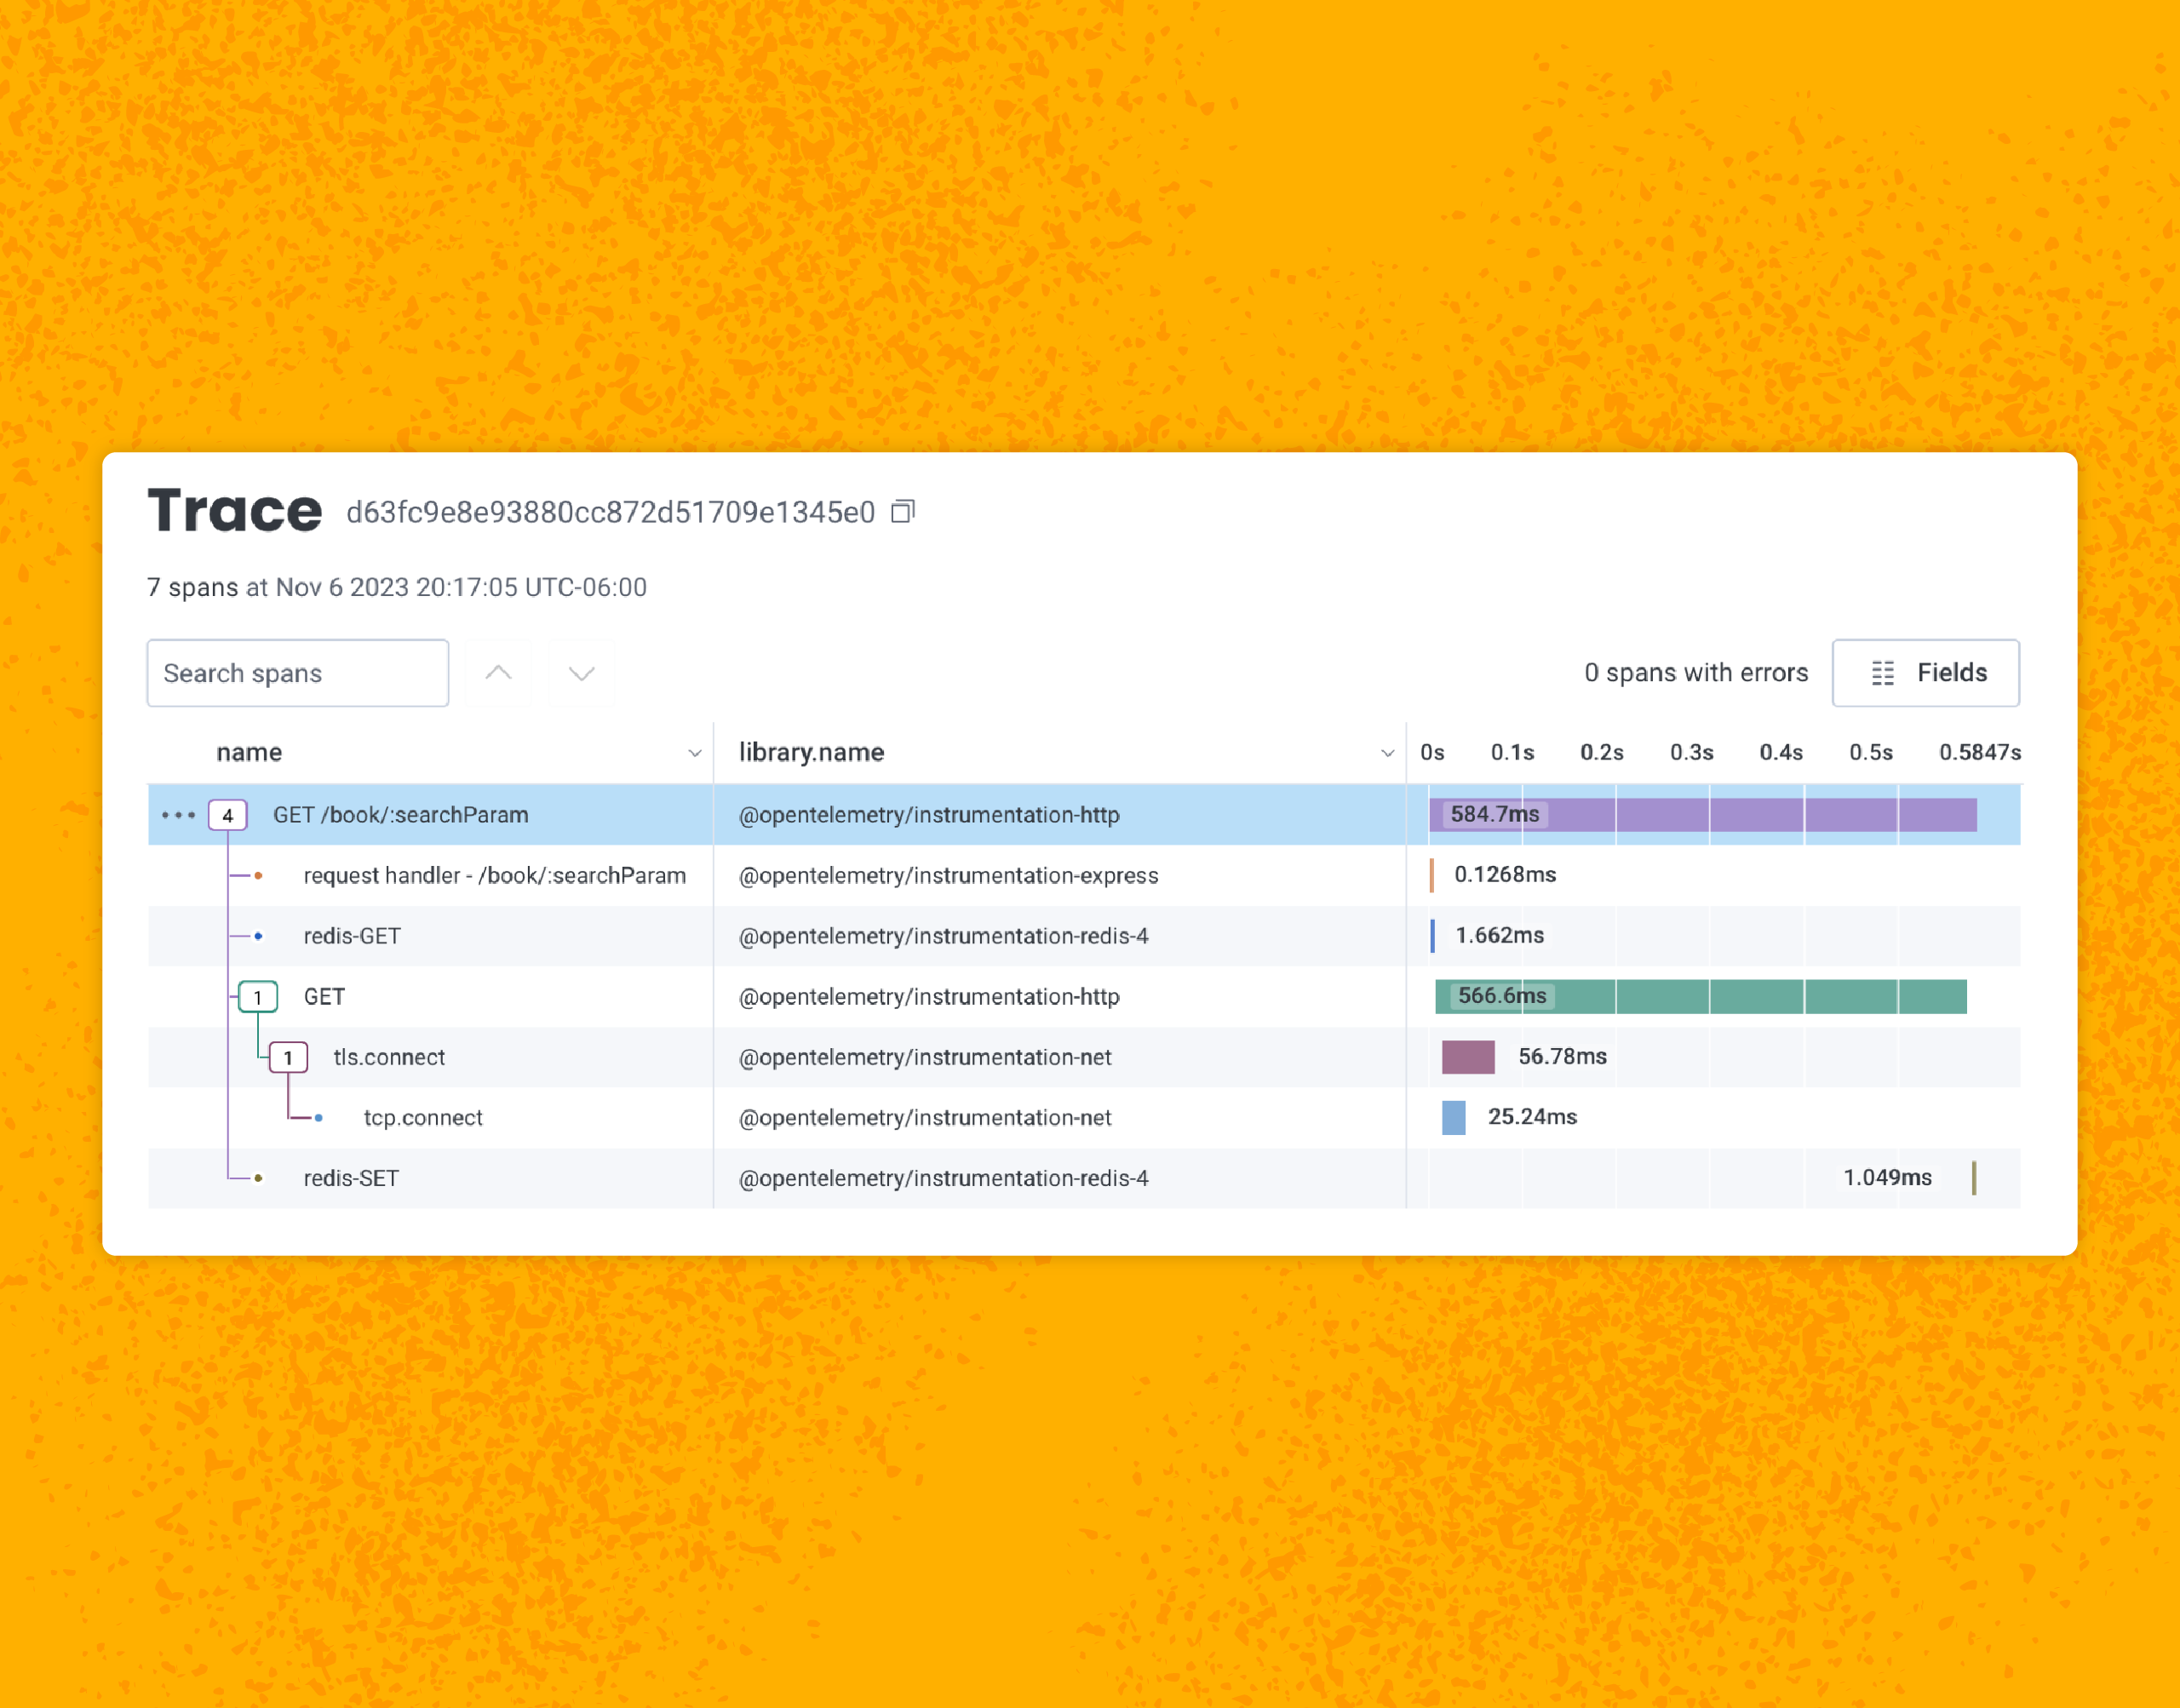
Modern cloud-native architectures are composed of multiple microservices running across dynamic environments. Effectively diagnosing performance issues, bottlenecks, or failures requires comprehensive observability. For this, many organizations look to OpenTelemetry, which provides a standardized approach to capturing and analyzing telemetry data. Fir is Heroku’s next generation cloud platform , designed to offer more modern cloud-native capabilities with flexibility and scalability. It’s...| Heroku
Heroku recently made the next generation platform - Fir - generally available. Fir builds on the strengths of the Cedar generation while introducing a new modern era of developer experience. Fir leverages modern cloud-native technologies to provide a seamless and performant platform. One of the goals we set out to achieve with Fir is to modernize our platform's observability architecture. Applications being written today are becoming increasingly more distributed and complex in nature. With t...| Heroku
The Heroku CLI is a vital tool for developers, providing a simple, extensible way to interact with the powerful features Heroku offers. We understand the importance of keeping the CLI updated to enhance user experience and ensure stability. With the release of Heroku CLI v10, we’re excited to introduce key changes that enhance the user experience and improve compatibility with the next-generation Heroku platform. What's New in Version 10.0.0? Heroku CLI v10 introduces several breaking chang...| Heroku
Cloud platforms have come a long way since Heroku first set out to empower developers. Today’s cloud native development demands even greater flexibility, openness, and scalability. A fun fact about Heroku is that we use trees to denote the generation of the platform technology stack (aka version). In the tradition of Aspen, Bamboo, and Cedar, we are introducing Fir, the latest Heroku technology stack built on open source standards and cloud native technologies. When we launched Cedar, we in...| Heroku
The OpenTelemetry Astronomy Shop demo has long served as a reference environment for exploring observability in distributed systems, but until now it shipped with only a Prometheus datasource. VictoriaMetrics forked the demo and extended it with VictoriaMetrics, VictoriaLogs, and VictoriaTraces, providing insights into VictoriaMetrics’ observability stack where metrics, logs, and traces flow into a unified backend.| VictoriaMetrics
I’ve just been in Sydney for a couple of days for CloudCon 2025. I think depending on how you count this is my third one of these events — the event has changed names at least twice, so its actually a little hard to work out the lineage of the event. This year’s conference was […]| Made by Mikal
Learn about observability & OpenTelemetry. Discover the importance of telemetry data & how OpenTelemetry standardizes it, making your life easier!| ITGix
Open Liberty 25.0.0.7-beta is here with support for MicroProfile 7.1! Includes Telemetry 2.1 (built on OpenTelemetry v1.48.0) & OpenAPI 4.1.| MicroProfile
You may know I’m a big fan of OpenTelemetry. I recently finished developing a master class for the YOW! conference at the end of the year. During development, I noticed massive differences in configuration and results across programming languages. Even worse, differences exist across frameworks inside the same programming language. In this post, I want to compare the different zero-code OpenTelemetry approaches on the JVM, covering the most widespread: Spring Boot with Micrometer Tracing| A Java geek
Prometheus Node Exporter is a tried and tested method to make hardware and OS metrics available as a scrapable endpoint to Prometheus server (or other downstream services/TSDB that support the same format). With OpenTelemetry (OTel) gaining more traction/recognition, I learnt that the OTel Collector's Host Metrics Receiver can also be used to expose host level metrics. However, I wondered if it would be able to make parity in terms of the type/number of metrics it is able to expose to downstr...| Technical Scratchpad
Over and over, we’ve seen that teams who invest in adding rich, relevant context to their telemetry end up debugging faster and collaborating more effectively during incidents. Getting meaningful context added can feel like a big cross-team project, but some of the highest-leverage improvements don’t require app code changes or coordination across services. The post The Fast Path to More Useful Telemetry appeared first on Honeycomb.| Honeycomb
With this release, you can more easily build and reconfigure telemetry pipelines and sample safely with the ability to easily pull full-fidelity data from your own archive whenever you need it. The post Observability Without Tradeoffs: Introducing Powerful New Honeycomb Telemetry Pipeline Features appeared first on Honeycomb.| Honeycomb
SAN FRANCISCO – June 24, 2025 – Honeycomb , the creators of observability, today announced a major milestone in helping enterprises maximize the value of their observability data. Building towards the industry’s first fully integrated telemetry pipeline , Honeycomb adds the ability to access archived telemetry data with a single click for full fidelity analysis from low cost storage, as well as powerful new ways to sample telemetry data and control costs.| Honeycomb
When it comes to observability, people often refer to its three pillars: metrics, tracing, and logging. At VictoriaMetrics, we already have solutions for metrics and logging. Throughout these years, we’ve heard a common question from the community: When will VictoriaTraces be released? If you are interested in this topic, then this blog post is for you. We’ll share the results of our research into distributed tracing and explore two key questions: Will there be a VictoriaTraces? And how c...| VictoriaMetrics
Cut observability costs and noise by pairing OpenTelemetry with a centralized pipeline. Learn how Mezmo and Checkly streamline data and speed up resolution.| Checkly Blog: Monitoring Insights & Trends
Embrace combines open-source SDKs with an analysis dashboard to help the entire engineering team understand exactly what is disrupting mobile user experiences.| Embrace
We caught up with Michael Garski, Director of Platform Engineering at Fender, to hear how things are going with Honeycomb for Frontend Observability.| Honeycomb
How with the power of observability, teams can move faster, fix issues before they arise, and focus on what truly matters and increase velocity.| Digma
In this post, I focus on a middleware technique to add span links between request traces on ASP.NET Core during internal redirects on NET 9.| Steve Gordon - Code with Steve
In this post, I share a solution to programmatically disable the recording (exporting) of an Activity when instrumenting code for OpenTelemetry.| Steve Gordon - Code with Steve
We are thrilled to announce the release of Stalwart Mail Server version 0.9.1, which comes packed with significant enhancements to our telemetry capabilities. This release marks a major milestone in our ongoing efforts to provide robust and efficient monitoring and logging solutions, ensuring our users can achieve optimal server performance and reliability.| stalw.art
Embrace is modernizing full-stack observability by providing open source, portable, and extensible mobile frameworks to OTel for site reliability and developer teams.| Embrace
I was invited to chat with the Packet Pushers folk on 'OpenTelemetry – Getting From Visibility To Observability With Ben Hall'. Looks like I pushed a show that's typically around 40 minutes long, over an hour for my guest appearance. Hope it's a good listen and you learn something new, audience!| Failing Fast
At its core, OpenTelemetry (OTel) is a vendor-neutral standard for telemetry. But it also provides a complete end-to-end implementation for generating, emitting, collecting, processing and exporting telemetry data to any support observability back-end.| Failing Fast