
Why Network Monitoring Is Important For Any Business
Why Network Monitoring Is Important For Any Business| blog.paessler.com
Why Network Monitoring Is Important For Any Business| blog.paessler.com
3 AM (aka the 'witching hour'). Something broke. You've got dozens of open tabs with server log files that you are desperately trying to make sense of. We've all been there - you're scanning through thousands of timestamped entries, frantically looking for that one anomalous line that can tell you why your application went down, the server lost connection, or why all your users suddenly can't log in. Server log files are supposed to make our lives easier, not harder. Yet without effective log...| Paessler Blog (English)
Serverless monitoring tools need to address unique observability challenges. Applications in the cloud give you something great: less infrastructure to worry about, automatic scaling, and you only pay for what you use. It's like outsourcing half your sysadmin headaches. But then you deploy your first AWS Lambda function, Google Cloud Function, or Azure Function, and you're staring into a black box. Your code runs... somewhere. How's it doing? Your traditional monitoring solutions suddenly fee...| Paessler Blog (English)
In the hyperconnected world, mobile network performance monitoring is crucial for staying online and never missing a beat. With the widespread adoption of mobile networks for business activities, it is vital to understand how to monitor network performance to avoid downtime, high latency, and overall interruptions.| Paessler Blog (English)

Discover how network monitoring transformed chaos into control, preventing outages, optimizing performance, and enhancing security with proactive strategies. Learn why it's essential for every IT team.| blog.paessler.com
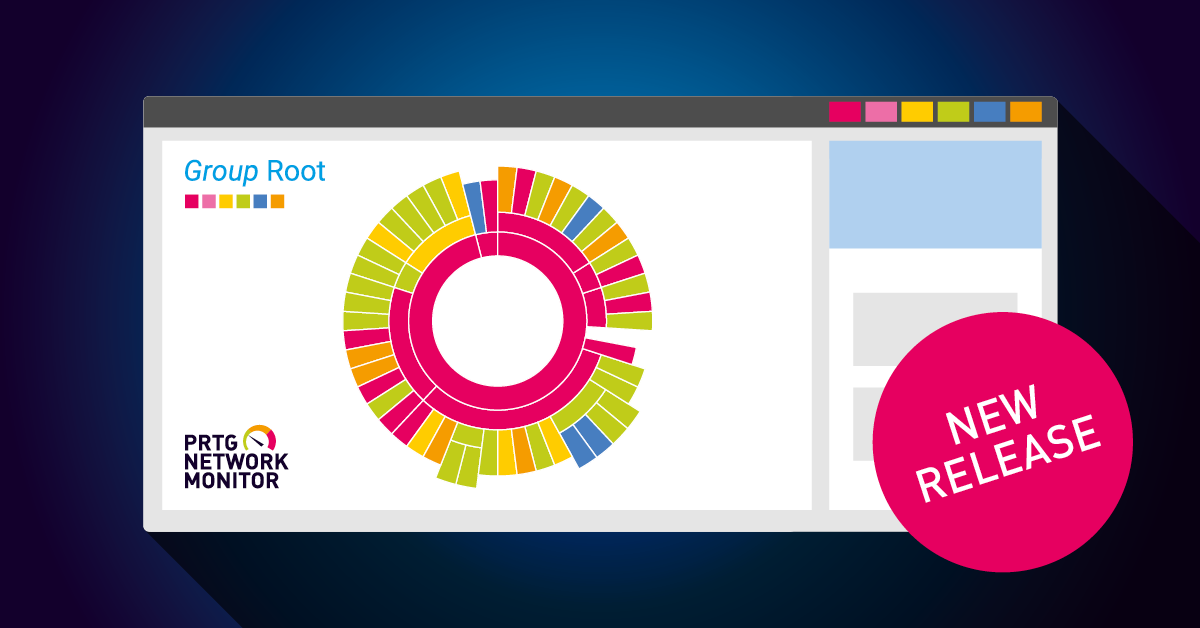
Visualizing monitoring data from multiple PRTG servers is now more powerful and accessible than ever. As a PRTG Enterprise Monitor customer, you can now use PRTG Multi-Core Dashboards at no additional cost. These dashboards enable you to create comprehensive visualizations and transform your infrastructure monitoring with modern capabilities.| Paessler Blog (English)
Ever had that sinking feeling after hearing about yet another massive data breach on the news? You're not alone. With cybercriminals constantly finding new ways to access and exploit sensitive information, keeping your personal data secure has never been more challenging, or more important. Data breach monitoring has become an essential security measure for anyone concerned about their digital footprint. Whether it's your social security number, credit card details, or login credentials, the ...| Paessler Blog (English)
The European managed service provider (MSP) sector is an exciting place to be right now. As remote work becomes the norm, businesses are racing to adopt cloud, IoT, and data-driven services, which means organizations across Europe are completely rethinking how they handle IT. The numbers don’t lie; the European managed services market nearly doubled from $88.57 billion in 2020 to a projected $196.61 billion by 2026 - that's over 8.5% growth every year, with the UK, Netherlands, Germany, and...| Paessler Blog (English)
Ever watched your team scramble when critical applications suddenly became unreachable? If you've worked in IT for more than a week, you've probably experienced the chaos and stress of network reliability problems. It's not just about the technical headaches, because network failures directly impact your organization's bottom line. According to Gartner research, downtime costs for large enterprises can range from $5,600 to $9,000 per minute. Network reliability isn't just a technical requirem...| Paessler Blog (English)
Ever had that moment when your phone explodes with calls because customers can't complete checkouts on your website? Or worse, found out about failed transactions only after seeing the dip in your revenue reports? If you're nodding along, you're not alone. Website transaction failures can significantly impact online businesses. By the time you notice them, the damage is often already done. Transaction failures and performance issues can lead to substantial revenue loss for e-commerce sites. W...| Paessler Blog (English)
Great news! We just released PRTG version 25.3.110 to the stable release channel. This version introduces two new sensor types that have successfully left their BETA status, a new experimental sensor, and numerous improvements and fixes.| Paessler Blog (English)

Learn how to identify and secure unknown devices on your network with detailed steps and advanced tools to protect your data and privacy.| blog.paessler.com
Explore the essential network protocols that enable internet communication, their functions, and how to monitor them effectively in real-world IT environments.| blog.paessler.com
Network monitoring can provide early prevention to certain issues: from technology, legal and personnel to natural and man-made risks.| blog.paessler.com
Here's how to make the creation of network maps easier with UVexplorer and PRTG monitoring software.| blog.paessler.com

Discover the essentials of network capacity planning to optimize network performance and enhance network management using tools like Paessler PRTG.| blog.paessler.com
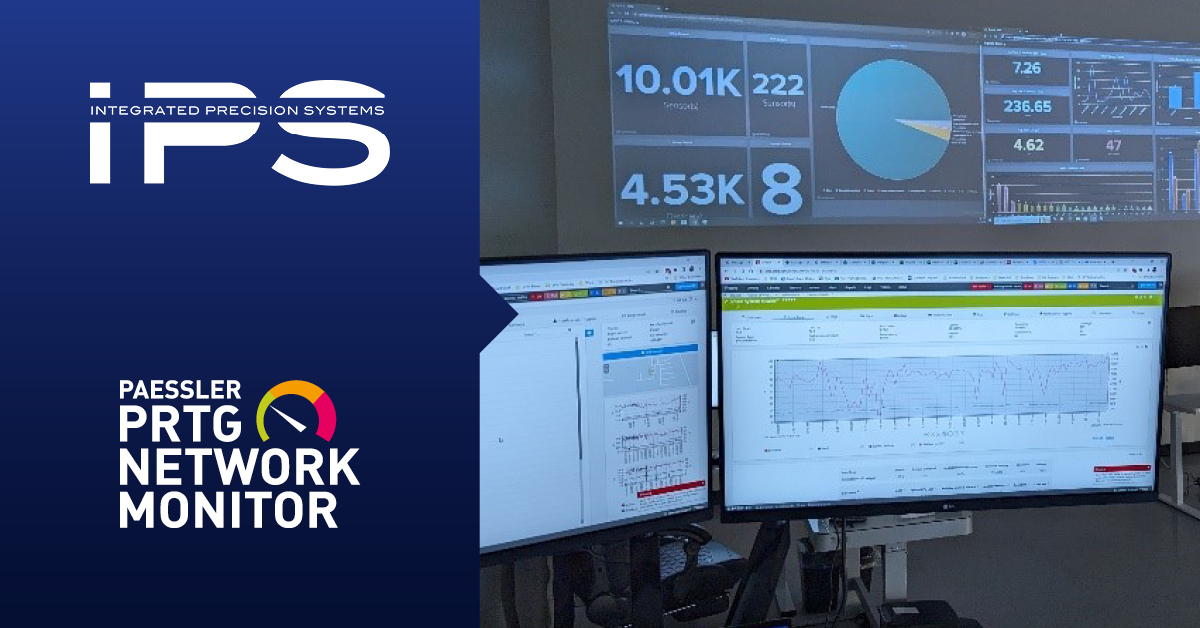
IPS’s business tripled in three years and the company surpassed its goal to monitor 20,000 endpoints two years earlier than planned.| blog.paessler.com

Everything you need to know about the Mean Opinion Score (MOS).| blog.paessler.com

Simplify Azure cloud monitoring with PRTG. Learn how to integrate metrics for streamlined performance tracking and proactive capacity management in your hybrid IT environment.| blog.paessler.com
Prevent IT issues before they arise with proactive monitoring strategies, leveraging AI and real-time metrics to ensure system health and optimal performance.| blog.paessler.com

Optimize Microsoft IIS performance with proactive monitoring. Learn key strategies to prevent downtime, enhance server health, and ensure smooth web app operations.| blog.paessler.com

Learn how to efficiently list and discover all network devices using command-line tools and automate inventory and monitoring across various platforms.| blog.paessler.com
How to keep track of your IT assets with PRTG and Lansweeper.| blog.paessler.com
Security through obscurity is no longer feasible for OT networks. Here's how to know what's in your OT network with PRTG and Moxa.| blog.paessler.com

IT documentation isn't that bad, is it? Discover why documentation is so important!| blog.paessler.com
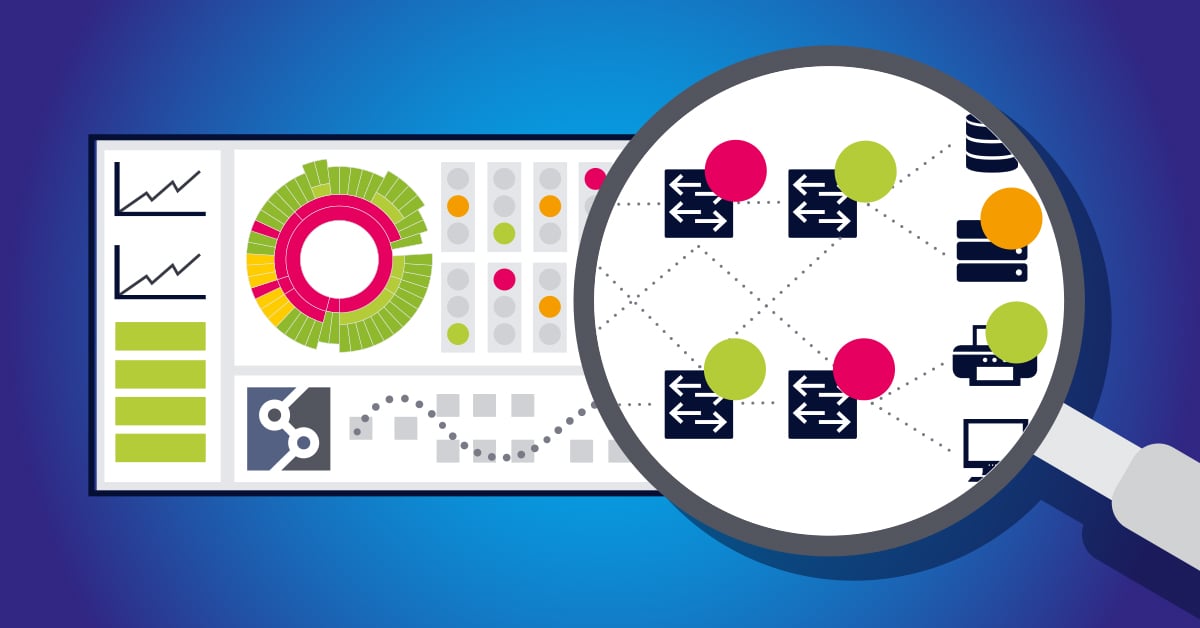
Optimize your IT workflow with effective network dashboards. Learn the essentials, practical tips, and examples for different teams to enhance network monitoring and performance.| blog.paessler.com

Learn how effective network dashboard design can transform data chaos into actionable insights, improve team collaboration, and enhance overall network performance.| blog.paessler.com

Network performance metrics that truly matter for IT professionals. Learn which key metrics predict problems, how to interpret them, and transform monitoring from reactive to proactive with PRTG.| blog.paessler.com
Learn how to create visual dashboards in PRTG that transform your monitoring data into clear, actionable insights for different stakeholders.| blog.paessler.com

Shape the future of PRTG with our new feature request system. Share your ideas and see them come to life. Your feedback matters!| blog.paessler.com
You're an IT geek, sys-admin, or just interested in Monitoring topics? Read this blog!| blog.paessler.com
PRTG 25.1.104 is here! Enjoy new sensors, essential fixes, improved lookups, and updated server settings for a smoother monitoring experience.| blog.paessler.com

Boost your IT infrastructure's efficiency and security with regular, tailored network assessments to uncover hidden vulnerabilities and optimize performance. Discover how to proactively protect your business.| blog.paessler.com

Discover why software updates are vital for security and compliance, and how PRTG monitoring helps detect vulnerabilities in your network.| blog.paessler.com
Learn how to configure and monitor SNMP traps in Paessler PRTG to enhance network performance and receive real-time notifications of critical events.| blog.paessler.com

Learn how to tackle network congestion, understand its causes, effects, and discover effective strategies to keep your IT infrastructure running smoothly.| blog.paessler.com
Unmask hidden devices on your network with PRTG. Learn how to identify and monitor every device to ensure cybersecurity and smooth network performance.| blog.paessler.com

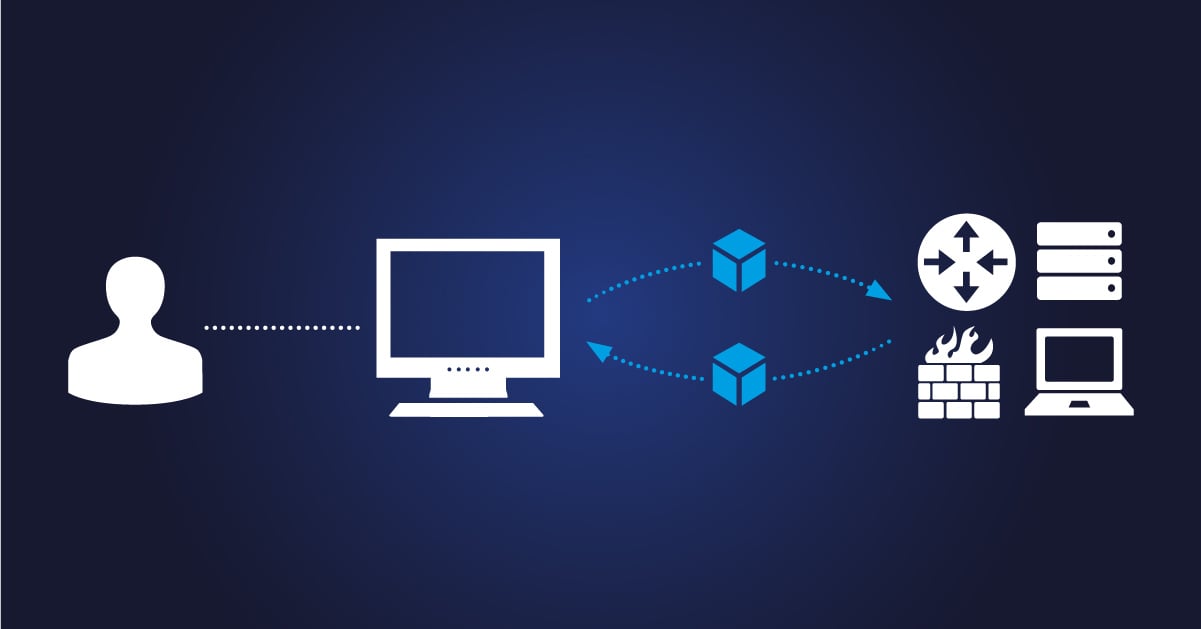
Understand the differences between active and passive monitoring and learn why both are essential for effective network management.| blog.paessler.com
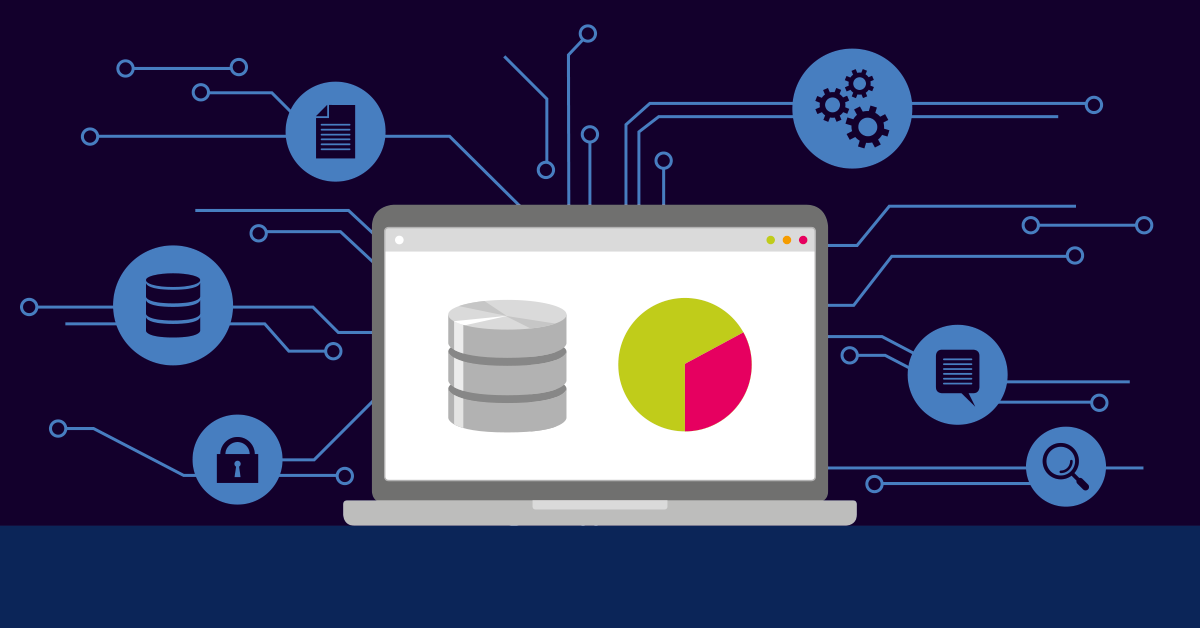
Discover the importance of database monitoring with PRTG Network Monitor. Track key metrics, ensure compliance, and optimize performance. Try it now!| blog.paessler.com

Easily upgrade your PRTG license for more sensors. Discover how you can seamlessly increase your monitoring capacity via the Paessler Portal.| blog.paessler.com
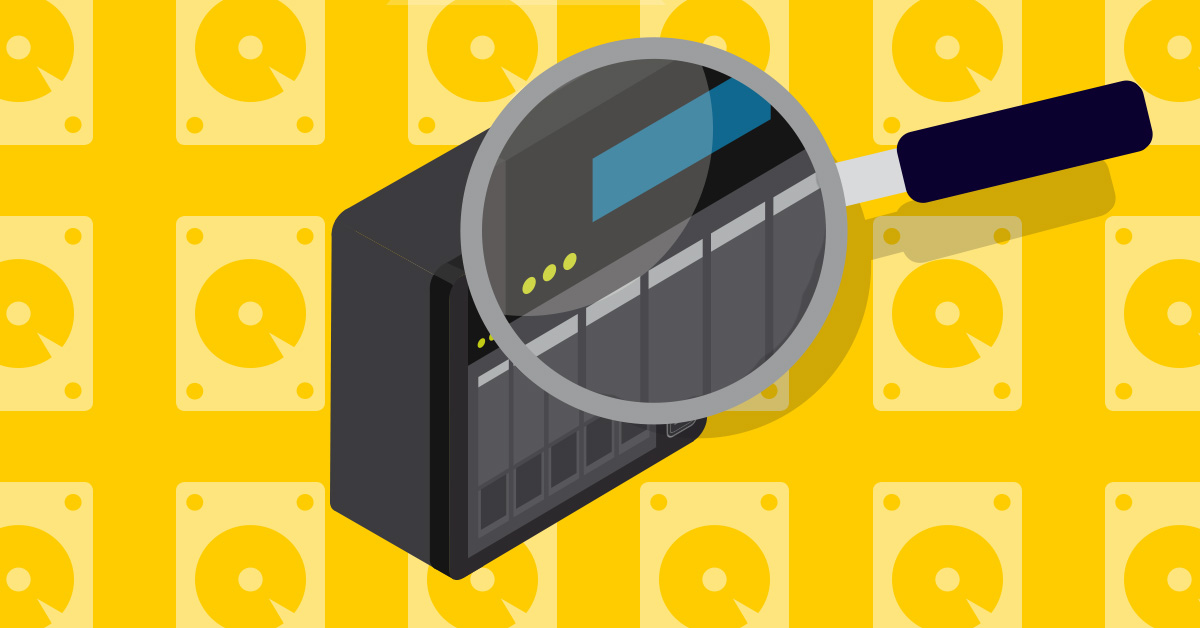
Learn how to monitor disk usage on your Synology NAS using PRTG to ensure optimal performance and avoid running out of storage space.| blog.paessler.com
