
Blog - Stats and R
Antoine Soetewey's blog| Stats and R
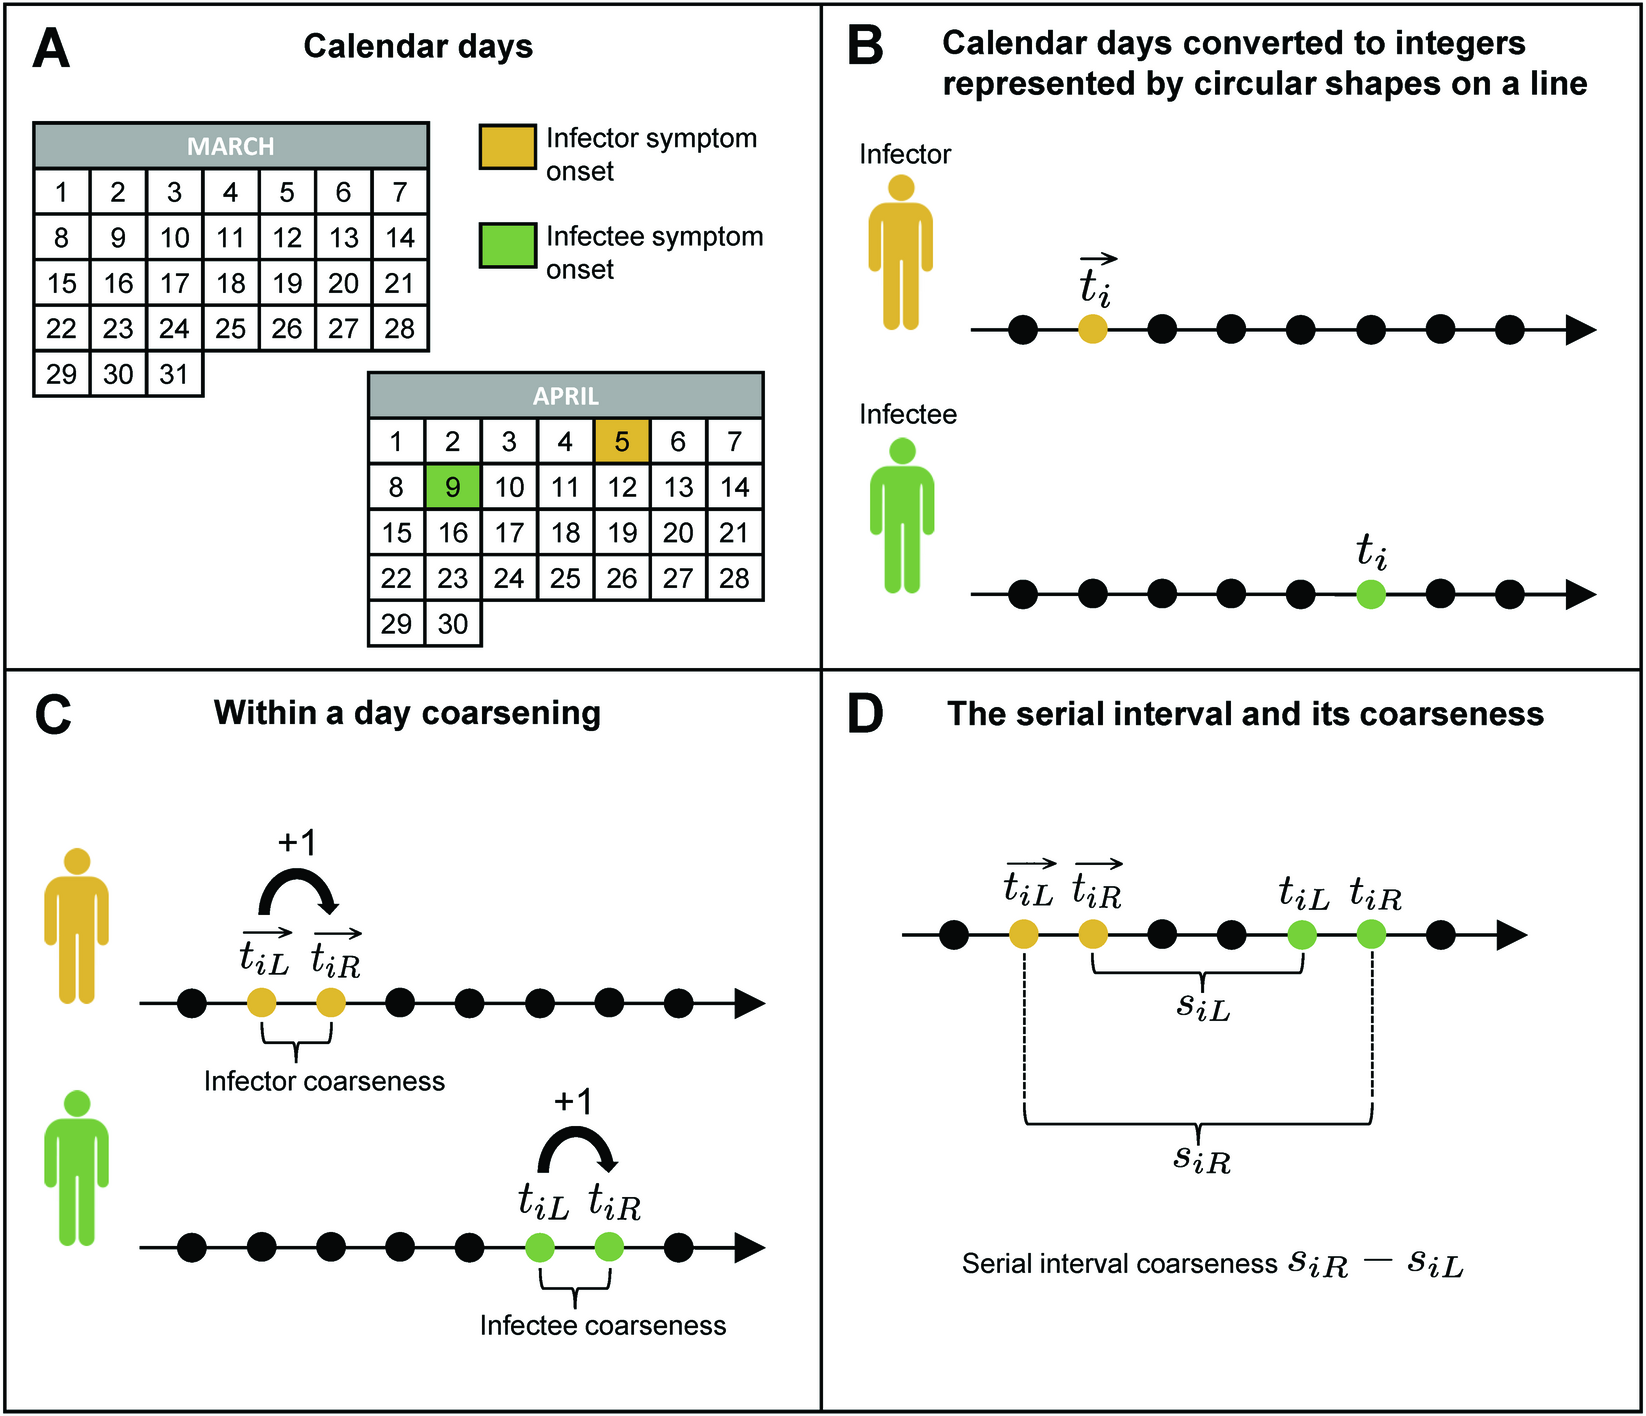
Learn how to estimate the serial interval of infectious diseases using a new nonparametric method with the EpiDelays R package| Stats and R

Publication of our paper Semi-Markov modeling for disease incidence risk and duration in the journal Biostatistics & Epidemiology| Stats and R
I am happy to announce that our paper entitled “Right to be forgotten for mortgage insurance issued to cancer survivors: critical assessment and new proposal” has been accepted for publication in European Actuarial Journal. In this paper, we propose an alternative method to determine the waiting period opening the right to be forgotten in insurance. This new method is based on a constraint imposed to the premium, which is then transposed into a target on the conditional observed survival.| Stats and R
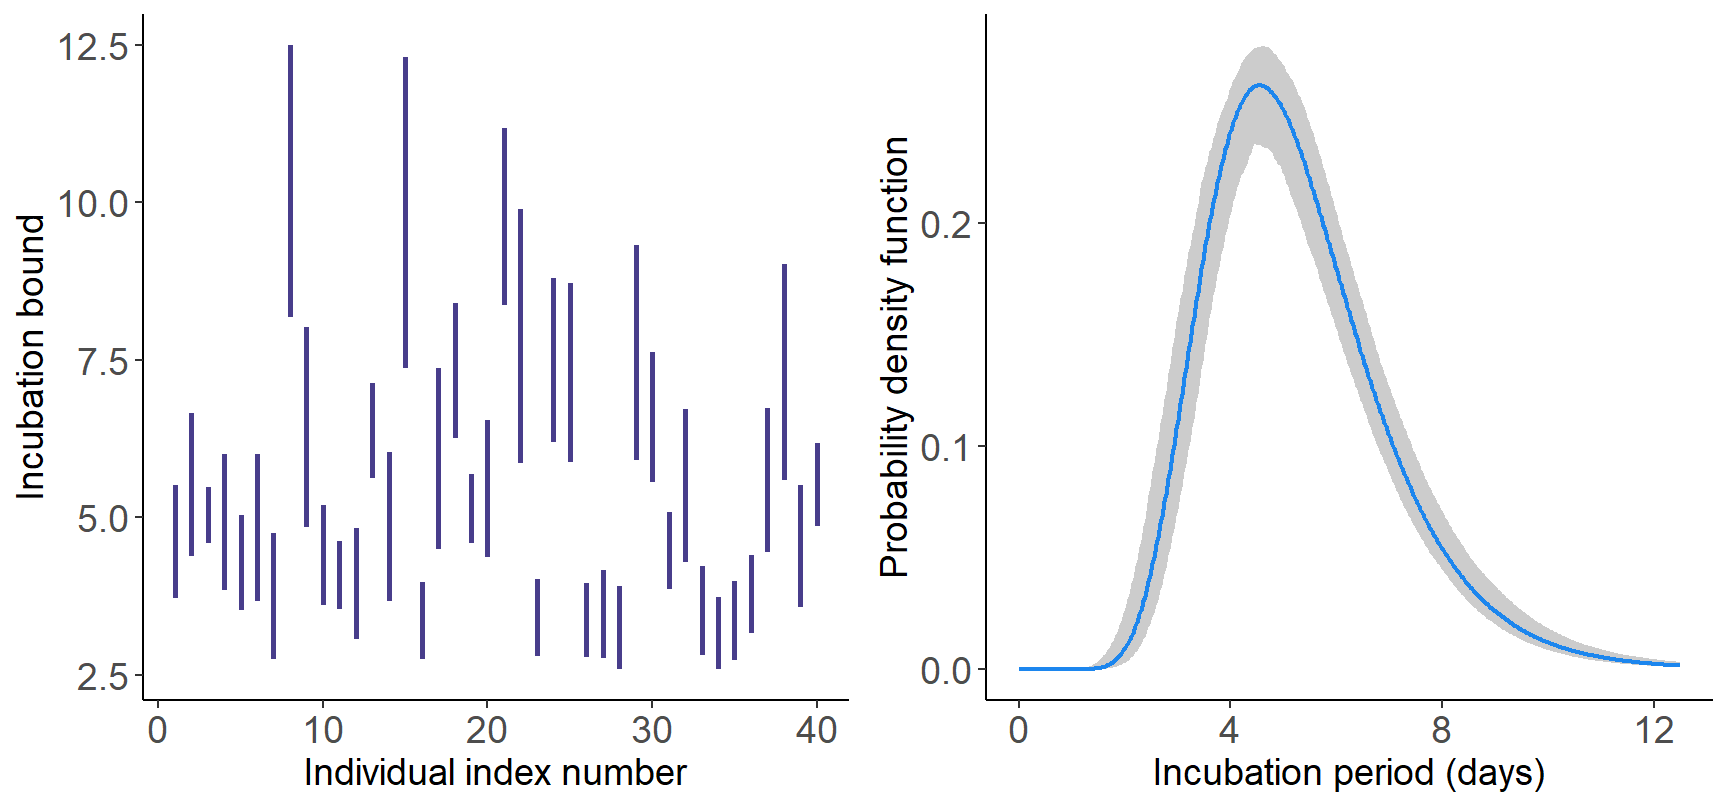
Explore how the {EpiLPS} R package can be used to estimate incubation times for various diseases| Stats and R

Learn when and how to use a (univariable and multivariable) binary logistic regression in R. Learn also how to interpret, visualize and report results| Stats and R

Learn how to use simulations and for loops in R to answer a probability question such as What is the probability that two persons have the same initials?| Stats and R

Learn to use the dplyr R package which helps you to solve the most common data manipulation challenges such as filtering, summarizing or sorting observations| Stats and R

Publication of our paper Impact of a food rebalancing program associated with plant-derived food supplements on the biometric, behavioral, and biological parameters of obese subjects| Stats and R

Learn how to compute the Pearson, Spearman and Kendall correlation coefficients by hand to evaluate the relationship between two variables| Stats and R

Learn how to perform a one-way Analysis Of VAriance (ANOVA) by hand to compare a quantitative measure between three groups or more| Stats and R

Learn how to do a two-way ANOVA in R. You will also learn its aim, hypotheses, assumptions, and how to interpret the results of the two-way ANOVA| Stats and R
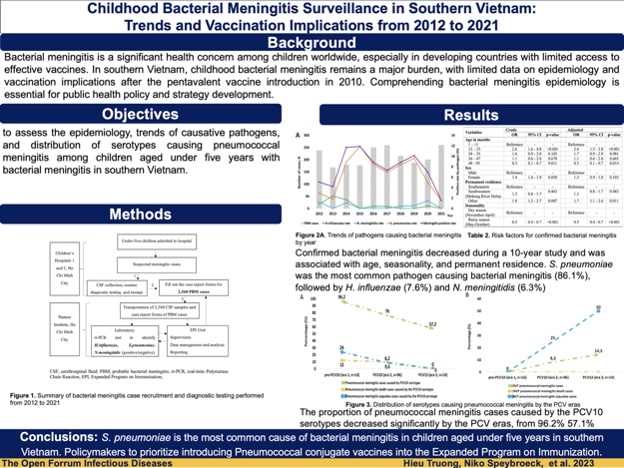
Publication of our research paper entitled Childhood Bacterial Meningitis Surveillance in Southern Vietnam Trends and Vaccination Implications from 2012 to 2021| Stats and R

In this post, I present 10 potential career options available with a degree in statistics, with a description and the required skills to pursue these jobs| Stats and R

In this post, I highlight the 10 most common errors in R and how to fix them. I also mention a couple of warnings (which are different than errors).| Stats and R

We present a tool that allows to extract data directly from a web page. This technique, referred as web scraping, is illustrated in R with a real life example| Stats and R

Learn more about survival analysis (also called time-to-event analysis), in which context and how it is used. Also learn how to apply it by hand and in R| Stats and R

Learn how to analyze and visualize Universal Analytics (UA) and Google Analytics 4 (GA4) data for your blog or website via the googleAnalyticsR package in R| Stats and R
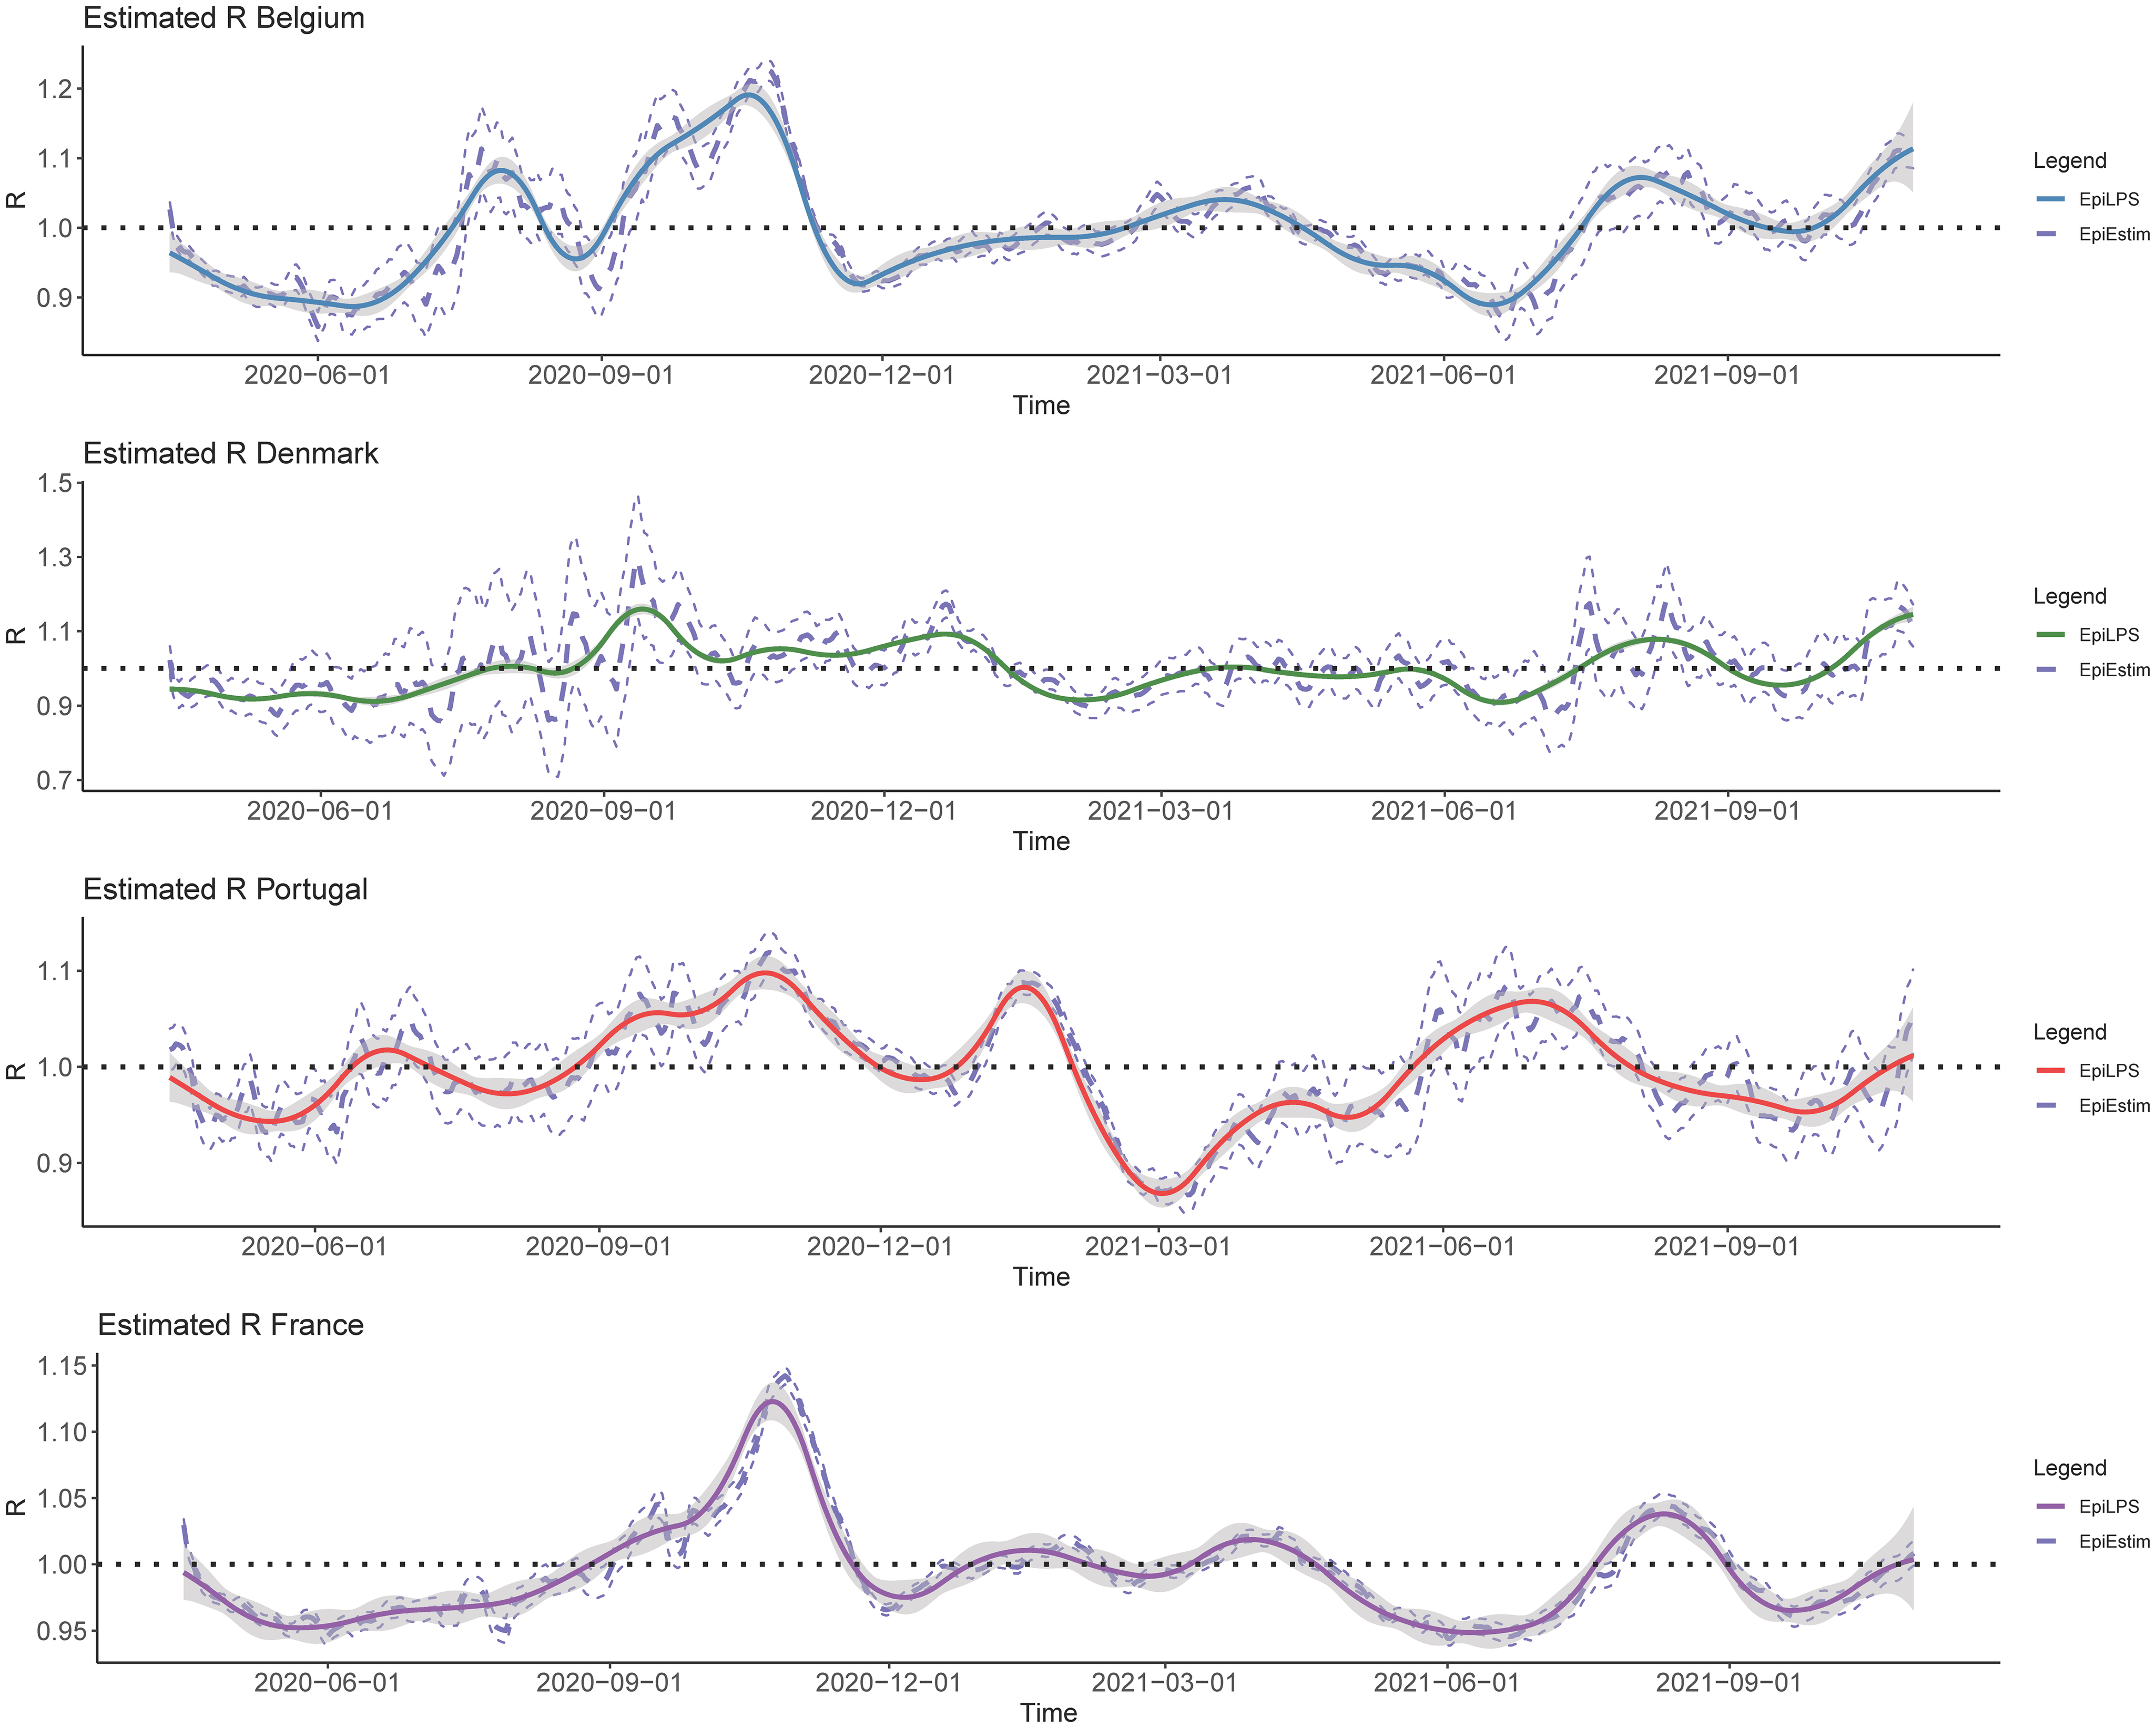
How to smooth epidemic curves and estimate the time-varying reproduction number in a flexible way? Read the EpiLPS methods paper (PLoS Computational Biology)| Stats and R

R is evolving rapidly and new functions are created everyday. See how to keep up to date with the latest R news via several twitter accounts and newsletters.| Stats and R

Learn when and how to do a one-sample Wilcoxon test in R. See also how to visualize and interpret the results with a concrete example.| Stats and R

What is the probability of winning for each ambassador in the television show Koh-Lanta 2022? Learn how to compute it in R through simulations and examples| Stats and R

Publication of my research paper entitled Semi-Markov modeling for cancer insurance in the European Actuarial Journal| Stats and R

Learn how to perform the Kruskal-Wallis test in R (the nonparametric version of the ANOVA) to compare 3 groups or more under the non-normality assumption| Stats and R

Learn how to track page views, sessions, users engagement and more Google Analytics data in R with the {googleAnayticsR} R package| Stats and R

Select the most appropriate statistical (hypothesis) test based on the number of variables and their types with the help of a flowchart| Stats and R

Learn how to run multiple and simple linear regression in R, how to interpret the results and how to verify the conditions of application| Stats and R

Type in the distance and the time you plan to run and this running pace calculator will give you your necessary pace and the splits| Stats and R

Learn the structure of a hypothesis test by hand, illustrated by 4 easy steps using the critical value, p-value and confidence interval methods| Stats and R

Learn how to track the performance of your blog or website in R by analyzing page views, sessions, users and engagement with the {googleAnayticsR} package| Stats and R

Publication of my research paper Waiting period from diagnosis for mortgage insurance issued to cancer survivors in the European Actuarial Journal| Stats and R

Learn how to perform an Analysis Of VAriance (ANOVA) in R to compare 3 groups or more. See also how to interpret the results and perform post-hoc tests| Stats and R

Learn about the 7 seven main benefits and reasons of having a data science blog and sharing your code, expertise and knowledge through your blog| Stats and R

Learn how to create professional graphics and plots in R (histogram, barplot, boxplot, scatter plot, line plot, density plot, etc.) with the ggplot2 package| Stats and R

Mortgage calculator - a R Shiny app to compute monthly loan or mortgage payments and to generate amortization tables| Stats and R

Learn how to detect outliers in R thanks to descriptive statistics and via the Hampel filter, the Grubbs, the Dixon and the Rosner tests for outliers| Stats and R

Learn how to do the Wilcoxon test (non-parametric version of the Student's t-test) in R, used to compare 2 groups when the normality assumption is violated| Stats and R
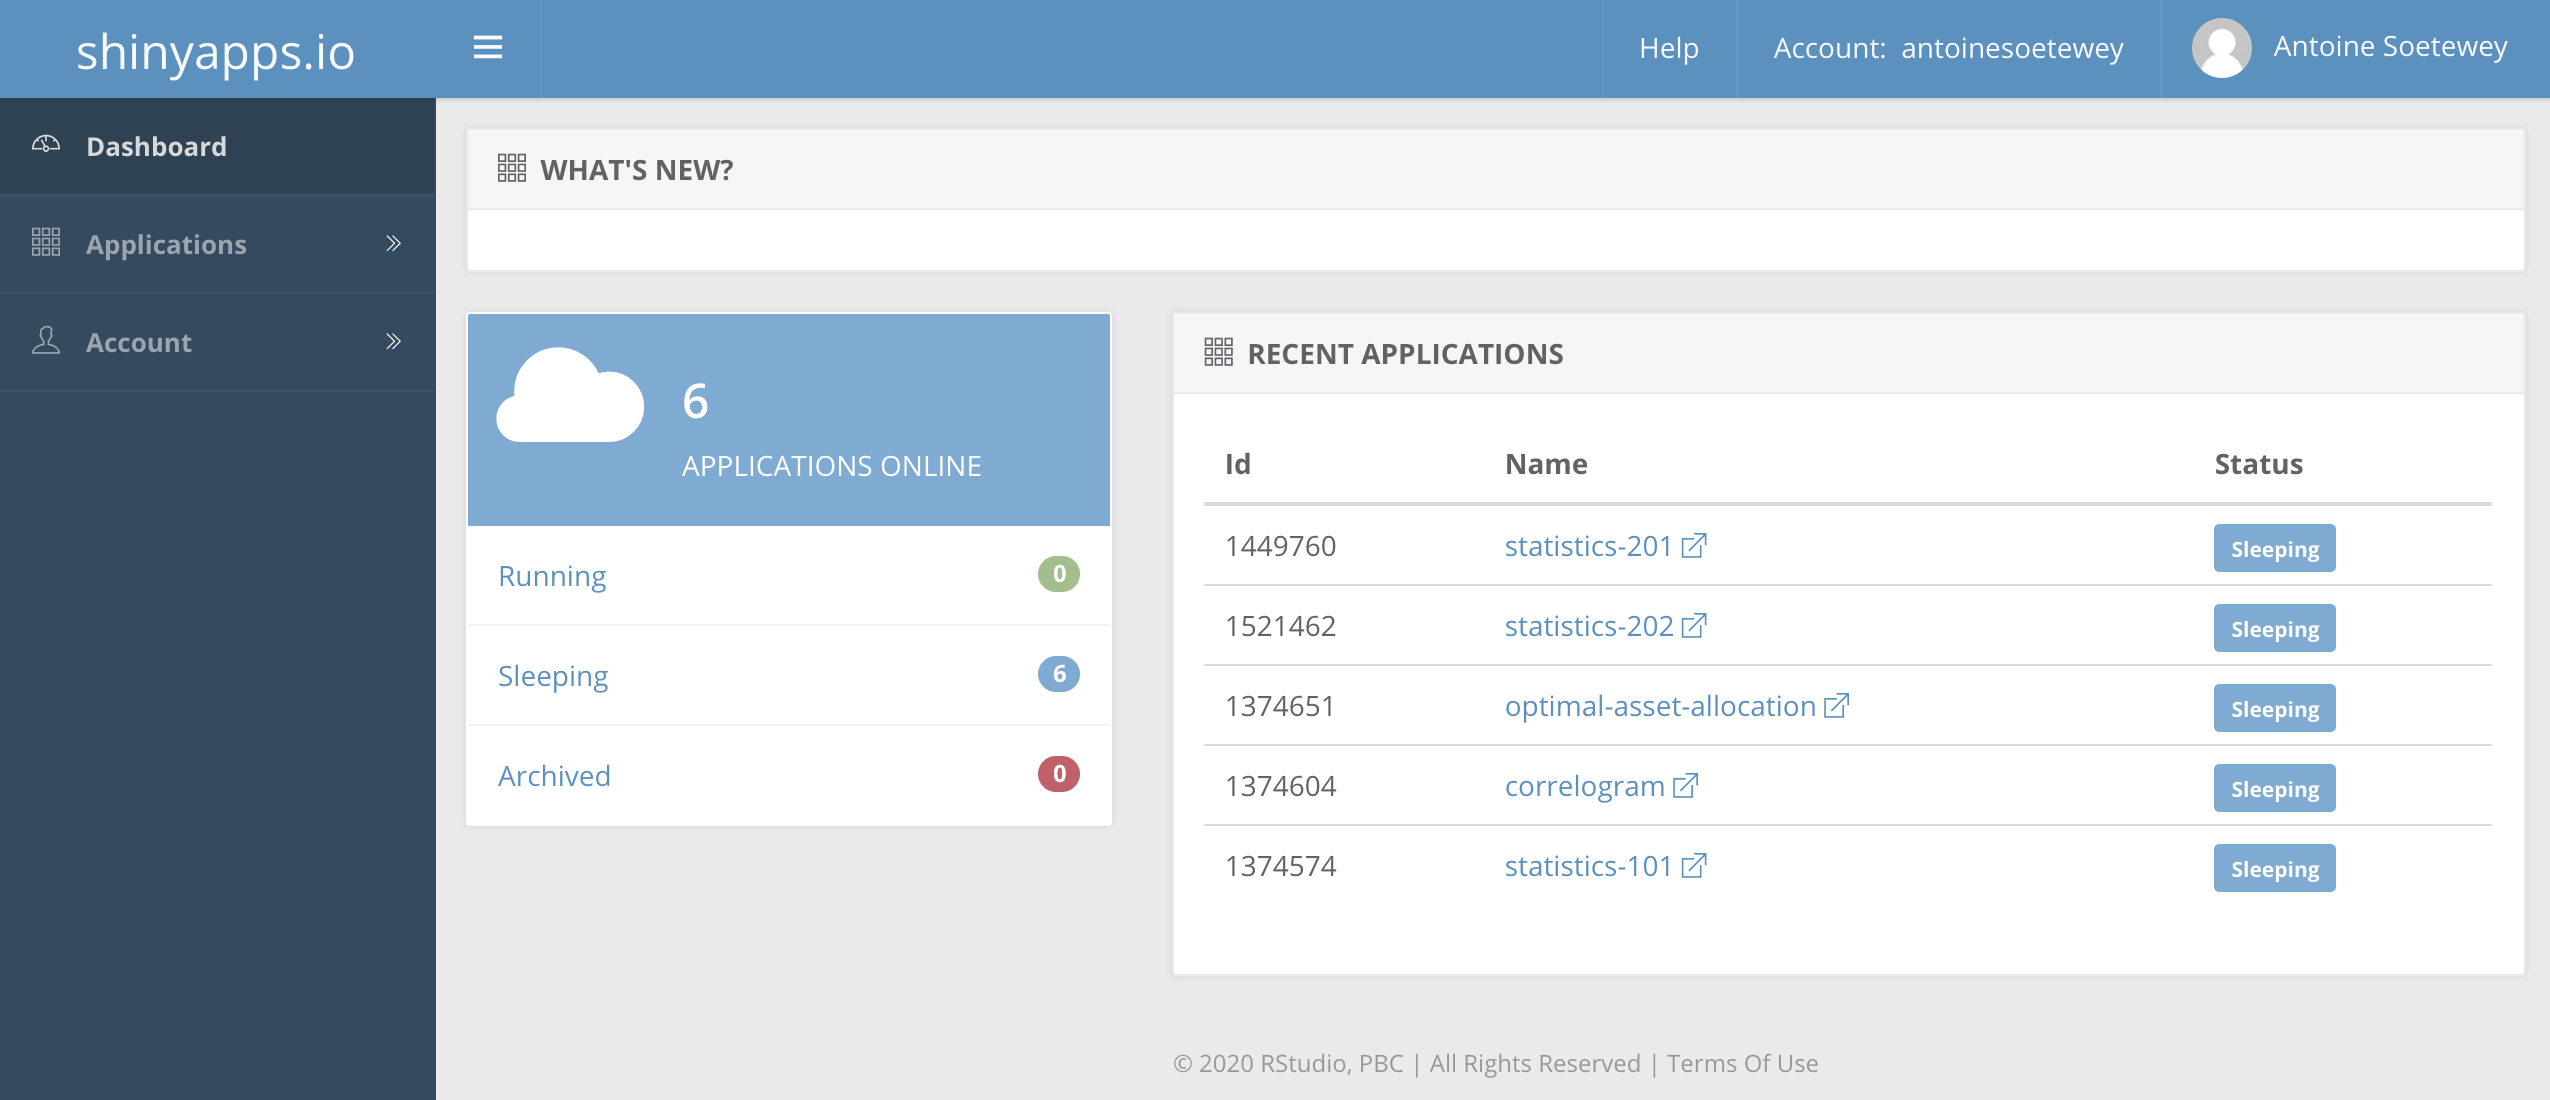
See a step-by-step guide (with screenshots) on how to deploy and publish online a Shiny app using shinyapps.io| Stats and R

Learn how to compute a correlation coefficient (Pearson and Spearman) and perform a correlation test in R| Stats and R
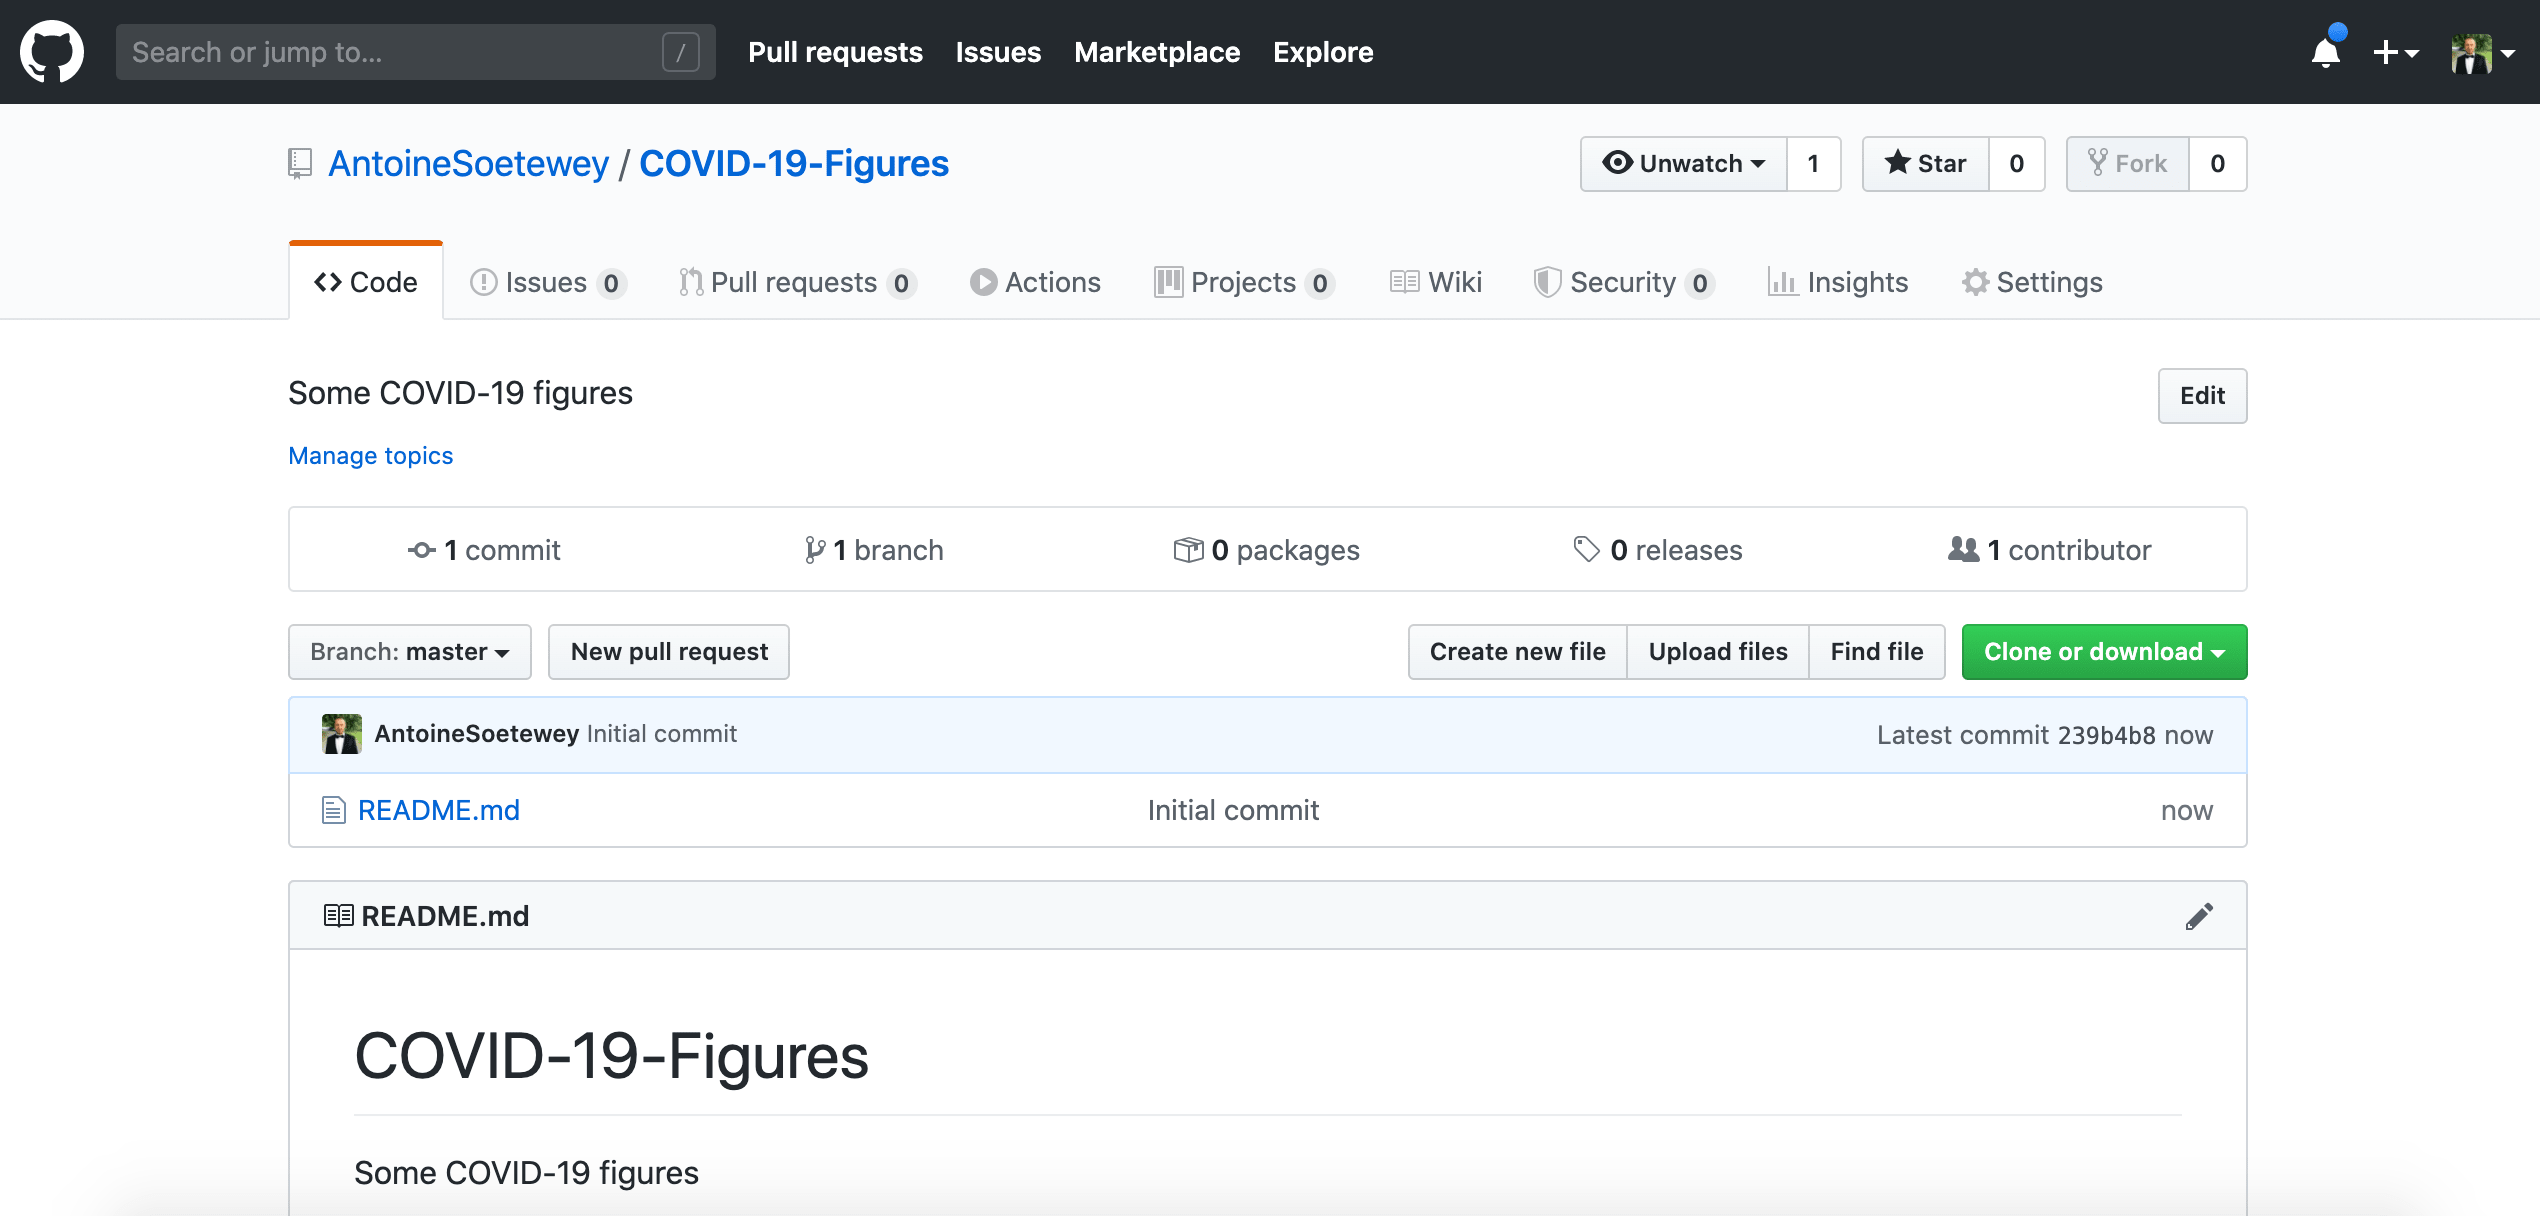
See a step-by-step guide (with screenshots) on how to create a GitHub repository and upload R code and scripts on MacOS using GitHub desktop| Stats and R
Here is a summary of press mentions of the blog: How can we predict the evolution of COVID 19 in Belgium? (UCLouvain: in English & in French) Evolution of COVID-19 hospital admissions in Belgium (LN24) Contact and social profiles Contact me Twitter Medium LinkedIn GitHub| Stats and R
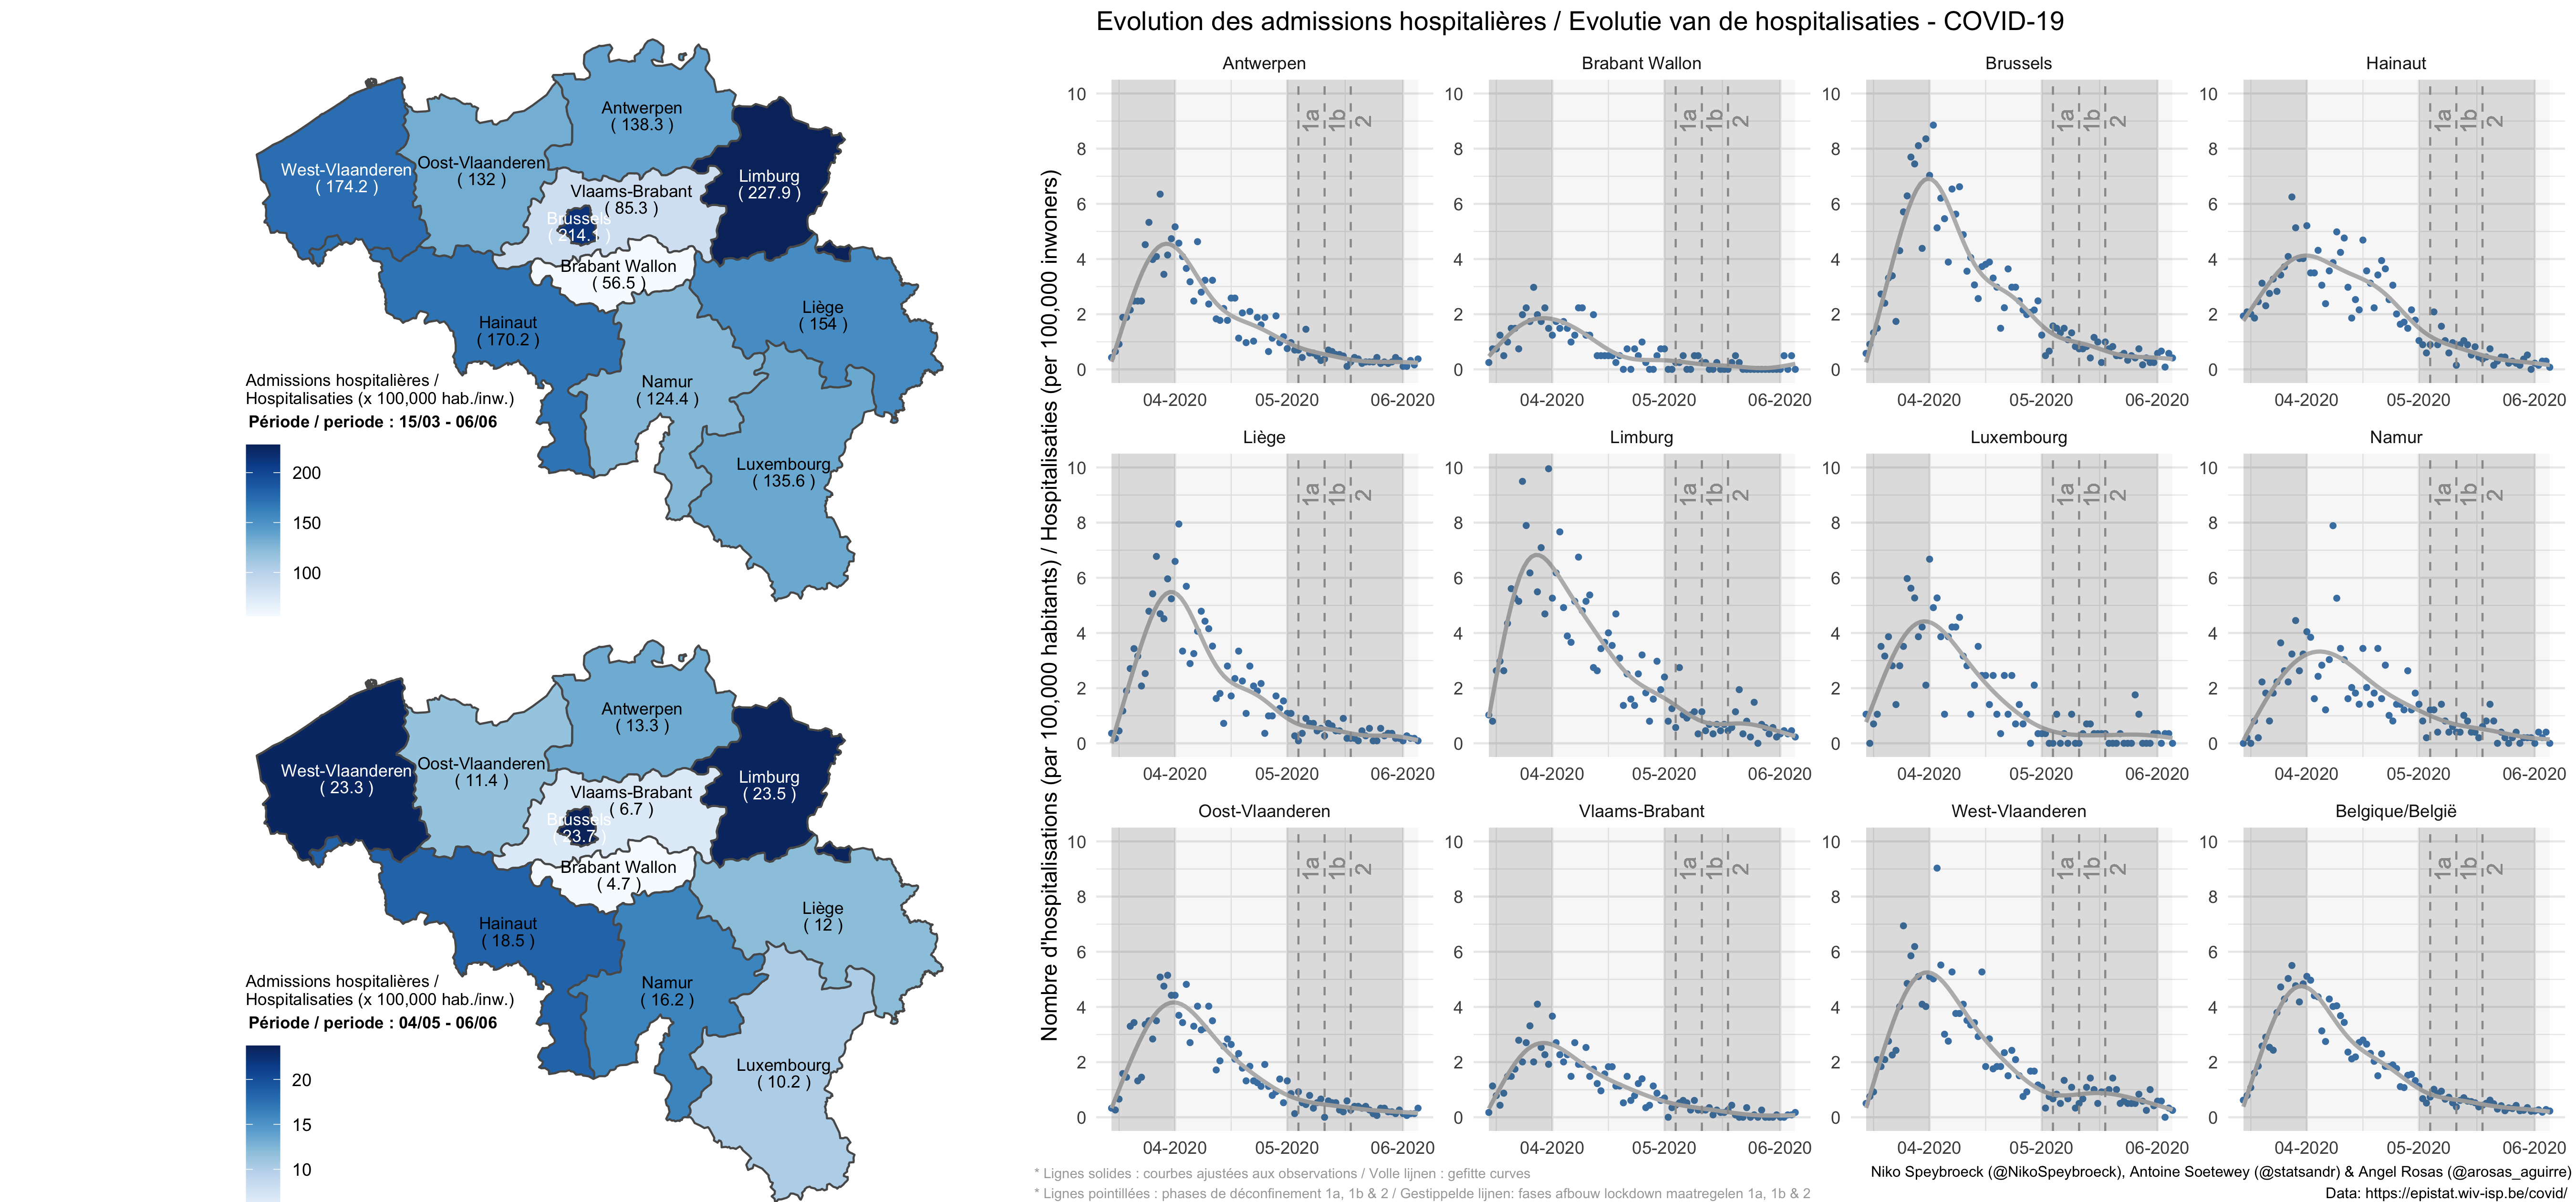
Evolution of hospital admissions and number of new confirmed cases due to COVID-19 in Belgium (by province and a the national level)| Stats and R

Learn how to perform the one proportion and goodness of fit test (useful to check if a distribution follows a specific known distribution) in R and by hand| Stats and R

This article presents a R package which allows to download free data science books in PDF that are made available by Springer during the COVID-19 quarantine| Stats and R

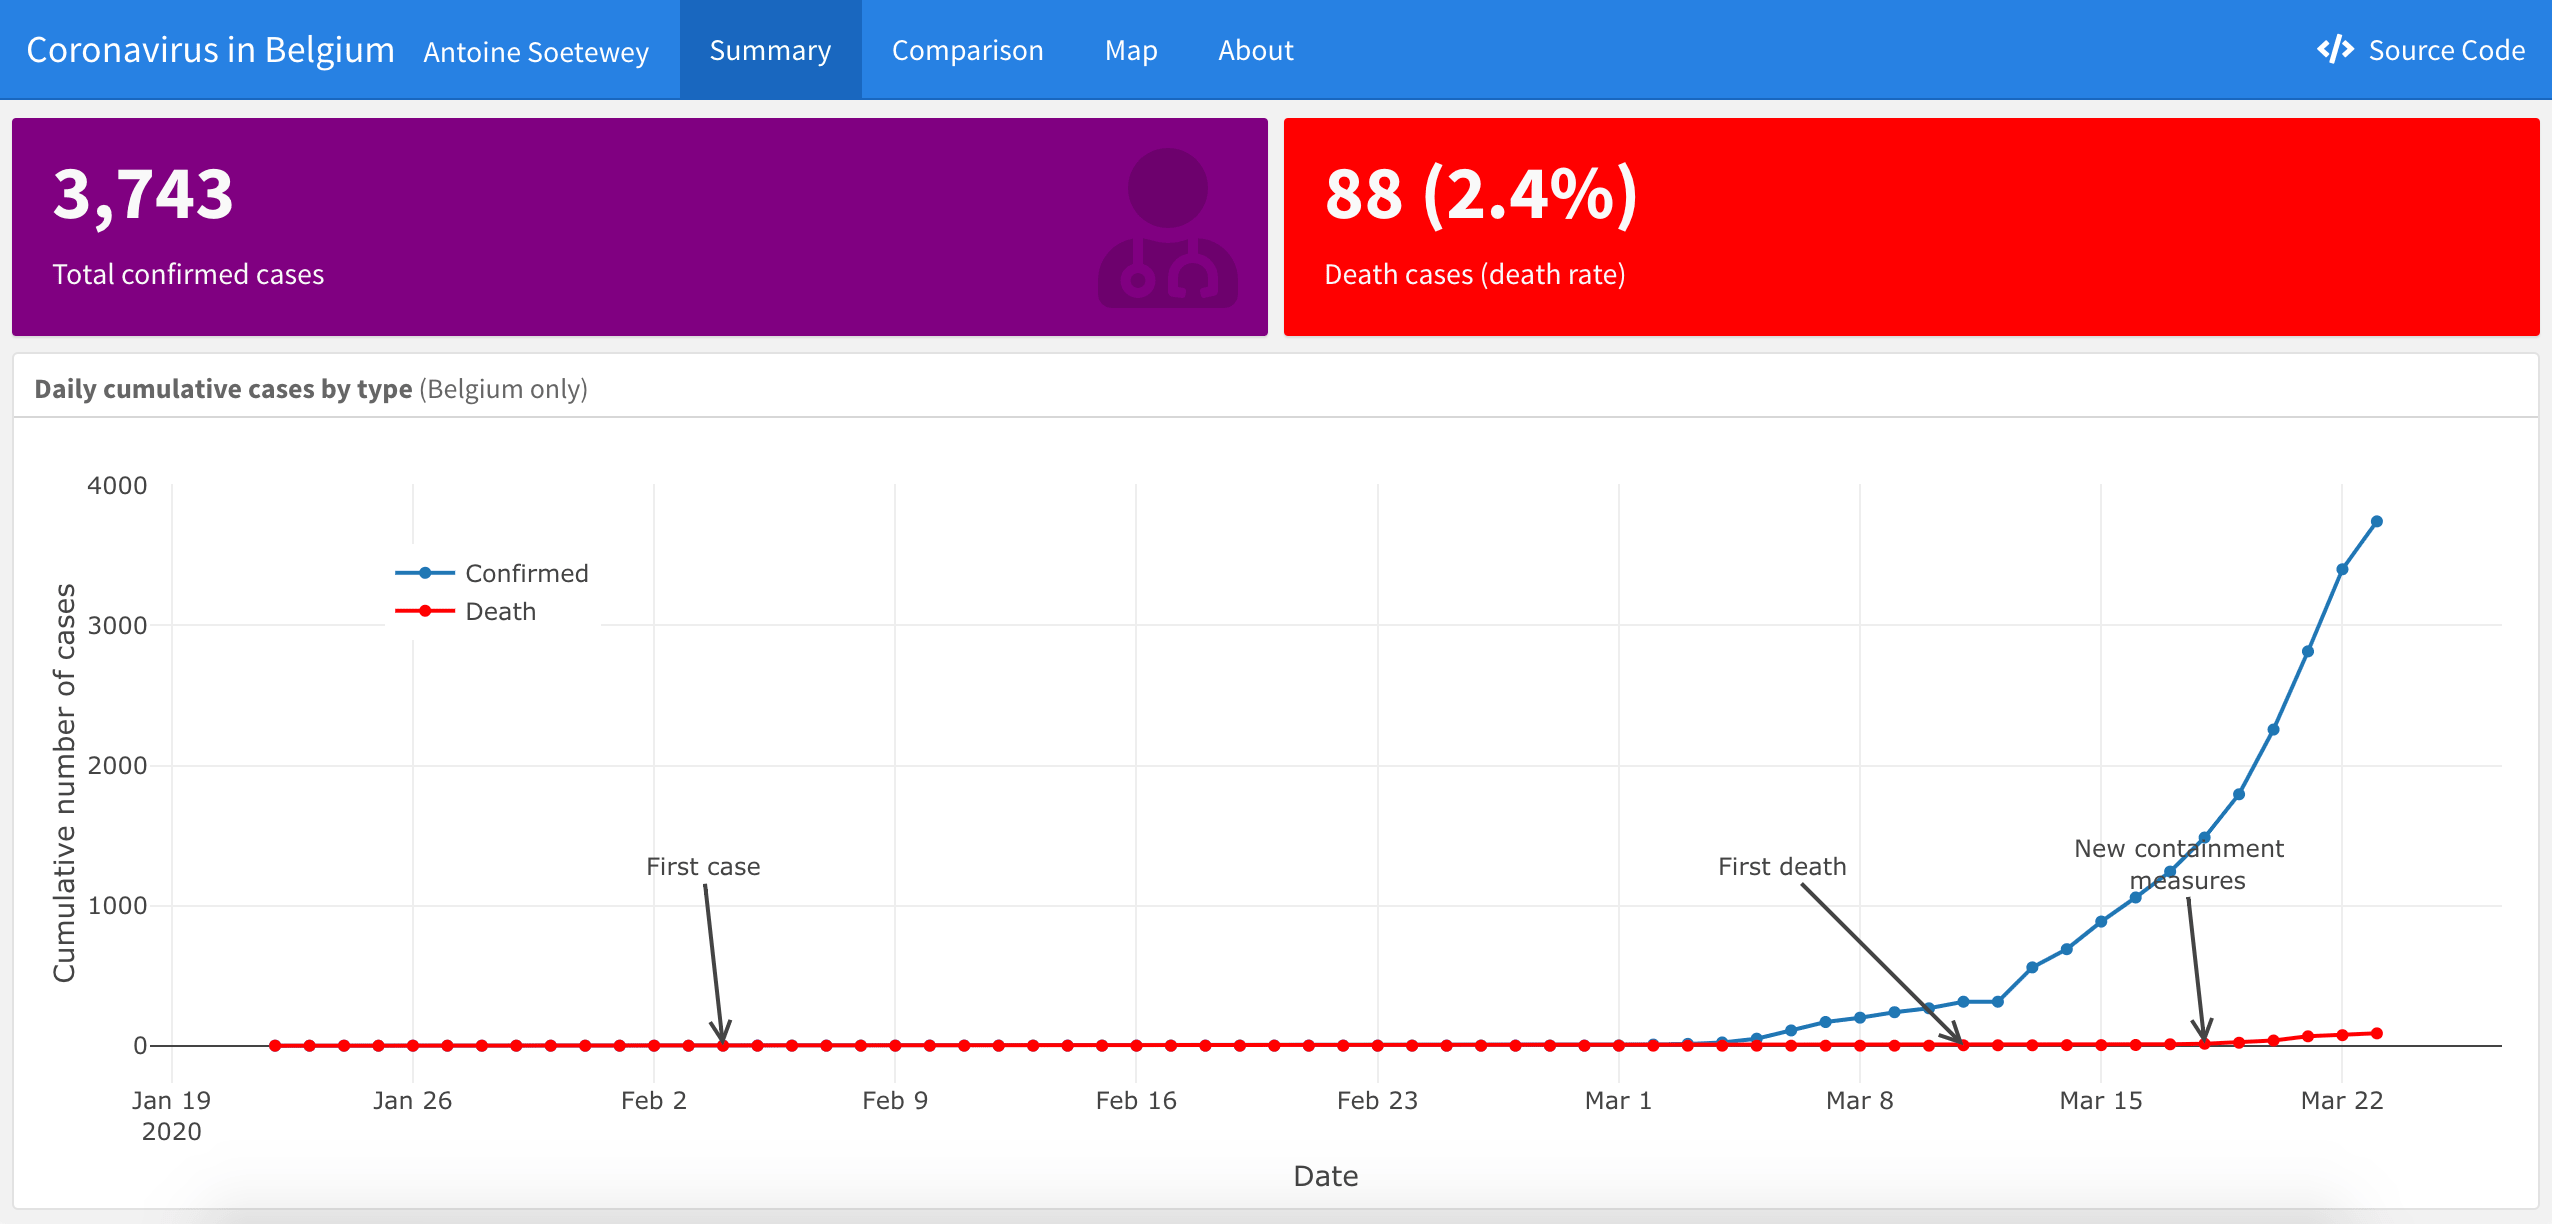
This article presents an analysis of the Novel COVID-19 Coronavirus in Belgium using R. Feel free to apply it to your own country| Stats and R
This article will help you to build a visually appealing dashboard about the spread of COVID-19 Coronavirus specific to a country in R using flexdashboard| Stats and R

Learn how to compare groups for multiple variables at once in R thanks to a Student t-test or ANOVA and communicate the results in a better way| Stats and R
Best R resources about Coronavirus (COVID-19). These resources are Shiny app, R packages or code that you can use freely to analyze the Coronavirus outbreak| Stats and R

Learn how to perform the one-sample t-test by hand and in R in order to compare a sample to a hypothesized value, with known or unknown population variance| Stats and R

Learn the 9 most important formulas in probability that every data scientist should understand and master to appropriately handle any project in probability| Stats and R
Who is behind this blog? What is your background? Why did you launch this blog? What technology and theme do you use to write this blog and the articles? I am new to this blog, to R or to statistics, from where can I start? Can I reuse or translate the content of your blog? I would like to replicate an analysis you have done in one of your article, can I have access to the entire code?| Stats and R

Learn how to apply the Student's t-test by hand and in R in order to compare two independent or paired samples with known or unknown variances| Stats and R

Make the the most correlated variables stand out via a correlogram. See also how to enhance a correlation plot to show significant correlations among variables| Stats and R

This article is a practical guide about R Markdown, from why it is an important writing tool in R to how to compile and edit your first R Markdown document| Stats and R

Learn how to perform clustering analysis, namely k-means and hierarchical clustering, by hand and in R. See also how the different clustering algorithms work| Stats and R
Stats and R welcomes guest posts that provides unique insight into statistics and R. How can you contribute? If you want to contribute and write a guest post for statsandr.com, please submit your article through this contribution form. Once your guest post is received, I will review it and inform you about the decision (i.e., accepted, rejected, or accepted with minor changes). Submission rules and guidelines Before submitting your article, please read the following points:| Stats and R

What are R packages and how to use them? Discover also a more efficient way to install and load R packages in R thanks to the pacman and librarian packages| Stats and R

This article explains in details what is the normal or Gaussian distribution, its importance in statistics and how to test if your data is normally distributed| Stats and R

Learn the differences between the Chi-square test of independence and the Fisher's exact test. You will also learn how to implement the statistical test in R| Stats and R

Test if two categorical variables are dependent via the Chi-square test of independence. See also how to compute it by hand and how to interpret the results| Stats and R
Learn when and how to use the Chi-square test of independence in R. See also how it works in practice and how to interpret the results of the Chi-square test| Stats and R

This articles shows how to build your resume or CV in a timeline format. A timeline CV allows to present your professional experiences in a chronological order| Stats and R

Discover the best RStudio addins, how to use them in practice and how they can help you when writing code in R or R Markdown| Stats and R

Learn how to perform a descriptive analysis of your data in R, from simple descriptive statistics to more advanced graphics used to describe your data at hand| Stats and R
On this blog, I share my knowledge in the form of free articles and tutorials about statistics and R. My goal with the blog is to help people to understand statistical concepts (through examples and in plain English), and to apply them in R. When possible, I also contribute to open source projects on GitHub. All the articles, Shiny apps and code are open source and available to everyone (code available directly in the articles or on GitHub).| Stats and R

This article illustrates the main tips, tricks and shortcuts you can use in RStudio and R Markdown to write code more quickly and more efficiently| Stats and R

Learn how to perform a descriptive analysis of your data by hand. You will learn how to compute both location and dispersion measures to describe your data| Stats and R

This article explains how to distinguish a population from a sample, an important difference in statistics, namely for descriptive and inferential statistics| Stats and R
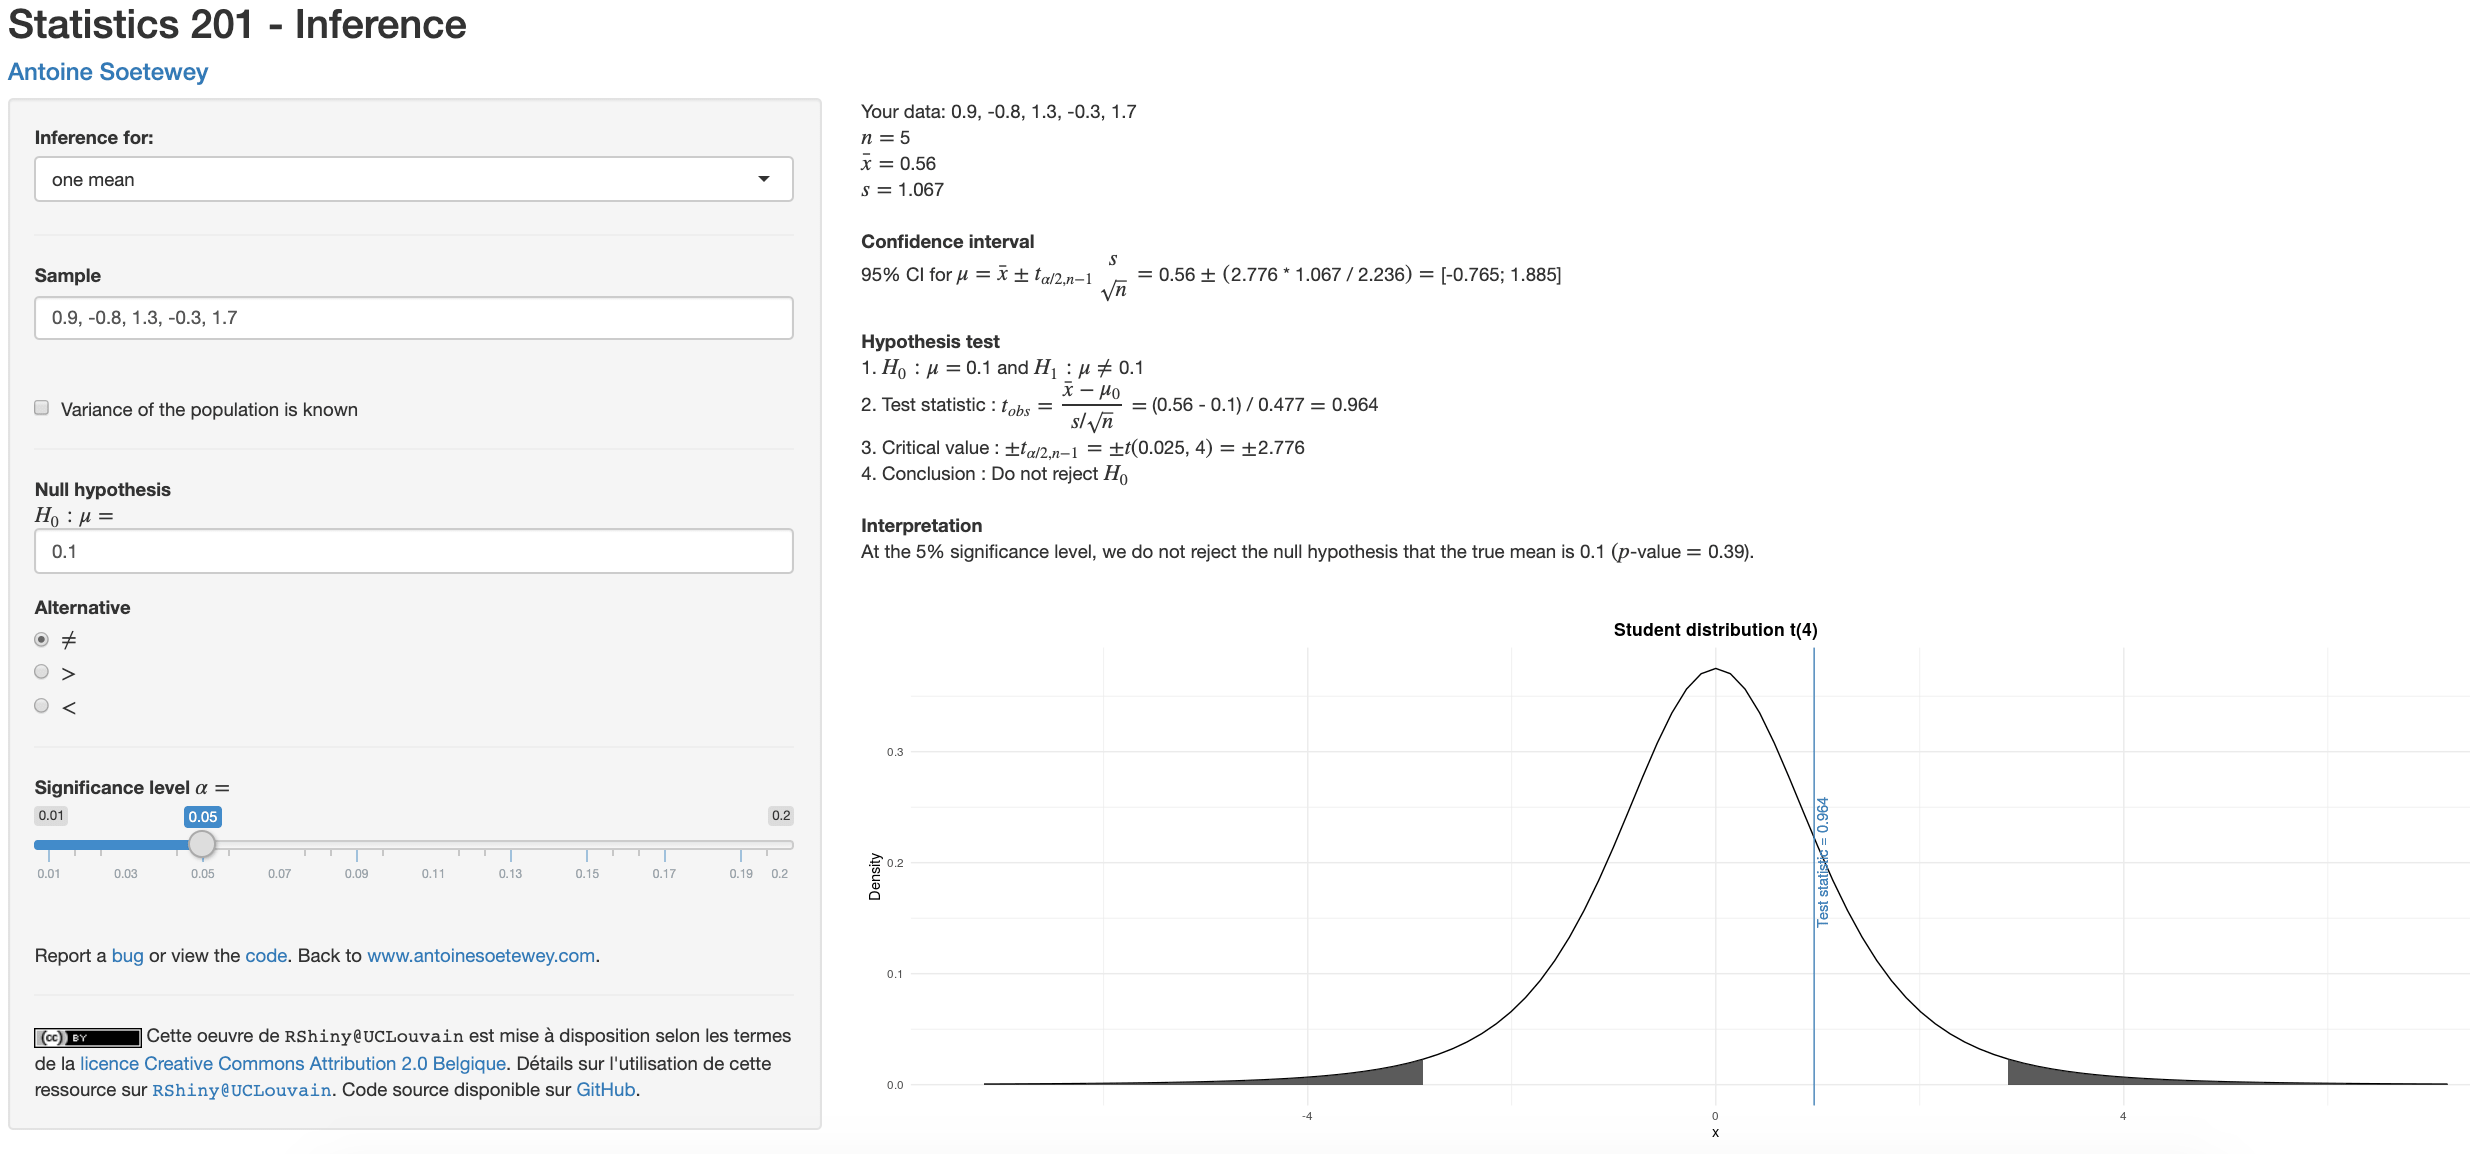
This article presents how to perform inferential statistics by hand, namely, confidence intervals and hypothesis tests for means, proportions and variances| Stats and R
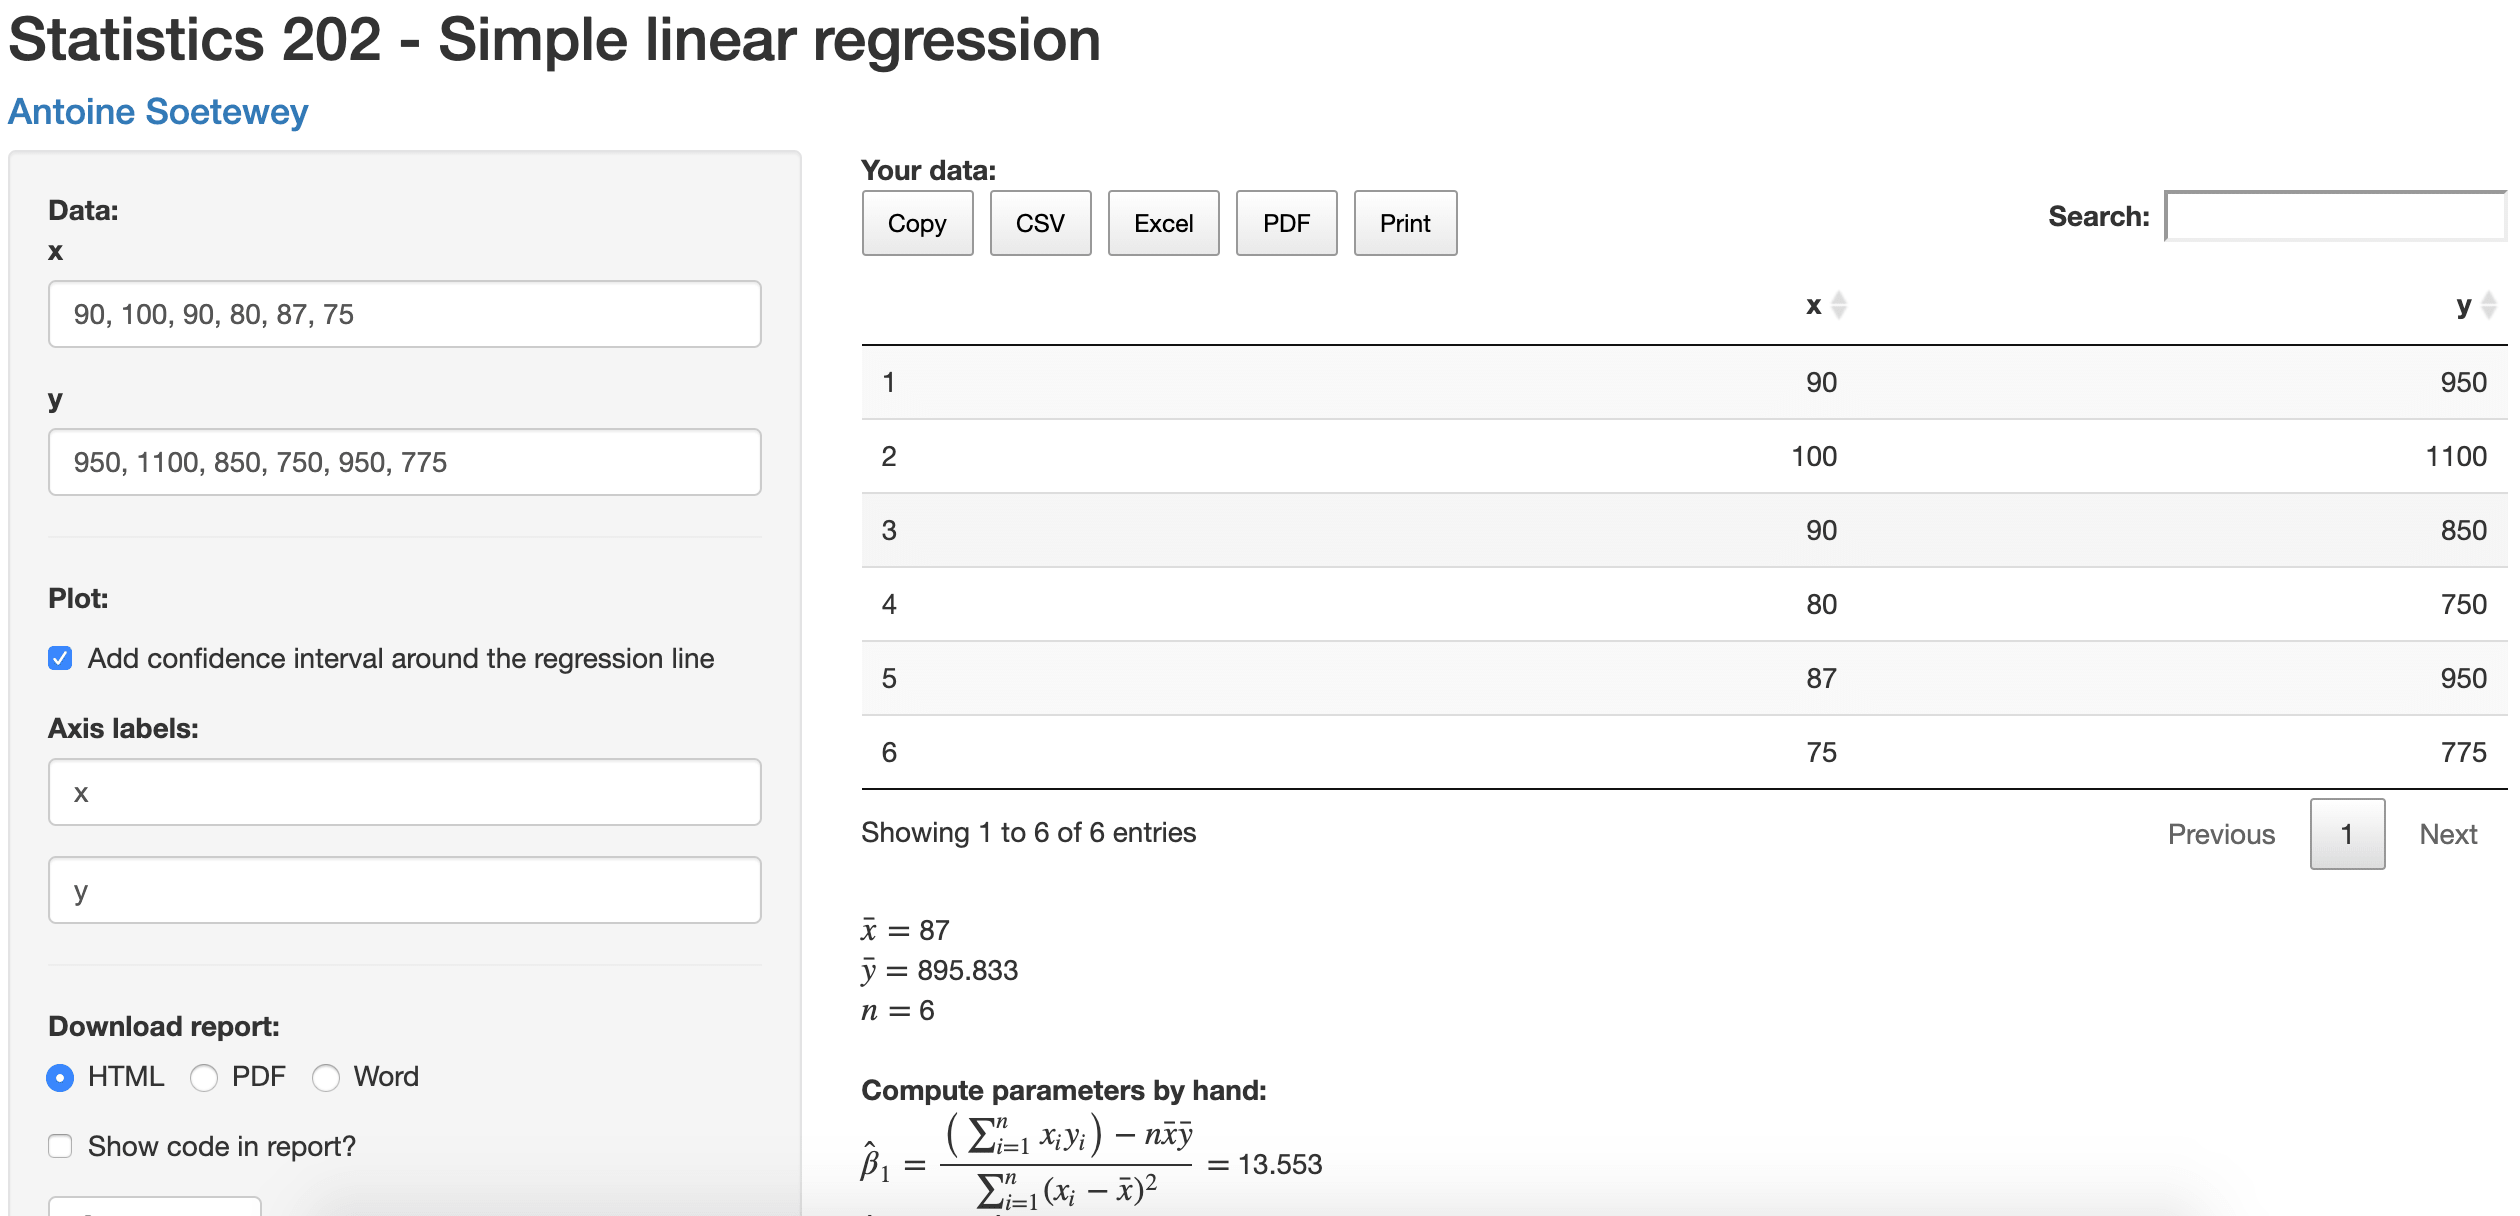
This article presents a Shiny app for computing simple linear regression by hand and in R. Add your own data, see the results and download them as a report| Stats and R
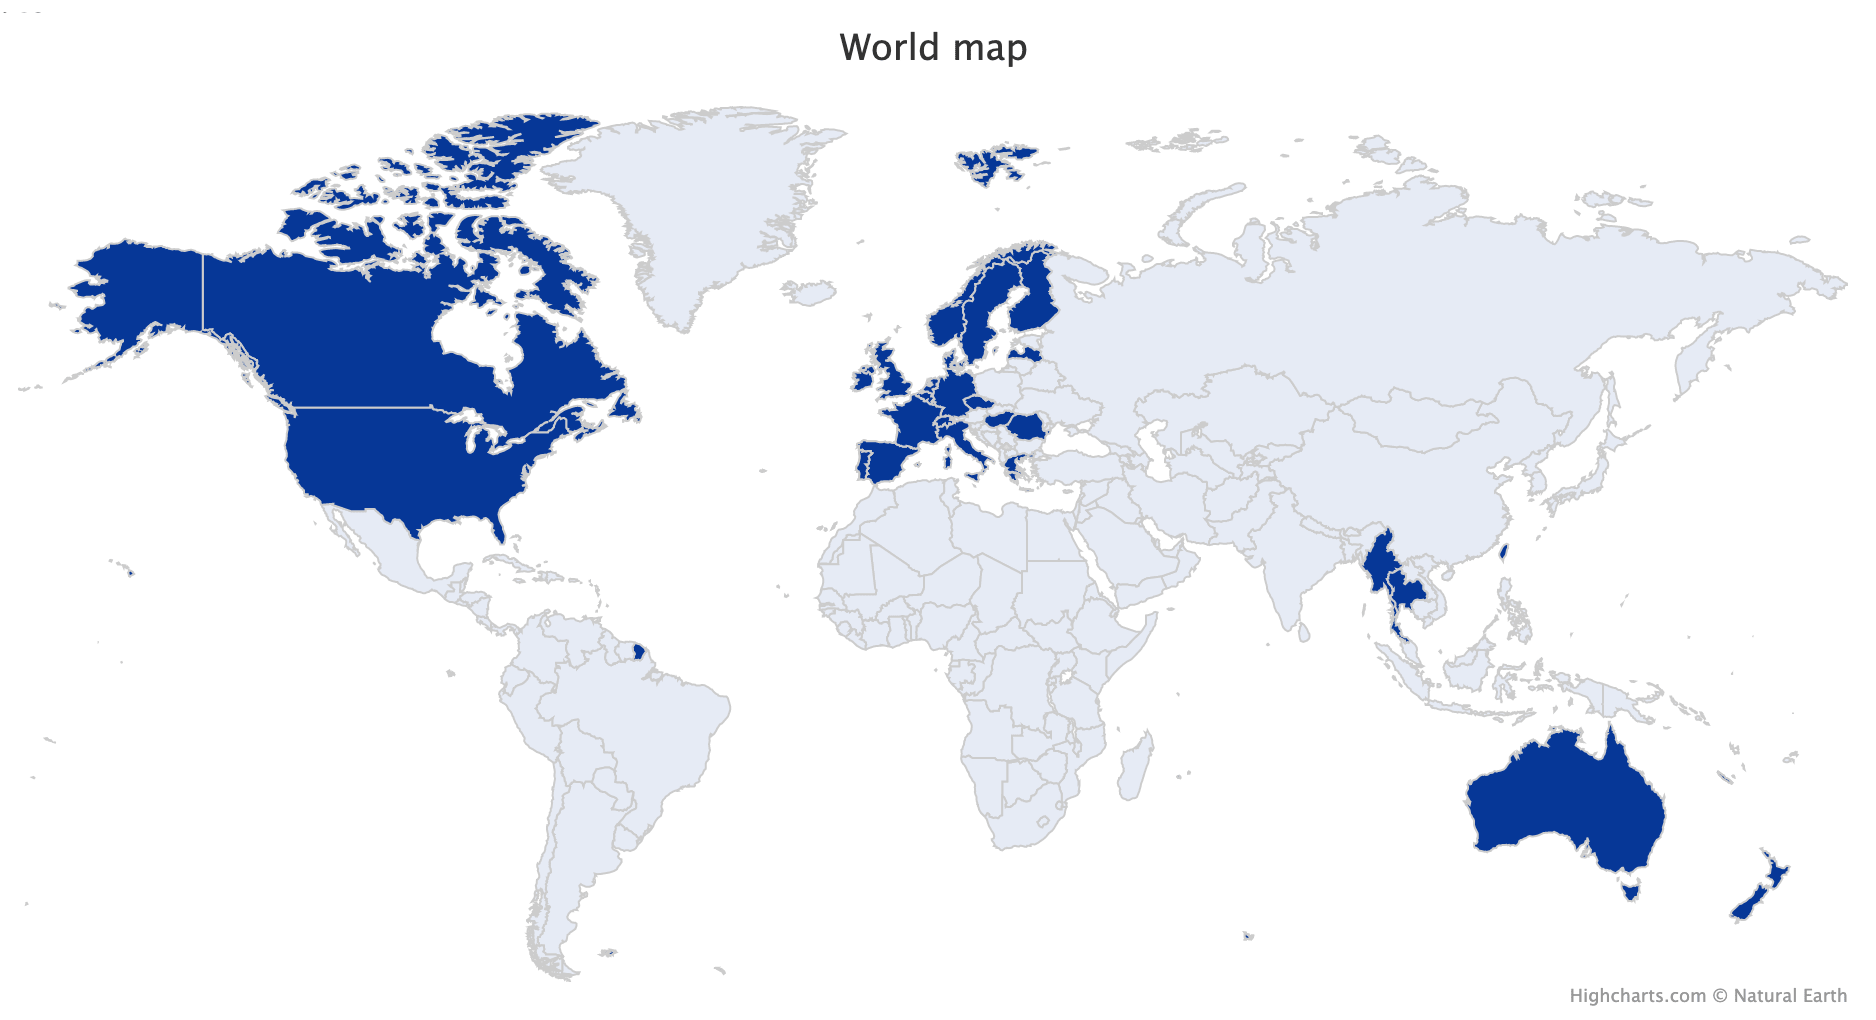
This article illustrates how to draw a world map of the countries you have visited in R. This world map can also be used to highlight some specific countries| Stats and R
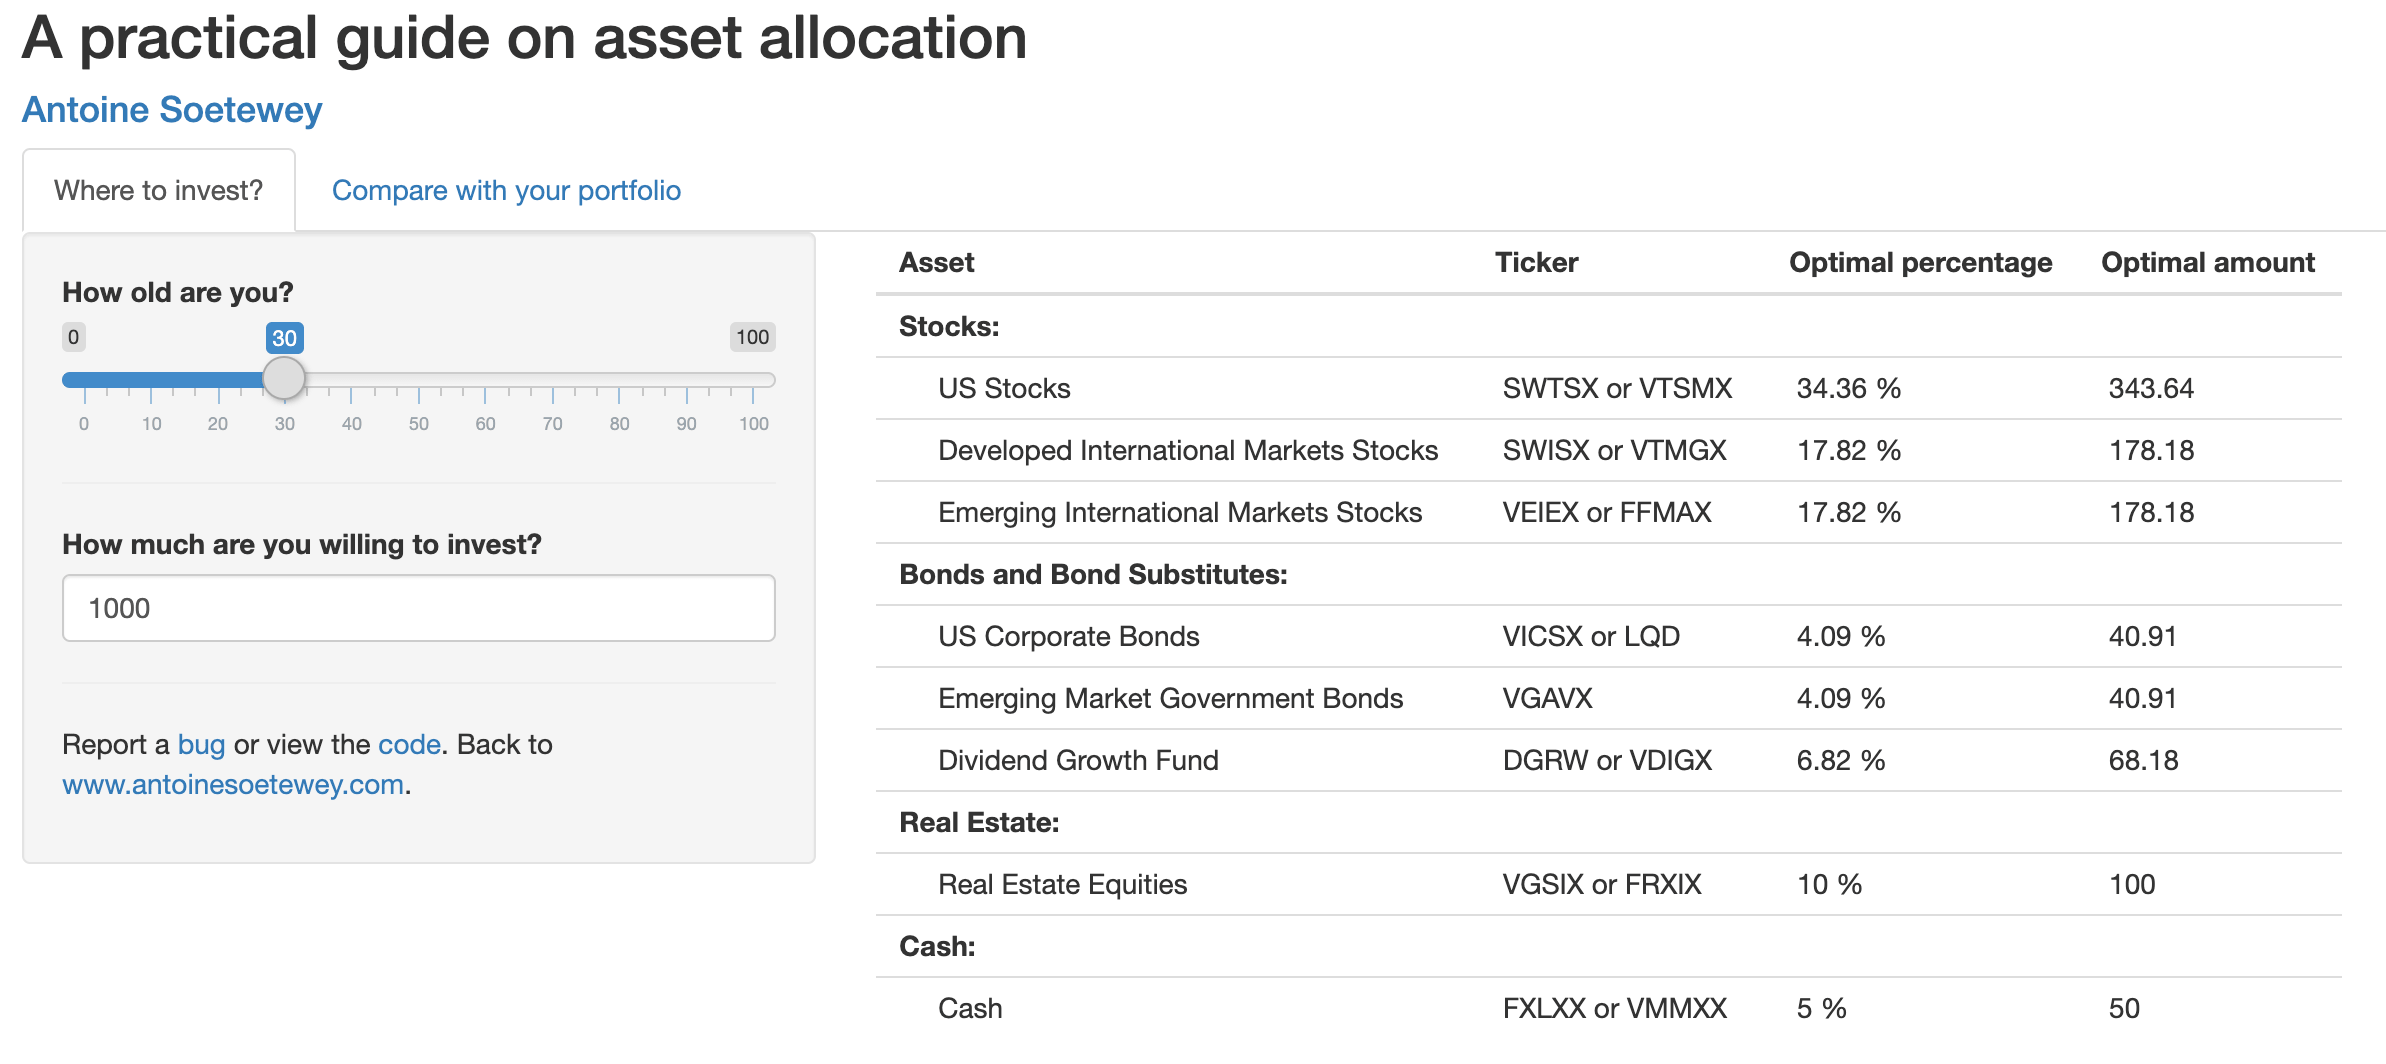
Use this practical guide on optimal asset allocation to follow Burton G. Malkiel's recommendations from his best-selling book A Random Walk Down Wall Street| Stats and R
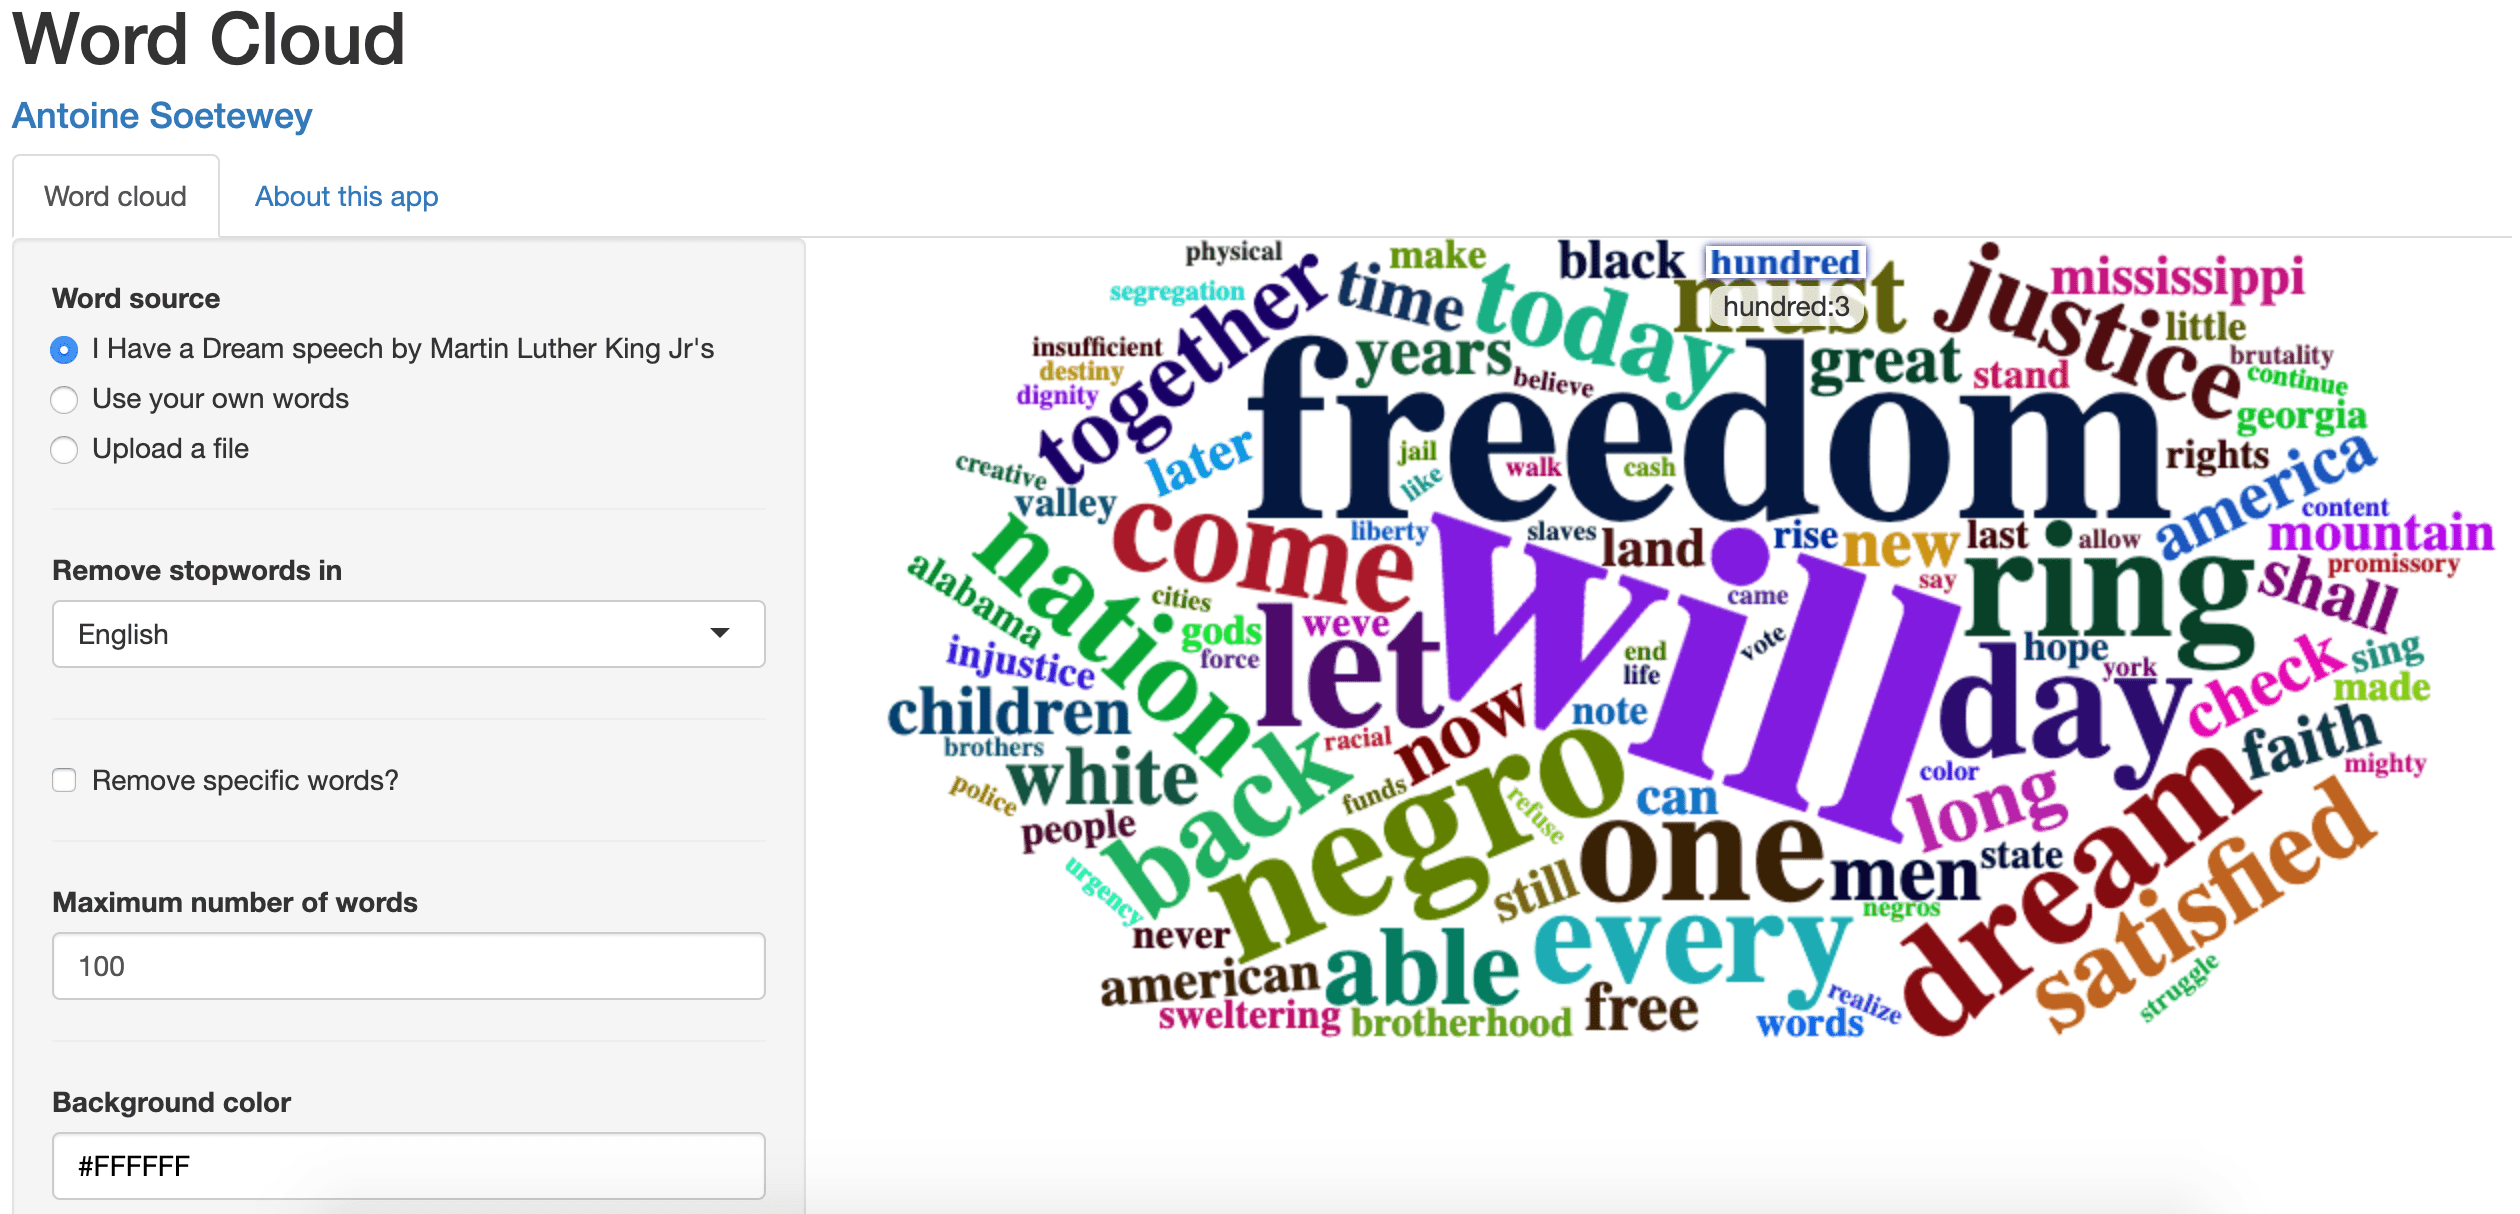
Word clouds are often used in a text mining analysis. See how to draw a word cloud in R thanks to a Shiny app. See also some examples or use your own dataset| Stats and R

After having built your Shiny app in R, this articles shows you, step-by-step, how to embed your Shiny app into your website or blog using Hugo and blogdown| Stats and R
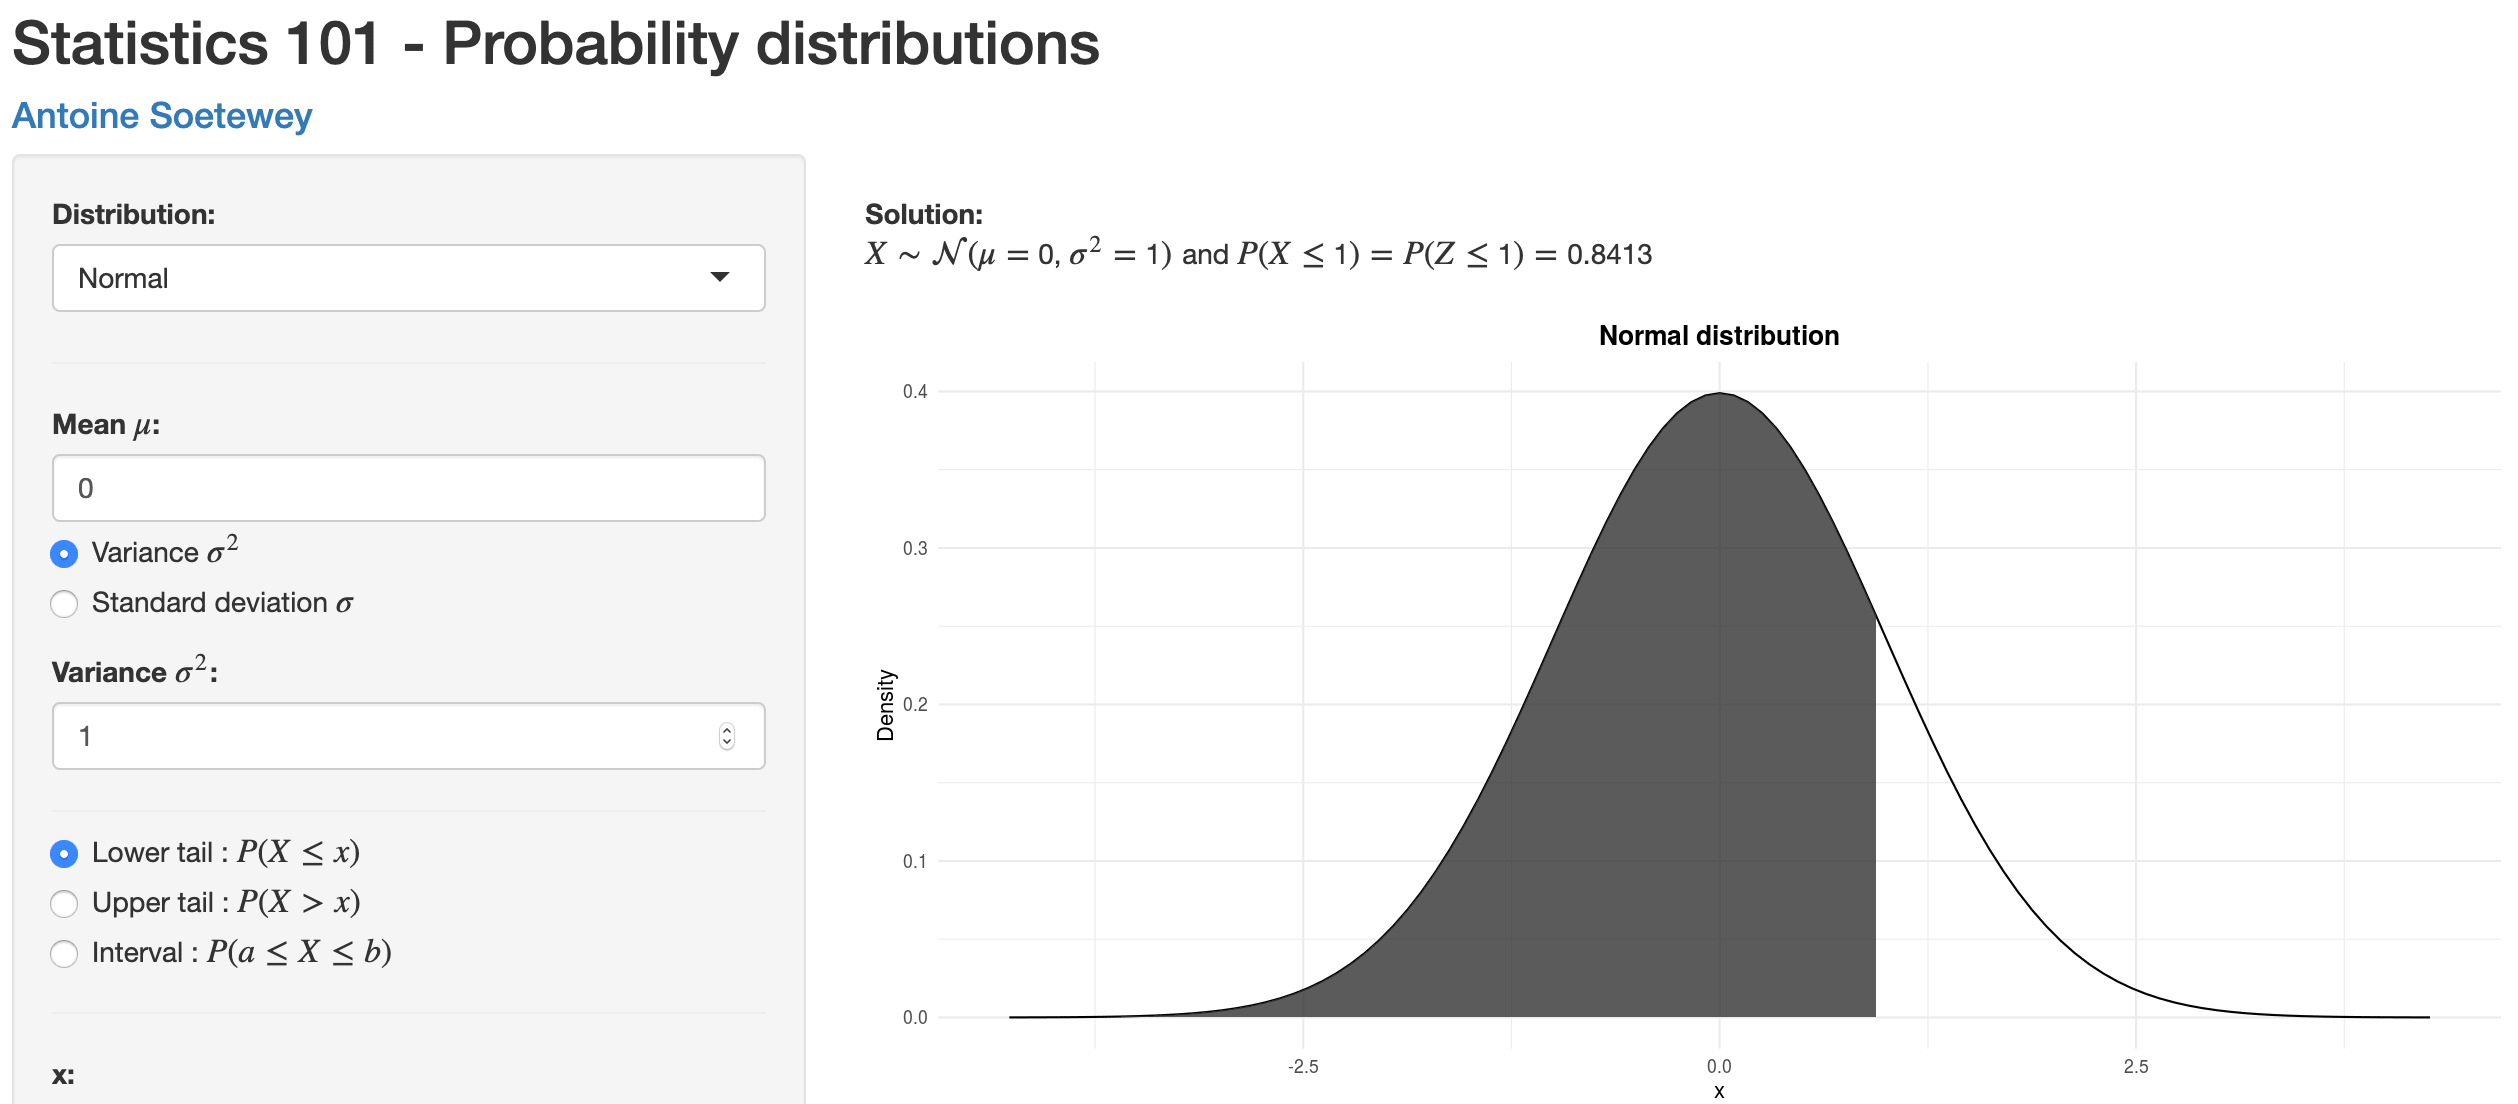
Learn how to use a Shiny app to compute probabilities for different probability distributions, used as a guide to read the most common statistical tables| Stats and R

Get updates every time a new article is published by subscribing to this blog. No spam, and unsubscribe at any time| Stats and R

Learn about the five most common data types in R, numeric, integer, character, factor and logical. See also how to recognize the different data types in R| Stats and R

Learn the differences between a quantitative continuous, quantitative discrete, qualitative ordinal and qualitative nominal variable via concrete examples| Stats and R

This articles shows you how to create a responsive, dynamic and searchable booklist with your Amazon affiliate links automatically included in it using R| Stats and R
This is my personal blog written and edited by me (Antoine Soetewey). Your use of this website, in any and all forms, constitutes an acceptance of these terms and policies. This page is reviewed and revised from time to time. All content provided is for informational purposes only. The articles and posts on this website are my own and do not necessarily represent the positions, strategies, or opinions of my employer or its subsidiaries.| Stats and R

See the main functions to manipulate data in R such as how to subset a data frame, create a new variable, recode categorical variables and rename a variable| Stats and R
A list of all the pages and articles found on the blog. If you cannot find what you are looking for, do not hesitate to contact me. For you robots out there is an XML version available for digesting as well. Pages Home Blog Tags About Contact Subscribe to the newsletter FAQ - Frequently asked questions Contribute - Guest post Support the blog Press Terms and policies Sitemap| Stats and R

After having installed R and RStudio, learn several ways to import an Excel, CSV or SPSS (.sav) file into RStudio via the code or in a more user-friendly way| Stats and R
Thanks in advance for contacting me. In order for me to answer you as soon as possible, here are the best communication methods: Due to the increasing number of questions received, responding to each of them by email has become unmanageable and unproductive. Therefore, if you have a question regarding the content of an article, I invite you to add it as a comment at the end of the corresponding article.| Stats and R

This article explains what is R and RStudio (an open source statistical software program), and how to install it. Some examples of basic code are also presented| Stats and R
Learn more about the author of the blog Stats and R---Antoine Soetewey---and the motivations behind his blog| Stats and R

Hello readers! This is the first article of a blog aimed at making statistics easy to understand by illustrating with concrete examples and using plain English| Stats and R

Learn how to scrape Yahoo search engine results with R using the rvest package| Stats and R
