Discovering Power BI’s Bookmarks: A Journey from Tableau to Power BI Over the past year, I’ve been learning how to use Power BI. After years of working with Tableau as my data visualization tool of choice and using other software only when necessary, I decided to explore another BI platform more thoroughly. Learning another tool […]| Kaleido Analytics
Kaleido is Sellers Dorsey’s virtual learning and training platform offering a kaleidoscope of courses, coaching, templates, and collateral materials to develop and support health and healthcare organization’s analytics staff. Our platform empowers professionals to expand their knowledge and skills in data analytics, dashboard visualization and development, and public health and healthcare data expertise, plus access […]| Kaleido Analytics
Despite the countless hours I’ve spent using Tableau (I’ve been using it for a decade!), and the wealth of knowledge I have about the tool (I’m a Hall of Fame Visionary!), I still come across “new-to-me” tips all the time. In this blog post, I’m going to share four tips that I have come across […]| Kaleido Analytics
In a world where data guides our actions, dashboards are essential for decision-making. Yet, what if the visuals and tools we rely on to share this data aren’t accessible to all individuals? For example, imagine the challenges faced when the screen readers that some people depend on can’t read charts, when colors are indistinguishable for […] The post Accessible by Design: Making Data Visualization More Inclusive with Tableau appeared first on Kaleido Analytics.| Kaleido Analytics
It is essential, in any dashboard build, to decide how to handle dates. How dates are formatted, displayed, and aggregated determines the charts that will be used, the comparisons that are involved, and the interpretation by end users. As developers, we must strike a balance between providing users with flexibility and guiding them directly to […] The post Managing Dashboard Date Filters appeared first on Kaleido Analytics.| Kaleido Analytics
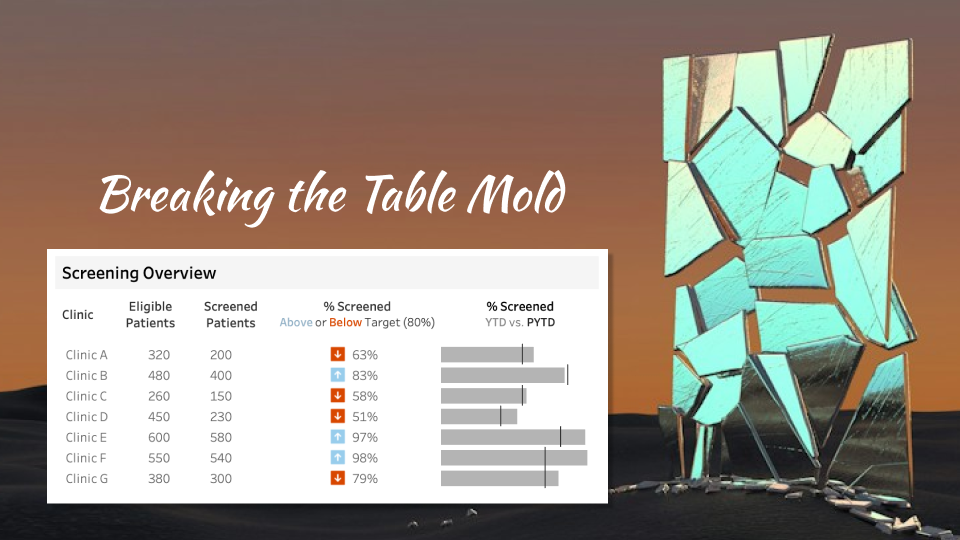
You may have seen my previous blog post, A Review: Tableau’s Table Viz Extension, in which I reviewed Tableau’s Table Viz Extension and listed its pros and cons (if you haven’t checked it out, please do!). I wanted to see if this extension could replace the ‘Tableau trickery’ I use when creating a customized table […]| Kaleido Analytics
Tableau is a data visualization tool, and if you use it frequently, you are aware of its amazing strengths and occasional weaknesses. Tableau is not designed for image creation or, frankly, image use. Because of this, there are considerations and workarounds to ensure images maintain quality and are easy to use within Tableau. Remember, Tableau […] The post Image Tricks in Tableau appeared first on Kaleido Analytics.| Kaleido Analytics
Tableau is an incredibly versatile tool for creating data visualizations that can bring your insights to life. However, how you format these visuals can affect how easily your audience understands and interacts with your data. Whether you’re just beginning your Tableau journey or a seasoned pro, mastering formatting is key to taking your projects to […] The post Six Easy Tableau Formatting Tips to Save You Time appeared first on Kaleido Analytics.| Kaleido Analytics
It’s no surprise that we love working with health and healthcare data. We get to work alongside amazing organizations that are using data to make big differences in their communities. That’s why it’s extremely rewarding when we can work with organizations, such as the Department of Health in the District of Columbia (DC Health), to […] The post DC Health Launches Two Key Public Health Dashboards appeared first on Kaleido Analytics.| Kaleido Analytics
Throughout my years working in data visualization, I have experienced an intriguing evolution. When I started using Tableau 10 years ago, I was interested in two vastly different ends of the spectrum of data visualizations: foundational concepts, such as building a bar chart and calculating aggregations accurately, and impractical concepts, such as creating a radial […] The post Custom Lists with Parameter-Driven Filter Buttons appeared first on Kaleido Analytics.| Kaleido Analytics
In today’s digital world, we can view websites and data visualizations wherever we go – on a laptop, tablet, or mobile phone. However, just because we can access digital material on various devices doesn’t mean that the content has been optimized or built for the device we are using at the time. Mobile Frustration Have […] The post Designing Mobile-Friendly Dashboards: A Case Study with NJ-SHO appeared first on Kaleido Analytics.| Kaleido Analytics
Understanding Usability Testing If I were to ask you to go to an airline website and book me a plane ticket to Hawaii, would you do it? If yes, you may be my new best friend! Joking aside, how would you purchase my ticket? Once on the website, what steps would you take to book […] The post Five Star Rating: Usability Testing for Data Visualizations appeared first on Kaleido Analytics.| Kaleido Analytics
Let’s Start Fresh with a Reset! Filters in Tableau allow users to drill down to the data of interest. While this option makes data exploration fun, resetting multiple filters back to ‘All’ one-by-one can be time-consuming, primarily if numerous filters exist. A Reset button that with one click resets all filters and sets to “All” […] The post Create a Reset Button for Dashboard Filters & Sets appeared first on Kaleido Analytics.| Kaleido Analytics
I use many workarounds to create complex and customized data visualizations in Tableau. One visualization that requires some “Tableau trickery,” as we like to say, is a table-like view where different chart types can be combined into columns. For example, the table may contain a column of text, a column showing shapes (such as up […]| Kaleido Analytics
At the start of every year, many organizations and individuals release some variation of a “Top 10” list, often summarizing the prior year or making predictions for the coming year. For example, good friends of mine, Ken and Kevin (aka the Flerlage Twins), annually share their favorite visualizations from the prior year. Tableau Public also […]| Kaleido Analytics
The Center for Disease Control and Prevention (CDC) has been pivotal in the nation’s mission to address and understand the health of our communities and citizens. As part of that mission, the CDC has worked with states to collect data to better respond to national and local trends. The Department of Health in the District […]| Kaleido Analytics