When we set a memory limit for a container, the expectation is simple: if the app leaks memory, the OOM killer steps in, the container dies, Kubernetes restarts it, done. But reality is messier. As a container gets close to its memory limit, allocations don’t just fail instantly. They get slower. The kernel tries to... The post Memory stall: the agony before OOM appeared first on Coroot.| Coroot
Recently, I was testing Coroot’s AI Root Cause Analysis on failure scenarios from the OpenTelemetry demo. One of them, loadgeneratorFloodHomepage, simulates a flood of excessive requests. As expected, it caused a latency degradation across the stack. Coroot’s RCA highlighted how the latency cascaded through all dependent services. At the same time, we noticed a moderate...| Coroot
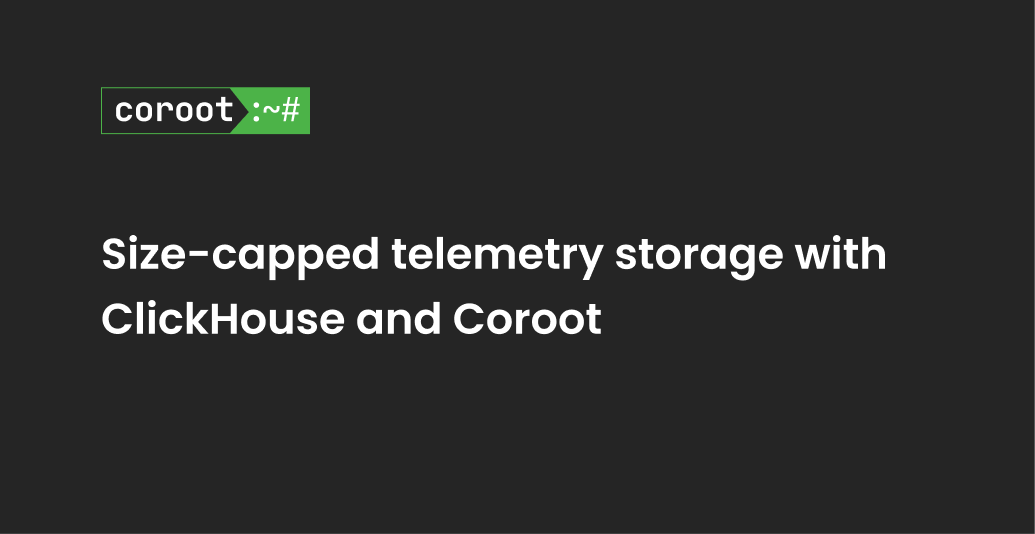
Coroot now supports size-based retention for telemetry stored in ClickHouse. Automatically clean up old data when disks fill up, no matter how many days it covers.| Coroot
Nowadays, in the era of microservices, infrastructures have become super-complex: dynamic nodes provisioning, autoscaling, dozens or even hundreds of containers working side by side. The post Delay accounting: an underrated feature of the Linux kernel appeared first on Coroot.| Coroot
Looking through endless postmortem reports and talking to other SREs, I feel that about 80% of outages are caused by similar factors: infrastructure failures, network errors/delays The post Mining metrics from unstructured logs appeared first on Coroot.| Coroot
Meet Coroot, a virtual assistant who audits your telemetry data, finds the root cause of an outage and provides you with a list of possible fixes| Coroot
GPUs are everywhere powering LLM inference, model training, video processing, and more. Kubernetes is often where these workloads run. But using GPUs in Kubernetes isn’t as simple as using CPUs. You need the right setup. You need efficient scheduling. And most importantly you need visibility. This post walks through how to run GPU workloads on... The post Working with GPUs on Kubernetes and making them observable appeared first on Coroot.| Coroot
Most of the time, nothing’s broken. Traffic’s flowing, alerts are quiet, and everything seems fine. That’s peacetime, when no one’s getting paged. Coroot helps in both peacetime and wartime. When things go wrong, it guides you to the root cause fast. But during peacetime, it helps you spot risks early, clean up inefficiencies, and prevent... The post Peacetime Observability: Spotting Risks Before They Become Incidents appeared first on Coroot.| Coroot
We’re excited to announce the release of Coroot 1.11! This version comes with powerful new features designed to give you more control over your observability data and make your troubleshooting process faster and more intuitive. Let’s dive into what’s new. Cloud Costs Monitoring Improvements Before Coroot 1.11, cost calculation was supported only for AWS, GCP,... The post Coroot 1.11: What’s New appeared first on Coroot.| Coroot
Figuring out why things break still sucks. We’ve got all the data: metrics, logs, traces, but getting to the actual root cause still takes way too long. Observability tools show us everything, but they don’t really tell us what’s wrong. So why do we even need to automate root cause analysis? First, time. Outages are... The post We built AI-powered Root Cause Analysis that actually works appeared first on Coroot.| Coroot
Java applications run on top of the JVM — a powerful but complex runtime environment that re-implements many OS features. It has its own memory management, garbage collector, and dynamic code compiler (JIT). While these features help with performance and portability, they often make troubleshooting a real challenge. At Coroot, we recently improved our support... The post Troubleshooting Java Applications with Coroot appeared first on Coroot.| Coroot
Modern apps are built by many teams, each owning a different set of services: APIs, background jobs, databases, platform components, and more. As the system grows, it gets harder for each team to focus on what actually matters to them.When everything is mixed together, dashboards get messy, service maps are too large to be useful,... The post Team-oriented Observability with Coroot appeared first on Coroot.| Coroot
Kubernetes-Native Database Monitoring Made Easy From day one, we built Coroot to work beyond just Kubernetes. Many teams still run databases and other stateful services on dedicated VMs or bare-metal servers. But that’s starting to change. More and more teams no longer see Kubernetes as a platform just for stateless apps. Powerful Kubernetes operators now... The post Kubernetes-Native Database Monitoring with Coroot v1.9: Postgres, Redis & More appeared first on Coroot.| Coroot
There is a phenomenal amount of Observability tools on the market, coming in all shapes and sizes, offering many tools and approaches to solve what seems to be an endless number of problems. It also can be overwhelming to use, hard to set up and expensive to run, especially if you are going with SaaS... The post Essential Observability with Coroot appeared first on Coroot.| Coroot
When you build software, its terminology, concepts and relationship between them is quite obvious to you, when you’re starting to use software built by someone else – might not be so much so. In this blog post I tried to cover most important Coroot concepts and terminology – reading it will hopefully help you... The post Getting started with Coroot: Concepts and Terminology appeared first on Coroot.| Coroot
You are running a complex, mission-critical application, and you understand you need an advanced Observability solution to efficiently troubleshoot and proactively prevent issues. Yet you have a choice to make—should you choose a “Fully Managed” SaaS solution such as Datadog, Newrelic, or Dynatrace, or should you pick an Open-Source solution that you can host yourself?... The post Observability: Self Hosted vs Fully Managed – Exploring the choices appeared first on Coroot.| Coroot
In this blog post we will look at filetop command. It is available in BCC tool collection. Background Disk IO is one of the key activities happening on the system, especially for data intensive systems running databases or serving files. Disk IO can frequently be a bottleneck, impacting performance of the system, it also can... The post filetop – eBPF Command Line Tools appeared first on Coroot.| Coroot
Back to All Posts In this blog post we will look at gethostlatency command. It is available in both BCC and bpftrace tool collections. Background Most applications and services use hostnames, rather than IP addresses to communicate with other services. This means before connection to the service can be established, another request needs to... The post gethostlatency – eBPF Command Line Tools appeared first on Coroot.| Coroot
In this blog post we will look at runqlat and runqslower commands. They are available in both BCC and bpftrace tool collections. Background One of the core functions of Linux operating system is to schedule processes across available CPUs. When service gets a request, Linux typically will need to schedule the process, processing that... The post runqlat and runqslower – eBPF command line tools appeared first on Coroot.| Coroot
eBPF is a powerful technology used by many observability solutions, including Coroot. While web-based observability tools like Coroot are invaluable, there’s a specific class of eBPF tools that often go overlooked (besides Brendan Gregg of course): eBPF Linux Command Line Tools. These tools are essential for diving deep into complex performance issues. The Power of... The post eBPF Linux Command Line Tools appeared first on Coroot.| Coroot
When discussing the technical foundations of observability, several key components, often referred to as the “pillars,” emerge. While there is no universally agreed-upon number of pillars, this post will focus on four fundamental elements: metrics, logs, traces, and profiles. Metrics, logs, and traces Metrics: Numerical representations of system behavior over time. They provide a high-level... The post The four pillars of observability appeared first on Coroot.| Coroot
Observability has become a cornerstone of modern software development, but implementing and effectively utilizing observability solutions can be fraught with challenges. This post explores common hurdles organizations face and provides insights into how Coroot can address them. Common observability challenges Deploying and managing observability systems often presents significant obstacles: Firstly, the process of installation and... The post Conquering observability challenges with Coroot ap...| Coroot
Peter Zaitsev, Co-founder of Coroot, aptly highlighted the dramatic shift in application architectures over the past two decades. Once monolithic and manageable, applications have transformed into intricate webs of microservices. This evolution has introduced unprecedented challenges in understanding system behavior and ensuring optimal performance. In the early 2000s, applications were relatively simple, often consisting of... The post Understanding observability: What we can observe? appear...| Coroot
If you look at typical Application interaction with service point it tends to happen in two stages – first we connect to the Service and when we are interfacing through that established connection. In this description though one thing stays invisible – you can’t simply connect to the Service through the hostname – that host... The post Why should you care about DNS Observability? appeared first on Coroot.| Coroot
Join our July 16th Webinar (12 PM EDT) and Unlock Observability’s Power Register now Meet your speaker Peter is a serial entrepreneur and co-founder of Percona, FerretDB, and other tech companies. As a leading expert in open-source strategy and database optimization, Peter has applied his technical knowledge and entrepreneurial drive to contribute as a board... The post What Developers Should Know about Observability appeared first on Coroot.| Coroot
Back to All Posts As I was working in the early and mid 2000s in the database space, there was Oracle which was a “big bad wolf”, having a very close grip on their customers and not hesitating to squeeze more juice from them at every opportunity. This, of course, was bad for innovation as... The post Datadog is the new Oracle appeared first on Coroot.| Coroot
The RED (Rate, Errors, Duration) method is a popular approach to instrument and troubleshoot microservices applications. In Coroot – Open Source observability platform – we have designed an effective interface allowing to use RED method with Distributed Tracing and OpenTelemetry (OTEL) generated data. Let’s start from the system’s overview This summary gives us everything you need... The post Implementing RED Method with Distributed Tracing appeared first on Coroot.| Coroot
Back to All Posts I come from the database world where observability, or monitoring as we used to call it, was always really important to keep databases up and running and operating well. Thousands of data points would be collected and displayed in countless graphs. As an expert DBA, you can see every detail about... The post It is the time to simplify Observability! appeared first on Coroot.| Coroot
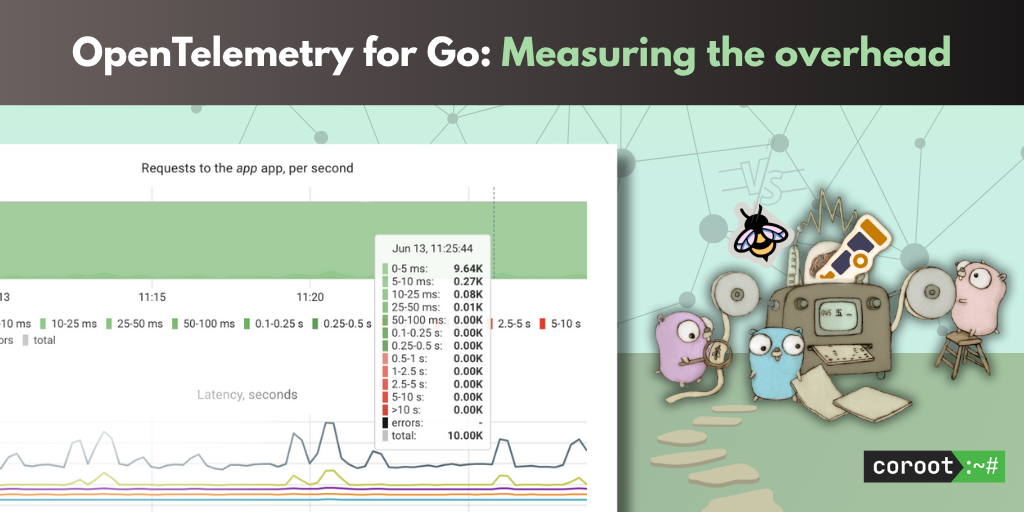
We benchmarked the overhead of OpenTelemetry in a high-load Go application and compared it to eBPF-based instrumentation. The results may surprise you - tracing adds cost, but it’s not always a dealbreaker| Coroot