Scott Irwin and Darrel Good - Scott Irwin - In today's farmdoc daily article, we review the last 17 years of Illinois corn, soybean, and wheat prices to evaluate “new era” projections that farmdoc first made in September 2008. Our original projections of the average monthly prices for the three crops turned out to be remarkably accurate, with less than 2% error in each case. It is clear that a truly new era in nominal corn, soybeans, and wheat prices started in the Fall of 2006 and that t...| farmdoc daily
Since 2020, the renewable diesel boom has disrupted longstanding soybean pricing relationships. Soybean oil's share of crush value jumped from 25-35% to 35-50% and values and crush margins became significantly more volatile. Historical models predicting soybean prices based on oil and meal values have broken down, making price forecasting more difficult.| farmdoc daily
In our previous article (see farmdoc daily, October 1, 2025), we found that most farms maintained healthy solvency ratios, with debt-to-asset levels remaining relatively stable or improving over the past…| farmdoc daily
Conservation compliance, including the Swampbuster provisions at issue in the lawsuit discussed in this article, were the policy response to substantial problems on the ground and for farm fields. Those problems can be traced to the Dust Bowl of the 1930s and a return of wind erosion problems during droughts of the 1950s. More directly, conservation compliance traces to the reckless policy decisions in the early 1970s, including the Agriculture and Consumer Protection Act of 1973.| farmdoc daily
Cash storage of corn and soybeans after June is generally not profitable as price declines on average and in a majority of years. Net return to cash and futures hedged storage of corn and soybeans that ends no later than June does not differ statistically from $0. On average, returns just cover the total cost of storage. The preceding finding nevertheless is consistent with building on-farm storage since on-farm storage provides other opportunities to improve farm profitability.| farmdoc daily
We began publishing a formula in 2017 for calculating the average cash rent for a piece of farmland, given that farm’s average productivity index, thereby allowing averages to be stated by productivity, a known factor that impacts the level of cash rent. We have updated this formula to reflect the average cash rents for 2025, as reported by the National Agricultural Statistics Service (NASS). An individual can use this formula to calculate the average cash rent for a farm.| farmdoc daily
U.S. and Brazilian farmers compete directly in global markets. Input-level discrepancies underscore the comparative advantage U.S. farms maintain in fertilizer and chemical costs, particularly for soybeans. However, the seed cost disadvantage in 2024 for U.S. soybean producers warrants closer scrutiny. Understanding the drivers behind this gap, like government policy or commercial strategy, and identifying opportunities to reduce it, will be critical for maintaining U.S. competitiveness.| farmdoc daily
The Purdue University-CME Group Ag Economy Barometer index is computed each month to gauge producer sentiment among a group of U.S. agricultural producers (Langemeier and Mintert, 2025). The barometer’s index…| farmdoc daily
This article begins a set of three articles on storing corn and soybeans, a topic of current interest given the size of 2025 US crops (see, for example, Wicks). This…| farmdoc daily
Farms in the high interest expense cohort remain in a cautionary leverage position (debt-to-asset ratio of 30-60%), with rising debt and surging interest costs posing clear financial stress despite asset growth. By contrast, farms in the moderate-high interest expense cohort have generally strengthened their balance sheets, keeping leverage in the strong range (debt-to-asset ratio| farmdoc daily
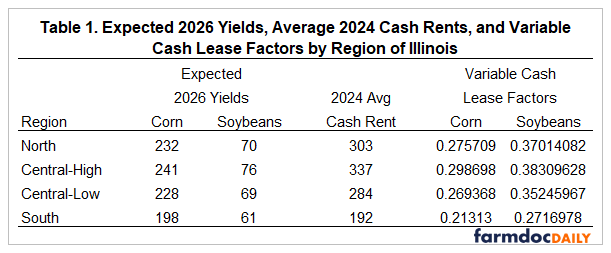
Nick Paulson, Gary Schnitkey, and Carl Zulauf - Today’s farmdoc daily article provides a revision to the rent factors used in a simple variable cash lease design. The revisions result in slightly smaller rent factors to be applied to measures of corn and soybean revenue to determine variable cash rents. While the decline in crop revenues from highs in 2022 results in larger reductions in variable cash rents than those observed in average cash rents, farmer returns and return projections rem...| farmdoc daily
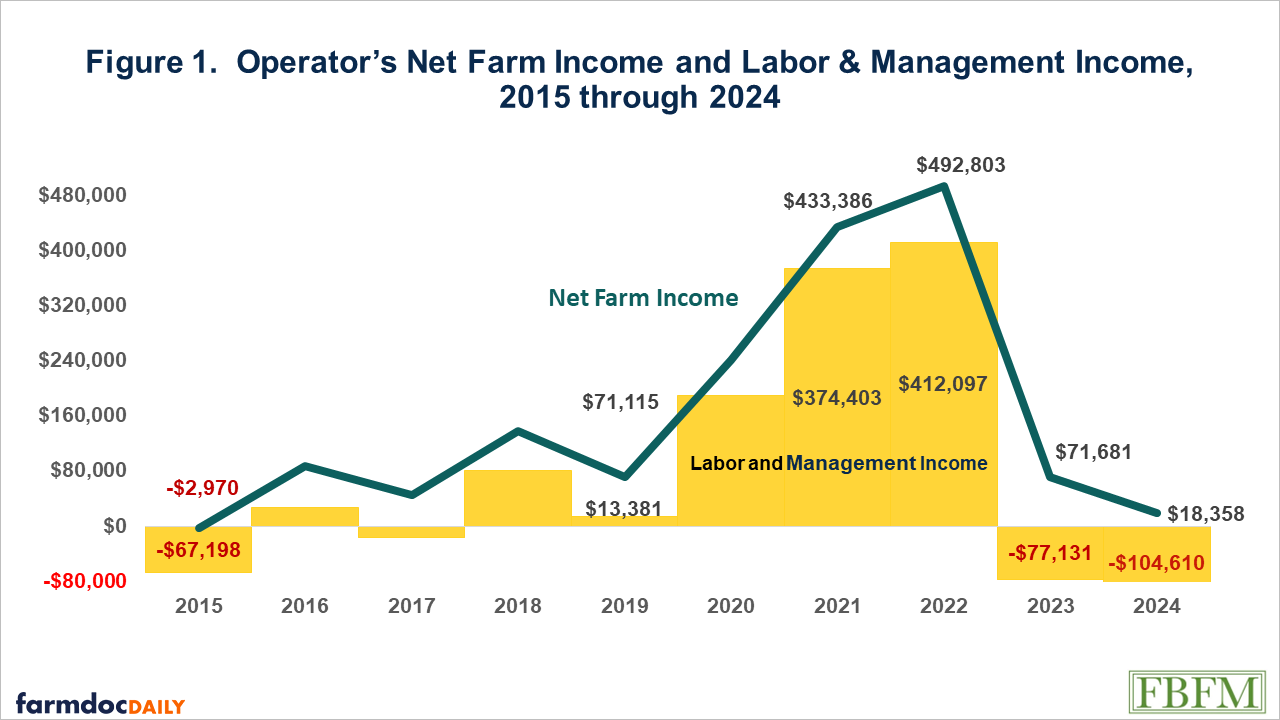
Bradley Zwilling - Based on Illinois FBFM records, average farm operator returns for labor and management on 2,009 Illinois farms were lower for all geographic areas in the state in 2024 compared to 2023 and below the average for the last five years. Even with higher yields and lower costs, lower grain prices were the main reasons for the lower incomes. Livestock farmers experienced higher returns due to lower feed prices and higher prices for livestock and livestock products.| farmdoc daily
Nick Paulson, Gary Schnitkey, Brad Zwilling, and Carl Zulauf - Today’s farmdoc daily article highlights our first release of 2026 crop budgets for Illinois. Despite significant increases in expected Agricultural Risk Coverage (ARC) and Price Loss Coverage (PLC) payments due to passage of the One Big Beautiful Bill Act (OBBBA), negative average returns are expected to continue for the fourth straight crop year for producers using corn and soybean rotations on cash rented farmland across all ...| farmdoc daily
Bradley Zwilling - The financial results on all Illinois farms show that on average 2024 was a poorer financial year due to lower incomes. Grain farms had their highest income ever in 2021 and 2022, leading to build ups of cash and other assets. However, after two years of low incomes on grain farms, working cash has decreased almost 40% on the average farm to 2020 levels. With projected continued lower incomes for the rest of 2025 and 2026, farmers will need to find ways to reduce costs whil...| farmdoc daily
Jason Franken and Joe Janzen - USDA NASS recently increased 2025 corn planted acreage estimate to 97.3 million acres. Analysis of acreage enrolled in USDA FSA farm programs suggests this may be conservative, with FSA data implying even higher corn acreage around 98.1 million acres. Big corn acres will likely limit the potential for higher corn prices in the coming marketing year.| farmdoc daily
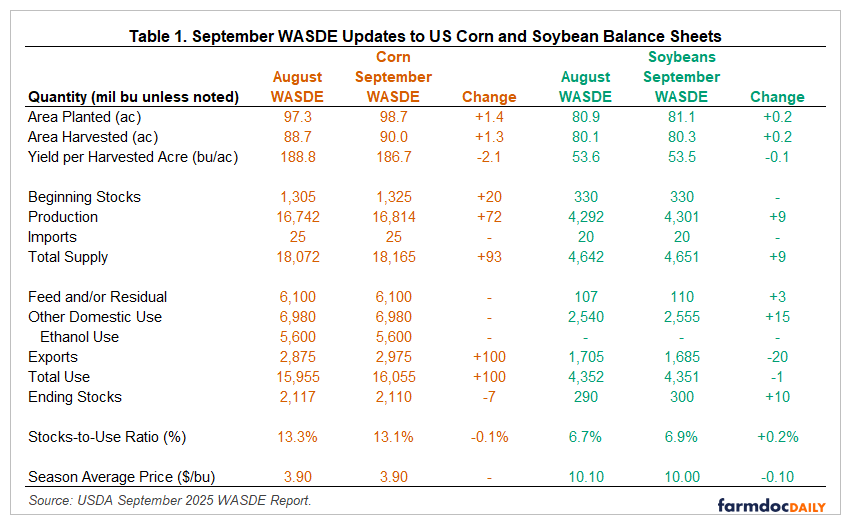
Joe Janzen - Corn and soybean futures reversed initial negative reactions to September 12's bearish USDA report, which lowered yields by less than expected and increased acreage estimates. Despite some fundamentally bearish data, prices ended up for the day. Markets appear skeptical of USDA yield estimates given recent dry weather, leading to an uneven price reaction to the most recent report.| farmdoc daily
Nick Paulson, Gary Schnitkey, Henrique Monaco, and Carl Zulauf - Farmers will begin to consider management decisions for the 2026 crop year as fall approaches and the 2025 growing season winds down. A near term decision will be pricing and purchasing nitrogen fertilizer for fall nitrogen applications. Today’s article provides an update on average fertilizer prices for Illinois and discusses strategies farmers can and do use to price their nitrogen fertilizer.| farmdoc daily
Maria Kalaitzandonakes, Jonathan Coppess, and Brenna Ellison - Using results from the Gardner Food and Agricultural Policy Survey, we find that awareness of Make America Healthy Again (MAHA) remains high and continues to be popular overall, however, support over the last three months, particularly amongst Democratic respondents, has waned some. Results also show that the respondents reported that MAHA is less aligned with their values than three months prior. Across parties, respondents’ ag...| farmdoc daily
Michael Langemeier, Michael Boehlje, and Joana Colussi - Midwest crop producers have experienced a significant downturn in prices since late 2023, resulting in a drop in net returns in 2024. Farms with low profitability and high solvency levels are typically financially stressed. This article used the operating profit margin ratio and the debt-to-asset ratio to create a measure of financial stress. Specifically, farms with a negative operating profit margin ratio and a debt-to-asset ratio abo...| farmdoc daily
Dale Lattz, Gary Schnitkey, Nick Paulson, and Carl Zulauf - Machinery cost estimates for 2025 have been released and are available in the Management section on the farmdoc website. Machinery costs are updated every two years, with the last update occurring in 2023. As is usual, estimated machinery costs have increased, with most increases in the 1% to 14% range. The increases from 2023 to 2025 are less than the increases estimated between 2021 and 2023, when many costs increased by as much as...| farmdoc daily
The farmdoc daily website offers research-based analysis for farmers, educators, journalists, traders, market analysts, and policy-makers around the globe. The overall goal of the farmdoc project - to provide U.S. Corn Belt crop and livestock producers with constant access to integrated information and expertise to better manage their farm businesses.| farmdoc daily
Nick Paulson, Gary Schnitkey, Carl Zulauf, and Jonathan Coppess - Nick Paulson - Tariffs on imports from Canada, Mexico, and China have the potential to increase the prices paid by consumers and products for goods, services, and inputs from those major US trading partners. Fertilizers are such an input for US farmers. Price increases would likely be greatest for potassium (K) given the US reliance on imports, in particular imports from Canada. Impacts would likely be smaller for nitrogen (N) ...| farmdoc daily